Abstract
Research on freshly-excised malignant breast tissues and surrounding normal tissues in an in vitro impedance cell has shown that breast tumors have different conductivity and permittivity from normal or non-malignant tissues. This contrast may provide a basis for breast cancer detection using electrical impedance imaging. This paper describes a procedure for collecting electrical impedance spectroscopy data simultaneously and in register with tomosynthesis data from patients. We describe the methods used to analyze the data in order to determine if the electrodes are making contact with the breast of the patient. Canonical voltage patterns are applied and used to synthesize the data that would have resulted from constant voltage patterns applied to each of two parallel mammography plates. A type of Cole–Cole plot is generated and displayed from each of the currents measured on each of the electrodes for each of the frequencies (5, 10, 30, 100 and 300 kHz) of applied voltages. We illustrate the potential usefulness of these displays in distinguishing breast cancer from benign lesions with the Cole–Cole plots for two patients—one having cancer and one having a benign lesion—by comparing these graphs with electrical impedance spectra previously found by Jossinet and Schmitt in tissue samples taken from a variety of patients.
Keywords: impedance imaging, breast cancer, impedance spectrum, Cole–Cole plot, canonical pattern
1. Introduction
Electrical impedance imaging (EII) is the technology to make images of the electrical properties of the interior of a body from measurements of voltage and current made at electrodes applied to the body's surface. When these measurements are made across a wide spectrum of frequencies, the term ‘impedance spectroscopy’ is used. EII offers promise as a screening tool and diagnostic adjuvant to detect breast cancer (Cherepenin et al 2002, Kerner et al 2002, Malich et al 2001). The system described by Cherepenin is now sold in Russia, and that described by Malich has been sold in Europe in the past.
Several investigators have reported significant electrical differences between carcinoma, benign lesions and normal tissues in freshly-obtained mastectomy tissue samples (Jossinet 1998, Surowiec et al 1988) or by introducing a probe into the breast (Morimoto et al 1990). These differences manifest as different conductivity and permittivity, or equivalent parameters, at different frequencies, generally ranging between a few hundred Hz to 10 MHz or above. The objective of EII is to find whether these distinctions seen in excised tissue can be found transcutaneously. Several recent studies have shown progress toward this goal. Poplack et al (2004) have documented the impedance of normal breasts at 125 and 950 kHz. Kerner et al (2002) studied 26 patients at frequencies between 10 and 950 kHz. They reported focal inhomogeneities in breasts with malignancies, but with limited sensitivity and specificity. Later work by this group (Soni et al 2004) showed regional differences in conductivity and permittivity between normal and abnormal subjects. Plots of complex impedance showed shifts to higher impedance in some abnormal breasts, and generally greater variability among abnormal breasts.
In this paper, we describe a procedure for collecting electrical impedance spectroscopy data simultaneously and in register with tomosynthesis data from patients. We next describe the methods used to analyze the data in order to determine if the electrodes are making contact with the breast of the patient. We describe the canonical voltage patterns applied and how these patterns can be used to synthesize the data that would have resulted from constant voltage patterns applied to each of two parallel mammography plates. A type of Cole–Cole plot is generated and displayed from each of the currents measured on each of the electrodes for each of the frequencies (5, 10, 30, 100 and 300 kHz) of applied voltages. We illustrate the potential usefulness of these displays in distinguishing breast cancer from benign lesions with the Cole–Cole plots for two patients—one having cancer and one having a benign lesion—by comparing these graphs with electrical impedance spectra previously found by Jossinet and Schmitt (1999) in tissue samples taken from a variety of patients.
2. Methods
2.1. ACT4 system and experiment setup
The ACT4 system is the new electrical impedance imaging system being developed by the Rensselaer group (Ross 2003, Liu et al 2005). It is a high-speed, high-precision, multi-frequency, multi-channel instrument and able to support up to 72 channels. It presently is configured to support 60 electrodes in two 5 × 6 radiolucent arrays. Each electrode is driven by a 16 bit precision voltage source, and has a circuit for measuring the resulting current and voltage. These circuits are digitally controlled to produce and measure signals at 5 to 1000 kHz. The magnitude and phase of each source are controlled independently. Each source, and each voltage and current measurement, is calibrated to a common standard reference (Saulnier et al 2006).
The electrical impedance spectroscopy data are acquired simultaneously in register with tomosynthesis data from patients in figure 1. Clinical technologists have one patient breast prepared using PrepTrode® conductive electrode skin preparation to reduce the contact impedance. Then the breast is compressed between mammography plates that have radiolucent electrode arrays attached (Kao et al 2006). When the breast is ready, it is scanned by the ACT4 system at 5, 10, 30, 100, 300 and 1000 kHz, one scan for each frequency to get the spectrum information. After this, a tomosynthesis scan is applied on the breast. When it is finished, the breast is decompressed and the same procedure is applied on the other breast.
Figure 1.
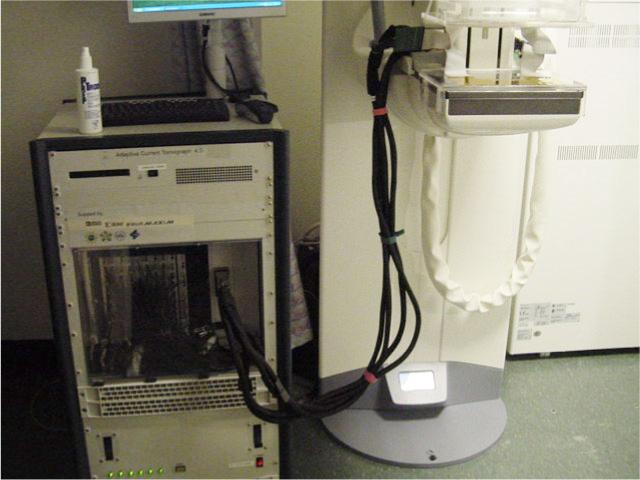
The ACT4 and tomosynthesis systems.
During each EIT scan, 59 orthonormal excitation patterns are used to maximize distinguishability. Voltage levels up to 0.5 V peak are applied at all frequencies. Currents per electrode range up to 0.4 mA peak at 5 kHz and up to 4.9 mA at 1 MHz in 10 mm × 10 mm electrodes. Total applied currents are below 3.5 mA at 5 kHz and below 55 mA at 1 MHz. We note that no patient has ever reported any sensation due to these currents. The threshold for perception of current has not been well-studied at these frequencies, and in this location. It is known to be higher at high frequencies, and extrapolating from data at lower frequencies, we estimate that a large margin of safety is present for these levels. The threshold for physiological consequences beyond perception is even higher, giving a larger safety margin. No current is directed to the body outside the breast.
The EIT data are calibrated before being used to calculate the conductivity (σ) and permittivity (ω∈).
2.2. Find canonical voltage patterns
Since the applied current patterns have influence on the voltage measurement data which contain the information about the unknown admittivity distribution inside the body, it is necessary to apply specific current patterns that maximize the voltage signal. It is known that the current patterns that maximize the voltage patterns correspond to the eigenfunctions of the Neumann-to-Dirichlet map (Gisser et al 1990, Isaacson 1986).
In this paper, we compute canonical voltage patterns that maximize the current signal for a homogeneous medium of the 3D mammography geometry. The procedure for computing the canonical voltage patterns is as follows.
(i) Guess L − 1 orthonormal sets of the real current patterns , defined as
| (1) |
for which and .
(ii) Compute the voltage patterns that would result from applying Qk into the forward solver with a homogeneous admittivity distribution (γ0 = 1).
(iii) Find current patterns Tτ such that Uτ = ρτUτ.
An arbitrary current vector can be represented as a weighted summation of the orthonormal current vectors. So it is possible to write the following identity:
| (2) |
Multiplying both sides of (2) by the resistance matrix that maps currents to voltages, we have the following equation:
| (3) |
Taking the inner product with Qx in (3),
| (4a) |
| (4b) |
| (4c) |
| (4d) |
Here, this indicates that ρτ and Cτ are the eigenvalue and eigenvector of the R matrix. (iv) Compute the eigenvalue ρτ and eigenvector Cτ of the R matrix, and rearrange these with the following ordering
| (5) |
(v) Compute the new current and voltage patterns and in (2) and (3), respectively.
(vi) If the error between ρτ and is less than the tolerance ε, that is,
| (6) |
stop, otherwise replace Qk with and go to step (ii).
(vii) Finally, scale the new voltage patterns by the maximum amplitude allowed (for example, ), which are called as canonical voltage patterns.
In this procedure, the new current patterns usually converge after two to three iterations. These canonical voltage patterns maximize the current signals for a given power and are used as voltage sources for the ACT4 system in the 3D mammography geometry.
2.3. Method to analyze the complex data
The ACT4 system has voltage sources that are used to apply orthogonal sets of voltage patterns. After applying these patterns to the body, ACT4 measures both the applied voltages and the resulting currents through electrodes. The set of measured voltage patterns is generally not orthogonal because the sources are not ideal. In order to use these measured voltages and current patterns in the data analysis, some pre-processing is needed.
(i) Compute the synthesized current patterns that would be produced by real canonical voltage patterns , combining with the complex data (measured voltages Vτ and measured currents Iτ) obtained from the ACT4 system.
Using the canonical patterns Uk for any vector Vτ, the following equation should be satisfied:
| (7) |
Multiplying both sides of (7) by the admittance matrix that is the Dirichlet-to-Neumann map, we obtain the following equation:
| (8) |
Using the inverse matrix of Λ, therefore, we have the synthesized complex current patterns Tk as follows:
| (9) |
(ii) Compute the synthesized current vector that would be produced by real constant voltage vector , defined as:
| (10) |
where M is the magnitude, +M for the top plane and −M for the bottom plane. For any vector W, the following equation should be satisfied
| (11) |
and therefore, the current vector J should be also satisfied as
| (12) |
(iii) Compute and display the admittance Y on the electrodes at the top and bottom planes as
| (13) |
3. Results
In this section, we evaluated the performance of the proposed method using saline tank data and patient data. To obtain experimental data, we generated the canonical voltage patterns as the best patterns for the 3D mammography geometry. These patterns were applied to the body, and the ACT4 system measured the full set of applied voltages and the resulting electrode currents simultaneously.
3.1. Electrode contact test
Using the real part of the admittance Y in (13), it is determined if the electrodes are making contact with the breast of the patient or the saline in the test tank.
The 60-electrode test phantom with two 5 × 6 electrode arrays for the 3D mammography geometry is shown in figure 2. It was made of plexiglas and its inner shape was designed to resemble the shape of the compressed human breast. This phantom was filled with a saline solution of the conductivity 100 mS m−1 to a 20 mm depth. This conductivity was chosen less than conductivity of healthy breast tissue to partially account for the low conductivity of the skin.
Figure 2.
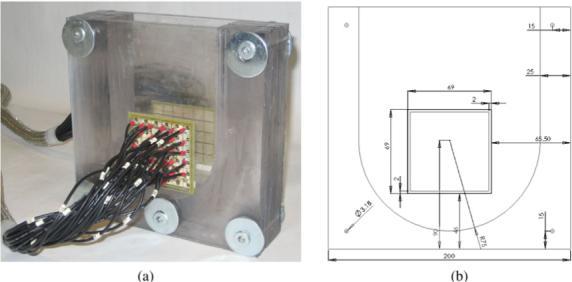
The 60-electrode test phantom for the 3D mammography geometry used in the experiment. (a) 3D test phantom. (b) Front view.
When a uniform voltage is applied across the tank, the current in each electrode depends only on its location. Admittance, which is proportional to current in this case, is nearly constant and relatively low for all interior electrodes. It is higher for all edge electrodes, due to the availability of the saline surrounding the array to carry some current. Admittance is highest at the four corner electrodes, which have the greatest exposure to alternate current pathways. These effects can be seen in figure 3, showing admittance versus electrode number. Since there are five rows of six electrodes each, numbered consecutively, this pattern is reflected in figure 3. There are actually two lines superimposed in this figure 3, since admittances of both the top and bottom arrays are plotted. The ability of this display to identify an uncovered electrode is demonstrated in figure 4, in which two electrodes on one plane have been covered with insulating tape, lowering their admittance to zero. This test of the integrity of the electrode array was also applied to patients' breasts, and an example of a satisfactory test on one patient is shown in figure 5. The same overall pattern is observed, with variations due to the inhomogeneity of the breast.
Figure 3.
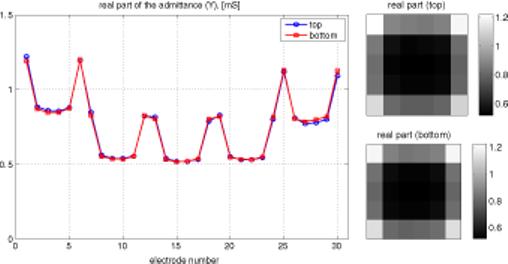
At left, plot of admittance versus electrode number. Electrodes are numbered 1−6 in the first row, 7−12 in the next, etc. At right, gray-scale view of admittance of both arrays.
Figure 4.
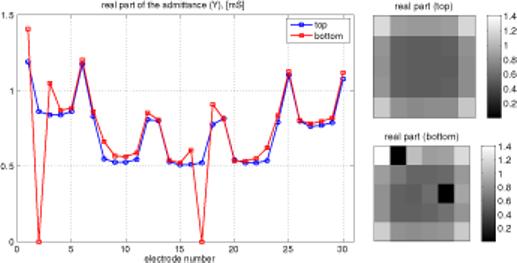
Same information as figure 3, with insulating tape over electrodes 2 and 17 in the bottom array.
Figure 5.
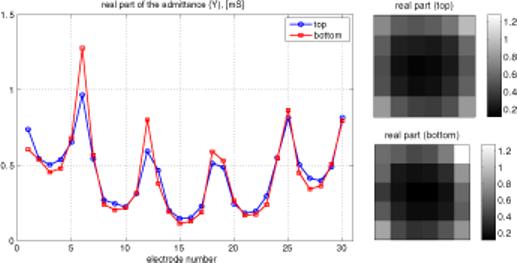
Same information as figure 3, with electrodes in place on a patient's breast.
3.2. Cole–Cole plot
A Cole–Cole plot is a complex graph axis format, that is, a graph of the imaginary part versus the real part of the admittance.
Using the complex admittance Y in (13), a type of Cole–Cole plot is generated and displayed for each of the frequencies (5−300 kHz).
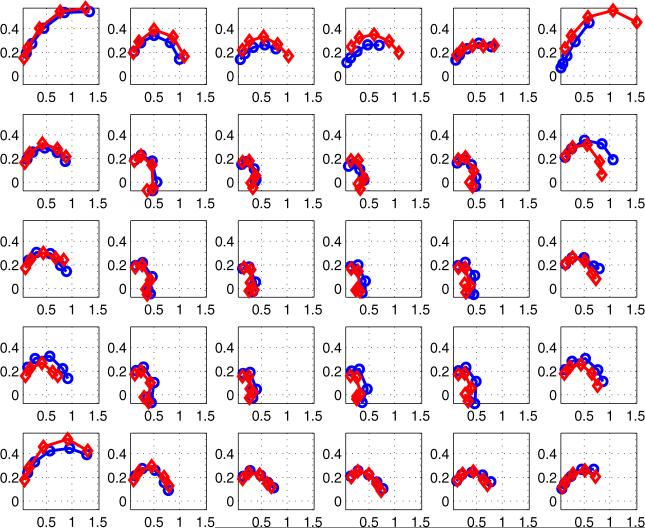
Jossinet and Schmitt (1999) and others have used plots of complex admittance loci to distinguish among different classes of tissue in the breast. Figure 6 is an example, showing the results of a study of freshly-excised breast tissue. The reactive component of admittance is plotted versus its real component. We have extended the data display matrix used at the right side of figures 3–5 to display plots similar to figure 6 for each of 30 electrode locations. In figure 7, there are 30 sub-plots, each of which is a plot of reactive versus real components of admittance between 5 kHz and 300 kHz. All sub-plots are on the same scales. In general, we see that higher magnitudes of admittance occur at the corners and along the edges of the array, with lower values in the center. The curves or admittance loci frequently have the expected semicircular shape expected from tissue media with many dispersions (Grimnes and Martinsen 2000).
Figure 6.
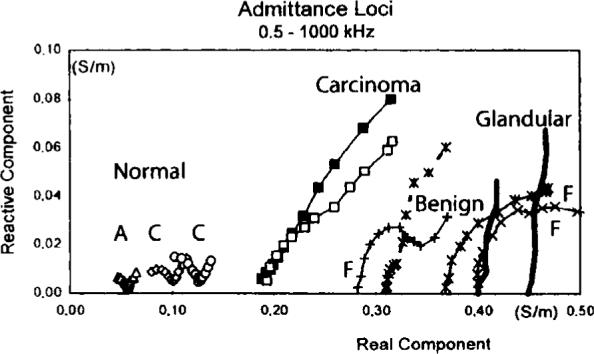
Admittance loci of excised breast tissues provided by Jossinet and Schmitt (1999).
Figure 7.
Admittance locus of the left breast of all 30 pairs of electrodes for a normal breast (top plane: -○-, bottom plane: -◇-).
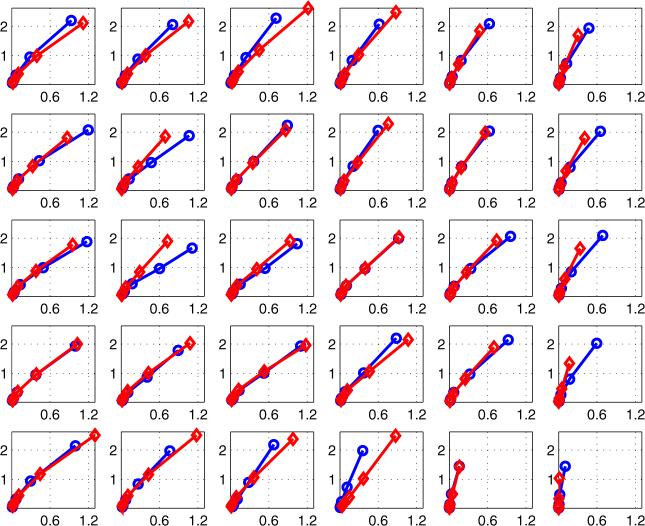
Figure 7 displays the admittance data from a normal breast over the frequency range from 5 to 300 kHz. Figure 8 shows similar data over the same range from a breast with ductal carcinoma. Note that the scales of these two figures are different; the reactive component of the breast with cancer is larger than that of the normal breast. In addition, the shapes of the curves are different, with a semicircular shape for the normal breast curves but a nearly straight line for the breast with carcinoma.
Figure 8.
Admittance locus of the left breast of all 30 pairs of electrodes for a breast with carcinoma (top plane: -○-, bottom plane: -◇-).
4. Conclusions
We have developed an analysis technique to assess regional admittance of breast tissue. It is able to detect electrodes that are not contacting the breast, and it provides a means to assess the complex admittance over a broad range of frequencies, and display this information graphically. Preliminary results show a clear distinction between the complex admittance of a normal breast and a breast with known pathology. We have not yet studied a sufficient number of patients to make general statements about the results, but the method is a useful tool with which to pursue this goal.
Acknowledgments
This work was supported by the National Science Foundation under Grant EEC-9986821 and from the National Institute of Biomedical Imaging and Bioengineering under grant R01-EB000456−02. The authors gratefully acknowledge the help and support of Professor Kyung Youn Kim in conducting this study.
References
- Cherepenin VA, Karpov AY, Korjenevsky AV, Kornienko VN, Kultiasov YS, Ochapkin MB, Trochanova OV, Meister JD. Three-dimensional EIT imaging of breast tissues: system design and clinical testing. IEEE Trans. Med. Imaging. 2002;21:662–7. doi: 10.1109/TMI.2002.800602. [DOI] [PubMed] [Google Scholar]
- Gisser DG, Isaacson D, Newell JC. Electric current computed tomography and eigenvalues. SIAM J. Appl. Math. 1990;50:1623–34. [Google Scholar]
- Grimnes S, Martinsen ØG. Bioimpedance and Bioelectricity Basics. Academic; London: 2000. [Google Scholar]
- Isaacson D. Distinguishability of conductivities by electric current computed tomography. IEEE Trans. Med. Imaging. 1986;5:92–5. doi: 10.1109/TMI.1986.4307752. [DOI] [PubMed] [Google Scholar]
- Jossinet J. The impedivity of freshly excised human breast tissue. Physiol. Meas. 1998;19:61–75. doi: 10.1088/0967-3334/19/1/006. [DOI] [PubMed] [Google Scholar]
- Jossinet J, Schmitt M. A review of parameters for the bioelectrical characterization of breast tissue. Ann. NY Acad. Sci. 1999;873:30–41. doi: 10.1111/j.1749-6632.1999.tb09446.x. [DOI] [PubMed] [Google Scholar]
- Kao T-J, Newell JC, Saulnier GJ, Isaacson D. Radiolucent electrode array for combined EIT and mammography. Proc. 7th Conf. on Biomedical Appl. Electrical Impedance Tomography; COEX, Seoul, Korea. 27 Aug.–1 Sep.2006. pp. 3752–5. [Google Scholar]
- Kerner TE, Paulsen KD, Hartov A, Soho SK, Poplack SP. Electrical impedance spectroscopy of the breast: clinical imaging results in 26 subjects. IEEE Trans. Med. Imaging. 2002;21:638–45. doi: 10.1109/tmi.2002.800606. [DOI] [PubMed] [Google Scholar]
- Liu N, Saulnier GJ, Newell JC, Isaacson D, Kao T-J. ACT4: a high-precision, multi-frequency electrical impedance tomograph. Proc. 6th Conf. on Biomedical Appl. Electrical Impedance Tomography; University College London, London, UK. 22–24 June.2005. [Google Scholar]
- Malich A, Boehm T, Facius M, Freesmeyer MG, Fleck M, Anderson R, Kaiser WA. Differentiation of mammographically suspicious lesions: evaluation of breast ultrasound, MRI mammography and electrical impedance scanning as adjunctive technologies in breast cancer detection. Clin. Radiol. 2001;56:278–83. doi: 10.1053/crad.2000.0621. [DOI] [PubMed] [Google Scholar]
- Morimoto T, Kinouchi Y, Iritani T, Kimura S, Konishi Y, Mitsuyama N, Komaki K, Monden Y. Measurement of the electrical bioimpedance of breast tumors. Eur. Surg. Res. 1990;22:86–92. doi: 10.1159/000129087. [DOI] [PubMed] [Google Scholar]
- Poplack SP, Paulsen KD, Hartov A, Meaney PM, Pogue BW, Tosteson TD, Grove MR, Soho SK, Wells WA. Electromagnetic breast imaging: average tissue property values in women with negative clinical findings. Radiology. 2004;231:571–80. doi: 10.1148/radiol.2312030606. [DOI] [PubMed] [Google Scholar]
- Ross AS. PhD Thesis. Rensselaer Polytechnic Institute, Troy; NY, USA: 2003. An adaptive current tomograph for breast cancer detection. [Google Scholar]
- Saulnier GJ, Ross AS, Liu N. A high-precision voltage source for EIT. Physiol. Meas. 2006;27:221–36. doi: 10.1088/0967-3334/27/5/S19. [DOI] [PMC free article] [PubMed] [Google Scholar]
- Soni NK, Hartov A, Kogel C, Poplack SP, Paulsen KD. Multi-frequency electrical impedance tomography of the breast: new clinical results. Physiol. Meas. 2004;25:301–14. doi: 10.1088/0967-3334/25/1/034. [DOI] [PubMed] [Google Scholar]
- Surowiec AJ, Stuchly SS, Barr JR, Swarup A. Dielectric properties of breast carcinoma and the surrounding tissues. IEEE Trans. Biomed. Eng. 1988;35:257–63. doi: 10.1109/10.1374. [DOI] [PubMed] [Google Scholar]


