Summary
The environment and unique balance of molecular forces within lipid bilayers has a profound impact upon the structure, dynamics and function of membrane proteins. Here, we describe the biophysical foundations for the remarkable uniformity of many transmembrane helices that result from the molecular interactions within lipid bilayers. In fact, the characteristic uniformity of transmembrane helices leads to unique spectroscopic opportunities allowing for ϕ,ψ torsion angles to be mapped directly onto solid state NMR PISEMA spectra. Results from spectral simulations, the solid state NMR derived structure of the influenza A M2 proton channel transmembrane domain, and high resolution crystal structures of 27 integral membrane proteins demonstrate that transmembrane helices tend to be more uniform than previously thought. The results are discussed through the definition of a preferred range of backbone ϕ,ψ torsion angles for transmembrane α-helices and are presented with respect to improving biophysical characterizations of integral membrane proteins.
Keywords: NMR, Membrane Proteins, PISEMA, Oriented Lipid Bilayer, Protein Structure, Transmembrane Helices
Introduction
The α-helix was first proposed by Pauling as a potential protein structural element based upon stereochemical principles, peptide planarity and hydrogen bonding patterns (Pauling and Corey, 1950; Pauling and Corey, 1951; Pauling, et al., 1951). Since the debut of these seminal papers the geometry, amino acid composition and hydrogen bonding characteristics of α-helices from water soluble globular proteins have been discussed in detail (Baker and Hubbard, 1984; Jeffrey and Saenger, 1991; Shanahan and Thornton, 2005). Unfortunately the characterization of transmembrane α-helices from integral membrane proteins has lagged behind due to the inherent challenge of structurally characterizing this class of proteins. The balance of the molecular interactions that stabilizes proteins in membrane environments in comparison to bulk water has a dramatic effect upon the structure and uniformity of helices within the membrane environment (Cramer, et al., 1992; Kim and Cross, 2002; Spencer and Rees, 2002). Here, we describe the biophysical foundations for the uniformity of transmembrane α-helices through an analysis of high resolution integral membrane protein crystal structures and solid state NMR spectroscopy.
The organization of lipid bilayers has important consequences for protein dynamics and chemistry. The interior of lipid membranes are essentially devoid of water, resulting in a steep water concentration gradient from bulk water outside the membrane through the polar interfacial region into the apolar hydrocarbon core. Significant gradients also exist across the membrane for lipid dynamics (Seelig and Seelig, 1974; Brown, et al., 1979; Marrink and Berkowitz, 1994), lateral pressure (White and Wiener, 1994; Cantor, 1999) and dielectric constant (White and Wiener, 1994). These gradients have profound influences upon the structure and uniformity of transmembrane α-helices. In fact, the predominantly hydrophobic amino acid composition for residues exposed to the bilayer hydrocarbon core and biased segregation of charged and polar residues towards the termini of transmembrane helices (Nilsson, et al., 2005) reflects the importance of the dielectric constant gradient within lipid bilayers. Water is a catalyst for hydrogen bond rearrangements (Xu and Cross, 1999) and the absence of water from the membrane hydrocarbon core dictates that hydrogen bond rearrangements within the membrane are infrequent. The absence of water and low dielectric of the hydrocarbon core result in significant energetic penalties for disruptions and distortions in the helical structure that result in lengthening or even breaking of hydrogen bonds that expose carbonyl groups to the low dielectric environment (White and Wimley, 1999; Popot and Engelman, 2000).
The hydrocarbon core of membrane bilayers is quite similar to the in vacuo environments used for early simulations of α-helices (Donohue, 1953); a low dielectric environment devoid of water. It is not surprising then that the transmembrane α-helical backbone torsion angles from the in vacuo calculations are similar to the ‘ideal’ values of φ = -60° and ψ = -45° (Wang, et al., 2001; Kim and Cross, 2002), the mean torsion angles observed for residues within α-helices exposed to hydrophobic environments (Blundell, et al., 1983). These values differ slightly from the mean values for α-helices observed in water soluble proteins of φ = -64.7° and ψ = -39.8° (Smith, et al., 1996). While this is only a 5° difference it has a significant impact upon the electrostatic surface of the helix. The exposure of helix backbone charges, particularly from the carbonyl oxygens, to the surrounding environment is, in part, a function of the orientation of the charged groups. This orientation can be characterized by the peptide plane tilt angle (δ). Globular water soluble α-helices exhibit a peptide plane tilt angle of 11.9°, based on the backbone torsion angles for this class of proteins (Smith, et al., 1996), compared to a value of 8.2° for transmembrane α-helices (Fig. 1 A, B and C) resulting in decreased exposure of the carbonyl partial charges to the surrounding environment for the transmembrane α-helices. The difference in exposure of carbonyl oxygens is a consequence of the dielectric constant, water concentration and amino acid composition. The high dielectric of bulk water shields the charge on the carbonyl atom and the prevalence of water allows for additional hydrogen bonding opportunities. In contrast, the low dielectric within the membrane hydrocarbon core provides very poor shielding of the carbonyl oxygen charge and the absence of water and hydrophilic residues from this region dramatically lowers the potential for secondary hydrogen bonding.
FIGURE 1. Peptide Plane Tilt Angles and the Ramachandran-δ Diagram.
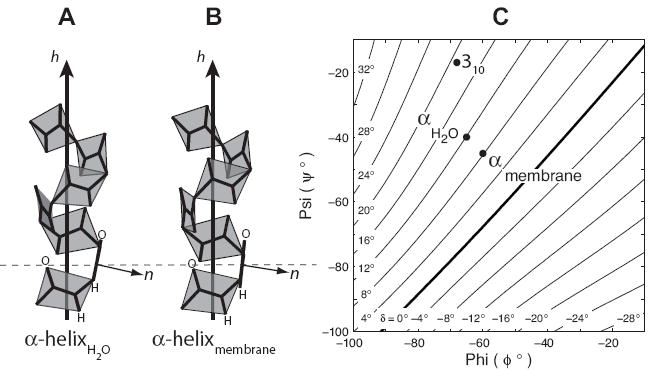
The peptide plane tilt angle (δ), defined as the angle between the peptide plane normal n and the helix axis hZ minus 90°, is sensitive to variations in φ,ψ backbone torsion angles. Mean values for globular α-helical torsion angles (A) of φ = -65° and ψ = -40° result in δ = 11.9°. An ‘ideal’ transmembrane α-helix (B) with φ = -60° and ψ = -45° results in δ = 8.2°. The decreased value of δ translates structurally to carbonyl oxygens in transmembrane α-helices that are less exposed to the surrounding environment in comparison to globular protein α-helices. The sensitivity of δ to φ,ψ torsion angles is illustrated by mapping peptide plane tilt angles from helices with uniform torsion angles onto backbone torsion angle plots to yield the Ramachandran-δ diagram (C).
In water soluble proteins, helical carbonyl oxygens commonly accept a second hydrogen bond either from a side-chain or from water (Baker and Hubbard, 1984). Helical distortions can thereby be the result of amino acid composition (Barlow and Thornton, 1988) or distortions in peptide bond geometries (Chakrabarti, et al., 1986) and are very commonly solvent-induced (Blundell, et al., 1983). Transmembrane α-helices in comparison are coerced by the surrounding environment to be less susceptible to these distortions. In fact, the energetic penalty for distorting hydrogen bond geometry provides a strong barrier to distortions in transmembrane α-helical structure. This concept is reinforced by the common presence of proline and glycine in the middle of transmembrane α-helices frequently resulting in little helical distortion. While typically thought of as “helix breakers” for globular proteins, these amino acids can be thought of as “pro-kink” sites that may allow for, but do not necessarily cause kinks, bends or even significant distortions in the transmembrane helical structure.
The uniformity of transmembrane helices is evident from solid state NMR studies of integral membrane proteins and transmembrane peptides. High resolution characterizations of transmembrane α-helical structure utilizing the PISEMA pulse sequence (Wu, et al., 1994) correlate anisotropic 15N chemical shifts and 15N-1H dipolar couplings (Fig. 2 A) from the polypeptide backbone (Ramamoorthy, et al., 2004). These experiments provide an exquisitely sensitive probe for transmembrane α-helical structure in oriented liquid crystalline lipid bilayer preparations and can determine the orientation of amide bond vectors to within 1° (Quine, et al., 2006). High resolution studies of membrane proteins utilizing PISEMA spectra have revealed patterns of resonances known as Polarity Index Slant Angle (PISA) wheels (Marassi and Opella, 2000; Wang, et al., 2000). These patterns represent an image of a helical wheel with 3.6 resonances per turn reflecting the 3.6 residues per turn in an α-helix. The size, shape and position of the PISA wheel in the PISEMA spectrum, as shown in Fig. 2 B, independently reflect the tilt of the helix axis with respect to the magnetic field. For the samples discussed herein, the bilayer normal is positioned parallel to the magnetic field and thus the PISA wheels reflect the tilt of the helix axis with respect to the bilayer normal. It is possible that PISA wheels may be blurred or even eliminated due to increased resonance dispersion caused by a number of factors including variations in chemical shift and dipolar tensors, or variations in backbone torsion angles. While chemical shift tensors for glycine residues are significantly different from other residues, the variation among non-glycine residues is relatively small (Poon, et al., 2004). Variations in the relative orientations of the 15N chemical shift tensor and 15N-1H dipolar interaction may also occur (Wang, et al., 2000; Wang, et al., 2001; Li, et al., 2007) however these variations are also small. For example, the angle between the 15N chemical shift tensor and the 15N-1H dipolar interaction has been shown by ab initio calculations to vary by only 2° (Brender, et al., 2001) and experiments have observed even smaller variations for a membrane bound peptide (Mai, et al., 1993). Despite these possible perturbations on the resonance frequencies, PISA wheels have been observed for a number of transmembrane proteins and peptides (Park, et al., 2003; Traaseth, et al., 2006; Dürr, et al., 2007; Li, et al., 2007; Page, et al., 2007). Using solid state NMR data and spectral simulations, combined with an analysis of 27 integral membrane protein crystal structures we demonstrate here that transmembrane α-helices can be, as a result of the lipid bilayer environment, highly uniform structures.
FIGURE 2. PISA Wheels in 15N-1H PISEMA Spectra.
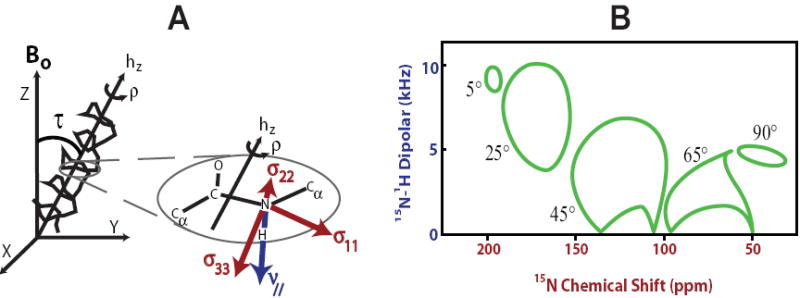
The PISEMA pulse sequence correlates the amide 15N-1H dipolar coupling (ν⫽, blue) with the anisotropic 15N chemical shift tensor (σ11, σ 22, σ33, red). The orientation of each amide bond can be determined with respect to the magnetic field vector, B0. Transformation of the principal axis frame for each peptide plane to the helix axis frame allows for the tilt (τ) and rotation (ρ) of the helix to be calculated with respect to B0 (A). For oriented bilayer samples of membrane proteins and peptides, in which the lipid bilayer normal is aligned parallel to B0, the orientation of each amide bond vector and therefore the tilt and rotation of the helix axis can be determined with respect to the lipid bilayer. For helices in these structures, characteristic Polarity Index Slant Angle (PISA) wheel patterns emerge from PISEMA spectra (B) in that the 15N resonances from the peptide backbone are distributed on the surface of these wheels. These patterns allow for immediate identification of the tilt of the helix axis with respect to the membrane bilayer.
Results
Uniformity of Transmembrane α-Helices
X-ray crystallography has provided the majority of structures for transmembrane α-helical proteins to date. While structures calculated from crystallographic data are typically displayed as the single lowest energy structure, the inherent ambiguity of fitting the protein to the electron density map allows for a family of multiple structures to be fit (Levin, et al., 2007). The dispersion in this family is correlated with the resolution of the experimental data. Higher resolution electron density maps restrict the range of possible structures that can be fit, more narrowly defining the family. As demonstrated in Fig. 3 A the root mean square (rms) variation of φ,ψ torsion angles for residues in transmembrane helices of 27 proteins decreases as the structural resolution improves. Remarkably the rms variation in torsion angles approaches 5° for the 1.5 Å resolution structures. This trend is also apparent in the examination of four Bacteriorhodopsin structures (1C3W, 1QHJ, 1AP9 and 1BM1) with resolutions ranging from 1.55 to 3.5Å (Fig. 3 B). The Ramachandran-δ plot in Fig. 3 B illustrates that for this series of structures the rms variation decreases as the resolution improves. Additionally, peptide plane tilt angles less than 0° are avoided in the high resolution structures. It is apparent from Fig. 3 B that the torsion angle distribution is asymmetric (i.e. elliptical) being relatively narrow along the δ lines and broader orthogonal to these lines. Furthermore, there is a relatively sharp cut off around a peptide plane tilt angle of 4° and a distinct distribution tail to high δ values.
FIGURE 3. Transmembrane Helix φ,ψ Torsion Angle Variations in Crystal Structures.
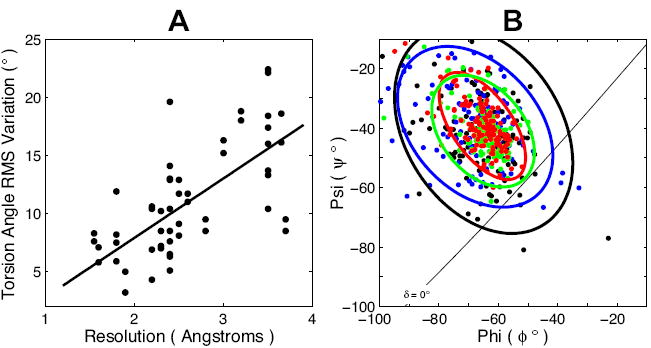
The scatter in observed φ,ψ backbone torsion angles for residues in transmembrane helices is, in part, a function of structural resolution. The rms variation decreases as the resolution of the structures improve. A plot of the rms variations for φ,ψ angles within transmembrane helices of 27 integral membrane protein crystal structures solved at resolutions ranging from 1.55 to 3.7Å illustrates the decrease in variance as structural resolution improves (A). A line of best fit through the data highlights this trend (A). A Ramachandran-δ diagram (B) demonstrates the decrease in variance of φ,ψ as resolution improves with four structures of Bacteriorhodopsin solved at 1.55Å (1C3W, red), 1.9Å (1QHJ, green), 2.35Å (1AP9, blue) and 3.5Å (1BM1, black). For each structure an ellipse encircling 90% of the data is shown.
Fig. 4 illustrates the influence of random variations in ϕ and ψ torsion angles on the calculated PISA wheels (Nevzorov and Opella, 2003; Page, et al., 2007), the resonance patterns observed in solid state NMR PISEMA spectra. Simulated PISEMA spectra are based on an 18 residue transmembrane helix (ϕ = -60°, ψ = -45°) tilted at 30° with respect to the bilayer normal and B0, the axis of the magnetic field of the NMR spectrometer (Fig. 4 A). Further simulations vary the ϕ,ψ torsion angles randomly and independently for each residue within ± 4, 8 or 16° of the ideal values (Fig. 4 B, C and D). While the PISA wheel pattern is clearly observable for cases where the variation in backbone torsion angles is less than 8°, the pattern essentially disappears when the torsion angles have a variation of ± 8° or greater (Fig. 4 C and D). Interestingly, PISA wheels have been observed in solid state NMR spectra for a number of integral membrane proteins and peptides including influenza A M2 proton channel (Wang, et al., 2001), phospholamban (Traaseth, et al., 2006), acetylcholine receptor M2 (Opella, et al., 1999), fd filamentous phage major coat protein (Marassi and Opella, 2003), HIV-1 virus protein “u” (Park, et al., 2003), sarcolipin (Buffy, et al., 2006), cytochrome b5 (Dürr, et al., 2007) and several other proteins and peptides (Li, et al., 2007; Ramamoorthy, et al., 2007). The repeated observation of PISA wheels throughout this literature (some of which are shown in Fig. 5) suggests that if the dispersion in the chemical shift and dipolar dimensions is dominated by variations in ϕ,ψ torsion angles, then the variation in ϕ,ψ torsion angles may be as large as ± 4° for peptides and ± 6° for proteins (Page, et al., 2007). Since we know that chemical shift tensor variations can be significant, the observed structural variations represent a maximum value and the actual variation is likely to be less than ±4° or ±6°. Such a small variation means that the PISA wheels observed in the literature indicate that transmembrane α-helices are often remarkably uniform structures.
FIGURE 4. Perturbation of PISA Wheels Through φ,ψ Torsion Angle Variations.
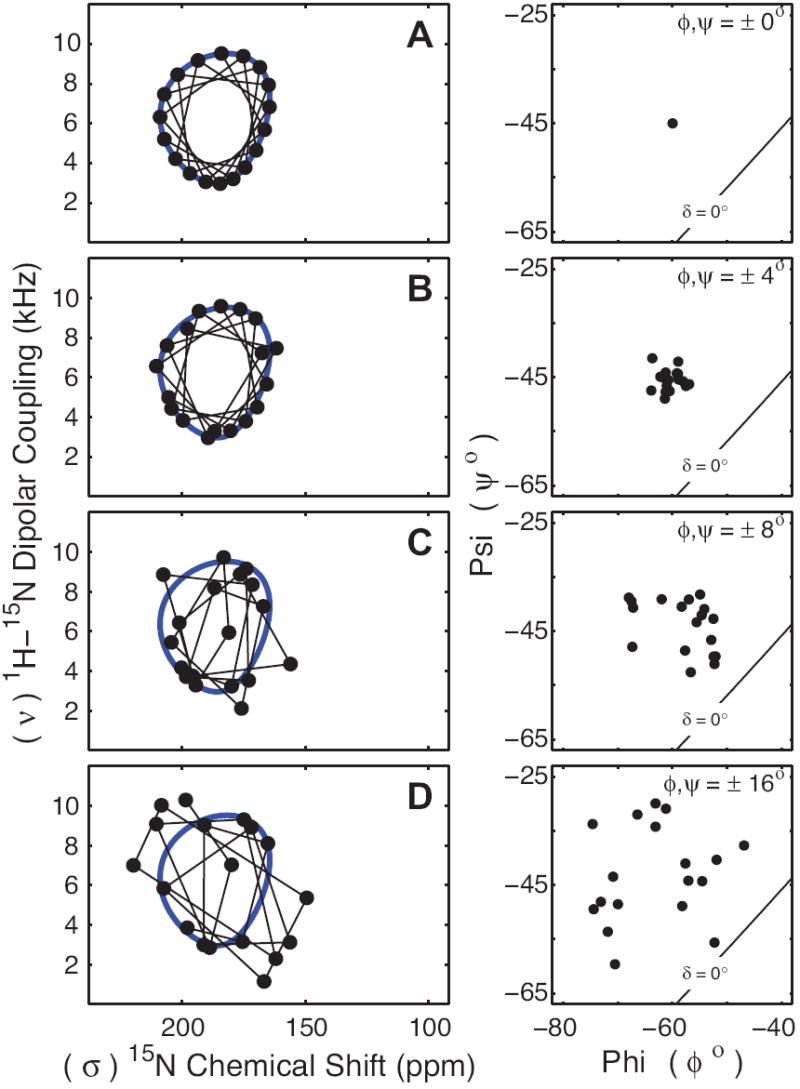
PISEMA spectra for an 18 residue α-helix tilted at 30° with respect to B0 were simulated with increasing variation in ϕ,ψ torsion angles. Backbone ϕ,ψ torsion angles were varied randomly and independently for each residue to within ± 4° (B), ± 8° (C) or ± 16° (D) from the values of ϕ = -60°, ψ = -45° (A). For each simulated PISEMA spectrum a Ramachandran-δ diagram is shown. PISA wheel patterns (blue line) are clearly evident for simulations with 0° or ± 4° variation in ϕ,ψ torsion angles as shown through the sequential trace of resonances (thin black line), however these patterns become blurred and disappear for variations of ± 8° and greater.
FIGURE 5. 15N-1H PISEMA Spectra of Transmembrane Peptides.
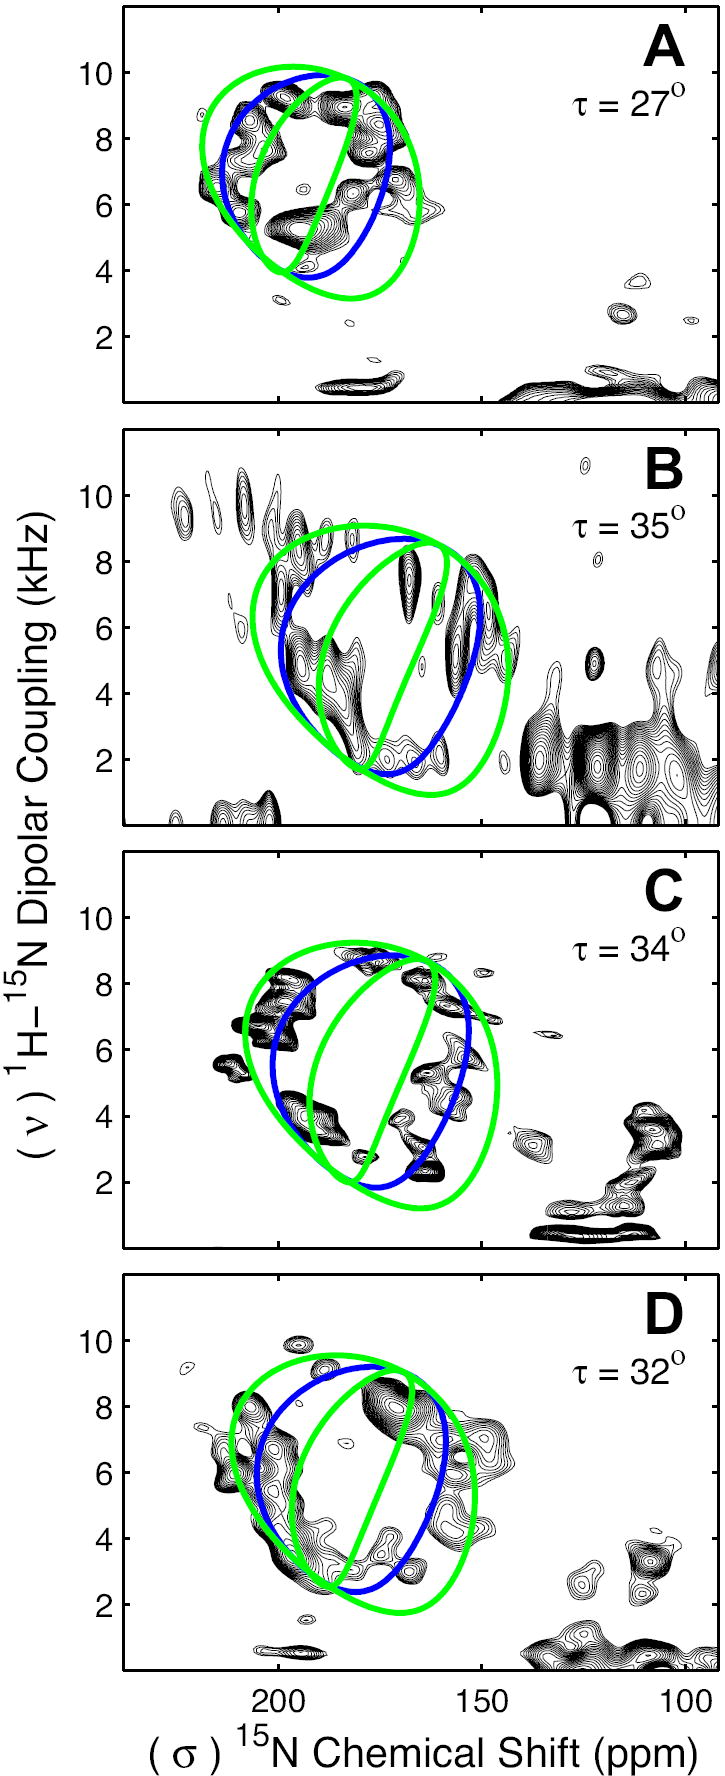
PISEMA spectra of the transmembrane α-helical peptides CorA-TM2 (A), KdpC-TM (B), KdpF (C) and M2-TMD (D) are characterized with PISA wheels for ideal transmembrane α-helices (blue line) corresponding to helical tilts of 27°, 35°, 34° and 32° respectively. The resonances within the transmembrane helices of each peptide can be roughly bounded by PISA wheels corresponding to peptide plane tilt angles (δ) of 4° and 12° (a difference of approximately ±4° from the peptide plane tilt angle for an ideal transmembrane α-helix).
Effects of Transmembrane Helix Dynamics Upon PISA Wheels
It is important for structural characterizations to interpret PISEMA spectra in light of motionally averaged spin interaction tensors. We have previously shown that the tensors characterized from lyophilized samples of peptides reflect a motionally averaged state compared to flash-frozen bilayer preparations characterized at 140K or below and that the tensors obtained from lyophilized samples are appropriately averaged for the interpretation of PISEMA spectra (Wang, et al., 2000; Wang, et al., 2001; Li, et al., 2007). To illustrate that large amplitude motions are not present at a frequency that is high enough to average the observables, spectral simulations are shown in Fig. 6 for three models illustrating fast motions.
FIGURE 6. PISA Wheel Perturbations Due to Dynamics.
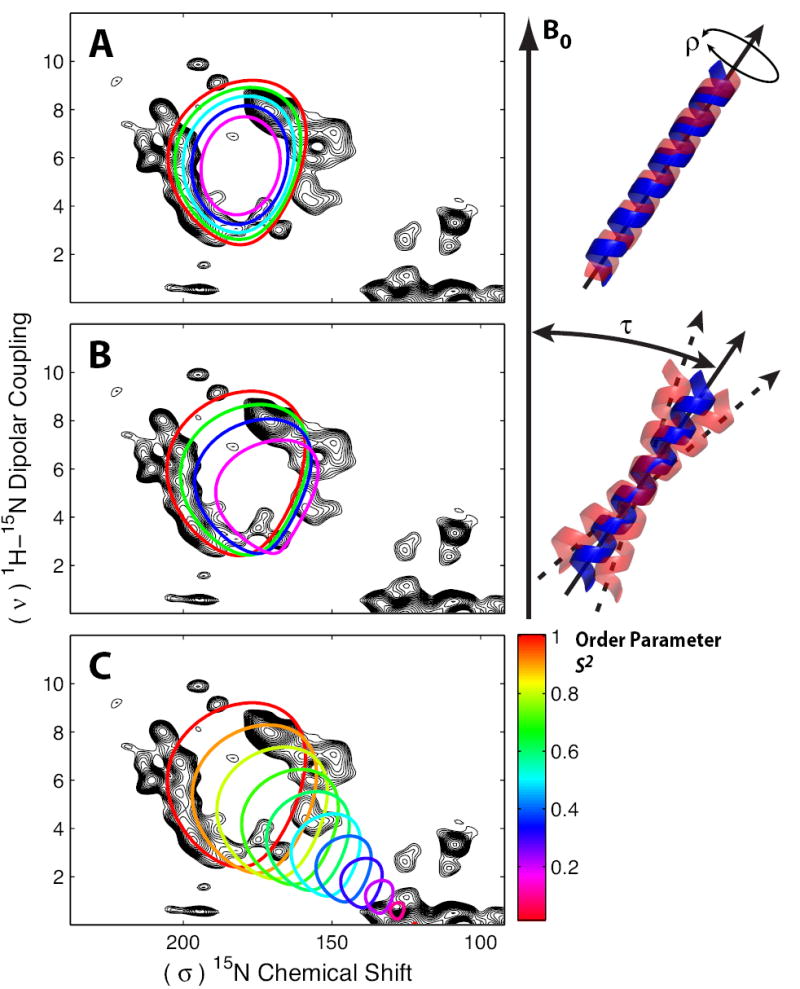
PISA wheels overlaid onto the PISEMA spectra of M2-TMD (black) were simulated with varied dynamic motions. Wheels for a helix undergoing fast rotation (ρ) about the helix axis of ± 0° (red), ±20° (green), ±30° (cyan), ±40° (blue) and ±50° (magenta) illustrate the collapse of the wheel (A). Wheels for a wobbling helix experiencing changes in helix axis tilt (τ) with respect to B0 of ± 0° (red), ±10° (green), ±15° (blue) and ±20° (magenta) illustrate a shift in position and decrease in size of the wheel (B). Variations in helix tilt and rotation are Gaussian distributions with width at half-height values of ± x°. Helices with increased motion characterized by the generalized order parameter S2 give rise to PISA wheels that collapse and shift towards isotropic values for the chemical shift and dipolar coupling (C).
A helix undergoing fast rotational oscillations of limited amplitude about the helix axis (Fig. 6 A) results in uniform collapse of the PISA wheel. It is important to recognize that the only variable used to simulate the PISA wheels is the tilt angle of the helix. Virtually the same tensors and the same relative orientation of the tensors have been used in all of the publications and for the simulations of 10 different proteins and peptides from our lab. If present in observed spectra these smaller wheels would immediately indicate the presence of such motions. Based on hydrogen/deuterium exchange experiments (Tian, et al., 2003) and cross linking studies in many labs (Hughson, et al., 1997) we expect this sort of motion to occur on a ms to ks timescale, but not on the μs or sub-μs timescale necessary for scaling the spin interaction tensors. A second motion characterized as a wobbling of the helix axis of variable amplitude with respect to the bilayer (Fig. 6 B) causes both a reduction in size and a shift in the center of the wheel. A third motional mode is in the form of a generalized order parameter motion ranging from 0 (isotropic) to 1 (tensor values used throughout this manuscript and previous publications; Fig. 6 C). Again, if large amplitude motions were present they would be easily recognized from the spectra. On the other hand, relatively small amplitude versions of these motions (e.g. ±20° rotation about the helix axis; ±5° wobbling of the helix axis; or an order parameter of 0.95) would not easily be recognized in the PISEMA spectra and may therefore be present. Indeed, evidence of low frequency motions have also been observed in the broad linewidths that appear to be the result of both efficient relaxation and some heterogeneous broadening (Li, et al., 2007). It should also be noted that for the interpretation of PISEMA spectra for bicelle preparations an order parameter of approximately 0.8 is used to account for the additional dynamics in the bicelles (Sanders, et al., 1994; DeAngelis, et al., 2006).
Biophysical Foundations of Transmembrane Helix Uniformity
The uniformity observed for many transmembrane α-helices takes root from the α-helical hydrogen bond geometry and the energetic cost in distorting this geometry from an energetic minimum in a low dielectric and anhydrous environment. Extensive analyses of hydrogen bond distances and angles from globular proteins (Blundell, et al., 1983; Baker and Hubbard, 1984; Barlow and Thornton, 1988; Jeffrey and Saenger, 1991) provide insights into the energetic landscape for these bonds that define the α-helical geometry. However, in globular protein α-helices, backbone i to i+4 hydrogen bonding and backbone torsion angles are distorted by secondary hydrogen bonding to a substantial fraction of the backbone carbonyls (~30%) (Baker and Hubbard, 1984). These secondary interactions contributed from water and hydrophilic side-chains serve to significantly distort the helical backbone structure, typically increasing the tilt angle of the peptide plane. These secondary hydrogen bonds are virtually absent in the membrane environment due to the lack of a protic solvent and the scarcity of hydrophilic amino acids resulting in increased helical uniformity and decreased peptide plane tilt angles for transmembrane α-helices. Even those secondary hydrogen bonds that do occur, for example Cα-H•••O bonds at helix-helix interfaces, only distort the helical structure slightly (Senes, et al., 2001).
Details of the hydrogen bonding geometry in the form of the O•••H distance, N-H•••O and C=O•••N angles provide additional insights. High resolution crystallographic results for transmembrane α-helices show O•••H distances of 2.0 ± 0.2 Å, N-H•••O angles greater than 140° and C=O•••N angles between 140° and 160° (Kim and Cross, 2002). For C=O•••N angles near 120° covalent contributions to the hydrogen bond are high while for angles near 160° the electrostatic contributions are enhanced (Stickle, et al., 1992; Fabiola, et al., 2002). For transmembrane α-helices the low dielectric environment is expected to enhance the electrostatic contribution. These hydrogen bond distance and angle ranges were also observed in the backbone structure for the transmembrane helix of the M2 proton channel (M2-TMD), which was refined against solid state NMR data and the CHARMM empirical force field while incrementing the target hydrogen bond O•••H and N•••O distances (Kim and Cross, 2002). Despite varying the weighting factor for balancing experimental data versus the force field by an order of magnitude a consistent minimum in the penalty function was found at an O•••H distance of 2.00 Å and an N•••O distance of 2.97 Å (Kim and Cross, 2002). In addition, the N-H•••O angle had a tight range between 155° and 175°.
Hydrogen bond geometry is highly sensitive to the backbone ϕ,ψ torsion angles as illustrated in Fig. 7 through bond angle contours overlaid onto Ramachandran-δ diagrams. There are many significant features within these plots. Almost all of the torsional space below a line orthogonal to the δ = 0° crossing through -60°,-70° (φ,ψ) is inconsistent with α-helical hydrogen bonding geometry. This sharp cutoff is consistent with the φ,ψ torsion angle distributions seen in Fig. 3 B. Likewise the hydrogen bond geometry parameters clearly stretch out along lines orthogonal to δ = 0° as do the previously mentioned φ,ψ torsion angle distributions. By choosing reasonable parameters for the hydrogen bonding geometry based upon these observations we can define a preferred region of φ,ψ torsion angle space for transmembrane α-helices (Fig. 7 C). This region is defined as the area bounded by O•••H distances within a range of 2.0 to 2.4 Å, N-H•••O angles greater than 140° and C=O•••N angles less than 160°. These numbers, while reasonable, could be modified with only a modest impact on the φ,ψ torsion angle space defined by the parameters. Note that this space is entirely within the δ > 0° region of the Ramachandran-δ diagram, consistent with a uniform α-helical structure since van der Waals and electrostatic interactions prevent the carbonyl oxygen from pointing inwards toward the helix axis. The preference for positive peptide plane tilt angles for α-helices is consistent with that seen for 310 helices where the i to i+3 hydrogen bonding pattern results in peptide plane tilt angles near 20° (Barlow and Thornton, 1988). This preference is in contrast to π-helices for which the i to i+5 hydrogen bonding pattern results in significantly increased space within the core of the helix allowing for slightly negative peptide plane tilt angles (Low and Baybutt, 1952; Low and Greenville-Wells, 1953).
FIGURE 7. α-Helical Hydrogen Bond Geometry.
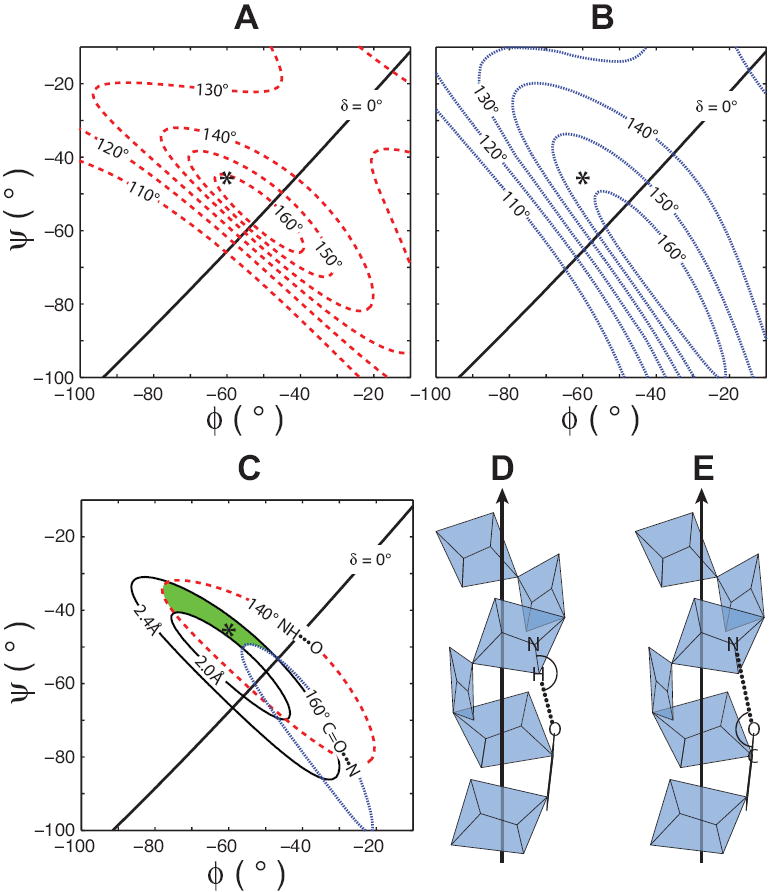
Hydrogen bond distances and geometries for uniform α-helical structures (i to i+4 hydrogen bonding pattern) vary with backbone ϕ,ψ torsion angles. Hydrogen bond angle contour plots for the N-H•••O and C=O•••N angles (A and B respectively) are highly sensitive to changes in ϕ and ψ. Ideal ϕ,ψ coordinates for transmembrane α-helices (asterisk) are shown for each Ramachandran-δ diagram. We have defined a preferred α-helical region (shaded) for membrane proteins on the Ramachandran-δ diagram as the area bounded by < 160° C=O•••N, > 140° N-H•••O hydrogen bond angle contours and the 2.0 Å and 2.4 Å hydrogen bond distance contours (C). Model α-helices illustrate the definitions of N-H•••O (D) and C=O•••N (E) hydrogen bond angles.
Spectral Mapping of Torsion Angles
While PISA wheel patterns emerging from groups of resonances within PISEMA spectra of integral membrane proteins provide valuable information on helix tilt and rotation, the locations of individual resonances provide even more information. Utilizing the preferred α-helical region of φ,ψ space defined in Fig. 7 C and Fig. 8 A we have characterized the corresponding spectral space (Fig. 8 B) for some of the residues of the transmembrane peptide of the influenza A M2 proton channel (M2-TMD). The analysis performed herein allows for a comparison of simulated spectra to a set of assigned experimental spectra (Wang, et al., 2001). These simulations provide the first direct examination of a range of torsion angle space mapped into spectral space.
FIGURE 8. Spectral Mapping of ϕ,ψ Torsion Angles.
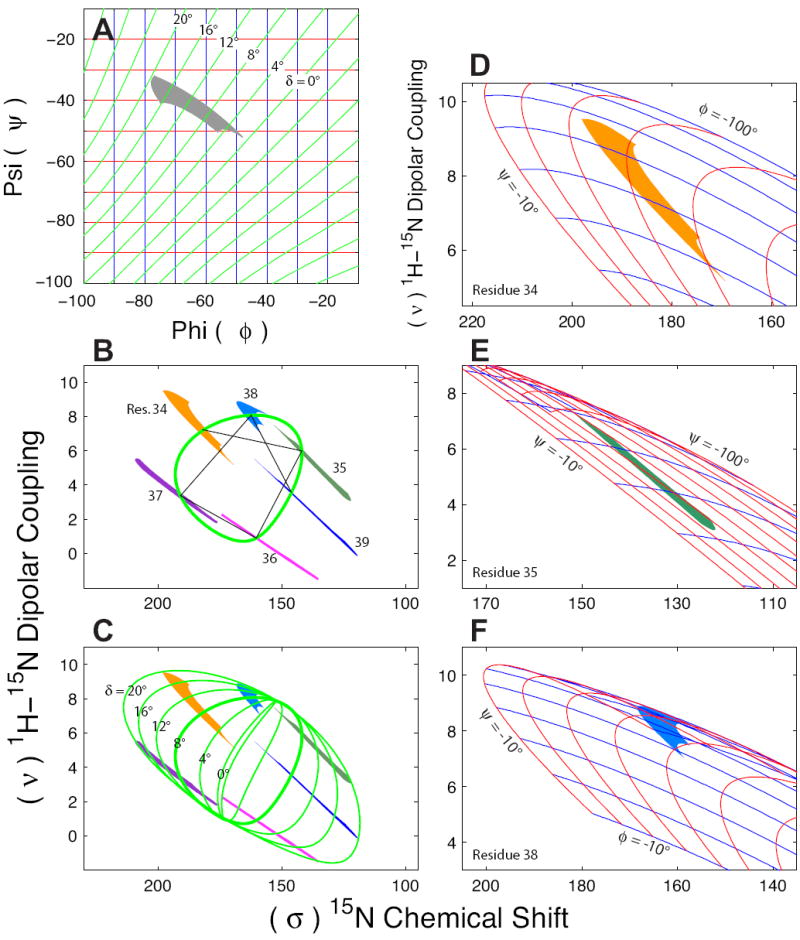
The hydrogen bond geometry restrained torsion angle region for transmembrane α-helices in,ϕ,ψ torsion angle space is illustrated with a Ramachandran-δ diagram (A) as in Fig. 7 C. Throughout this figure the δ contours are in green and the ϕ,ψ contours are in blue and red, respectively. The restrained torsion angle region was used to create the mapped frequency range for residues 34-39 of M2-TMD (Wang, et al., 2001) that are overlaid onto a PISA wheel (green line, δ = 8°) with a helical tilt of 38° and lines demonstrating the sequential connectivity of resonances (black line) (B). The δ-contours from ϕ,ψ torsion angle space are mapped to the PISEMA spectra as PISA wheels (C) (green lines). Just as the restrained region of torsional space is contained between the δ = 0° and δ = 20° contours in the Ramachandran-δ diagram (A), the PISEMA spectral space is contained within the δ = 0° and δ = 20° PISA wheels (C). PISEMA spectral space with overlaid ϕ,ψ torsion angle grids are shown for residues 34 (D), 35 (E) and 38 (F) as examples. These three resonances demonstrate the compression of torsion angle grids along both ϕ and ψ as well as twisting and folding of torsional contours in the PISEMA spectral space.
There are several striking features in these torsion angle maps. The shape and even proportions of the shape in φ,ψ space are remarkably reproduced in the PISEMA spectrum for residue 34. However, for different sites around the PISA wheel the proportions are stretched or compressed along various dimensions. Furthermore, the pattern rotates around the PISA wheel such that the tail (the portion stretching down towards δ = 0° in the Ramachandran-δ diagram) always points towards the center of the wheel. In fact, as shown in Fig. 8 C the δ contours can be mapped as a set of PISA wheels consistent with the range of various patterns for the individual resonances. In other words, all of the “tails” are consistent with the δ = 0° contour while the “heads” of the patterns are consistent with the δ = 20° contour in both the Ramachandran-δ diagram and in the PISA wheels in the PISEMA spectra.
The 15N-1H dipolar and anisotropic 15N chemical shift interactions observed in PISEMA spectra have a P2cosθ angular dependence with respect to the magnetic field. Such dependence results in a relatively linear transform between structure and frequency in certain regions of spectral space and non-linear transforms in others. This is exemplified by the mapping of φ,ψ torsion angle grids directly onto the spectral space in Fig. 8 D-F where it is seen that φ,ψ torsion angle grid lines vary dramatically in spacing dependent on the orientation of the specific peptide plane with respect to the magnetic field. In addition, Fig. 8 E,F show that torsion angle grids can be twisted and folded in spectral space.
Clearly the mapped spectral space defined by our preferred transmembrane α-helical φ,ψ region (Fig. 7 C) represents a space that is much greater than that observed when PISA wheels are recognized in PISEMA spectra, such as those shown in Fig. 5. In fact, the experimental data fall in a region between the δ = 4° and δ = 12° lines and therefore we propose these as additional geometric constraints for an optimized transmembrane α-helical φ,ψ region as shown in Fig. 9. This restriction brings the region more in line with the previous suggestion that the observation of PISA wheels suggests helical uniformity characterized by φ,ψ torsion angles with a range of ±4° to ±6° (Page, et al., 2007). The limitation of δ to ≤ 12° is approximately equivalent to using an N-H•••O angle of 155° as the minimum allowed angle as opposed to the value of 140° initially used in Fig. 7 C. Interestingly this is the minimum observed N-H•••O angle in the refinement of the M2-TMD structure as noted earlier (Kim and Cross, 2002).
FIGURE 9. Optimized φ,ψ Region for Transmembrane Helices.
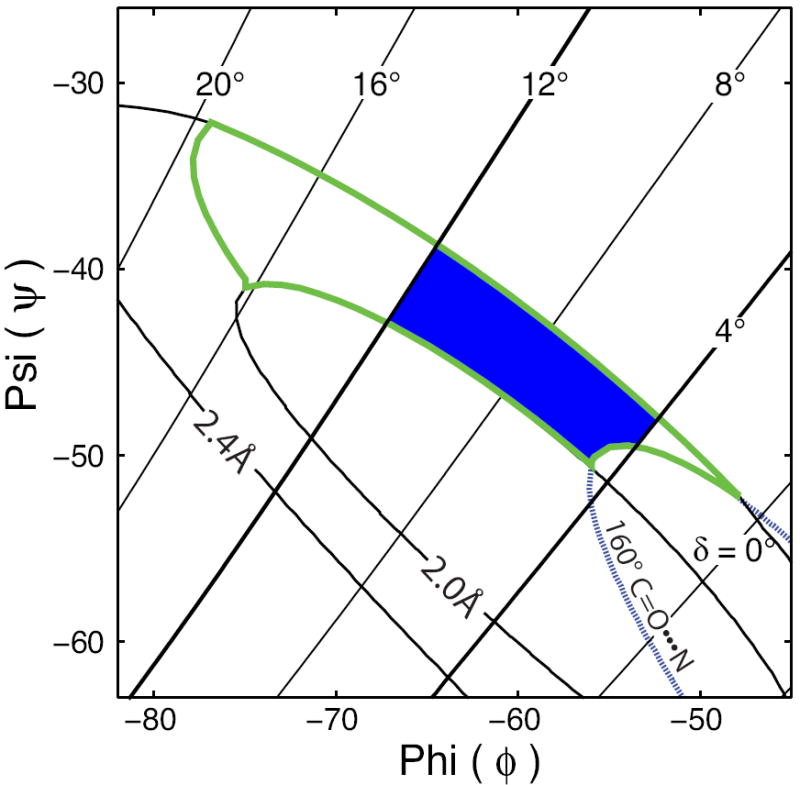
The hydrogen bond geometry restricted φ,ψ region from Fig. 7 C (outlined in green) can be further restricted by limiting the region to the area between peptide plane tilt angles (δ) of 4° and 12° resulting in the shaded region illustrated on this Ramachandran-δ diagram. The optimized φ,ψ region is then defined as the area bounded by < 160° C=O•••N hydrogen bond angle contour, 12° > δ > 4°, and the 2.0 Å and 2.4 Å hydrogen bond distance contours.
Torsion angle maps may also aid in the process of resonance assignments. Since there is aproximately a 100° rotation about the wheel between the i and i+1 resonances, one can restrict the identification of the i+1 resonance to a relatively small subset of resonances that falls into a particular angular segment of the PISA wheel (Fig. 10). The optimization of assignments (i.e. minimizing the RMS deviation on the 100° rotation between consecutive residues) has been achieved using several approaches (Wang, et al., 2000; Nevzorov and Opella, 2003; Asbury, et al., 2006). However, this study clearly shows that the angular range for each torsion angle map about the PISA wheel, induced by variation in φ,ψ torsion angles, is highly dependent upon the location about the wheel. In Fig. 10 the torsion angle maps and data points for residues 34 to 39 of M2-TMD are overlaid onto the rotational coordinates for a PISA wheel. Although local structure is only one mechanism by which the resonances are dispersed, it is useful to know for resonance assignment purposes that there are regions of significantly lower rotational dispersion. In fact, the variation in rotational dispersion is predominantly due to variations in the chemical shift dimension. As previously reported by presenting the data as dipolar and chemical shift waves (Kovacs, et al., 2000; Zeri, et al., 2003; Hu, et al., 2007) the dipolar waves eliminate the anisotropic chemical shift, thereby the rotational position of residues can be more precisely defined.
FIGURE 10. Rotational Dispersion of Resonances in PISA Wheels.
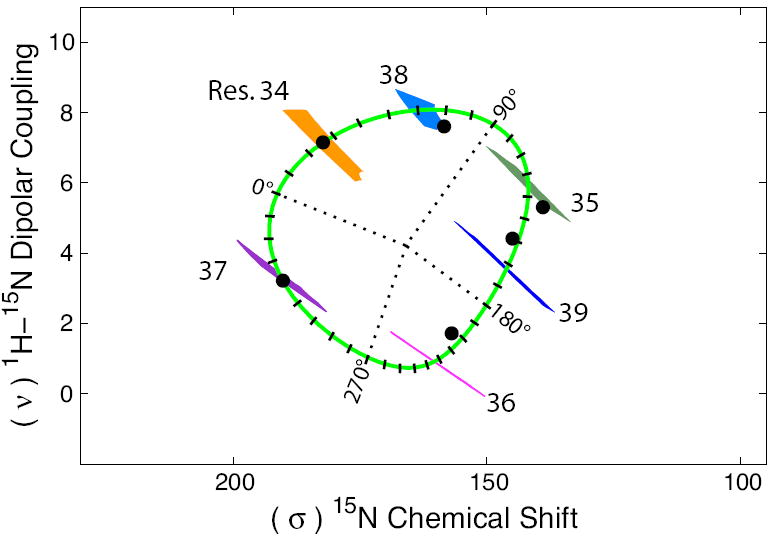
A PISA wheel with overlaid torsion angle maps and for residues 34-39 of M2-TMD illustrates the rotational dispersion, induced by local structural variations, expected for resonances around the wheel. These torsion angle maps were calculated using the optimized φ,ψ torsion angle region from Fig. 9. The PISA wheel is divided into 10° increments (tick marks). Resonances for M2-TMD from 1H-15N-PISEMA data are also shown (black circles) (Wang, et al., 2001). Data points for residues 35, 36, 38 and 39 are taken from experimental measurements. Residues 34 and 37 were not observed in experimental spectra but represent predicted values based upon uniform helical geometry (φ = -60°, ψ = -45°).
Discussion
Previously it has been suggested that 310-helices may provide an additional architecture for traversing the membrane bilayer (Engelman and Steitz, 1981), however 310-helices are characterized by peptide plane tilt angles of approximately 20°, which increases exposure of the partial negative charge of the carbonyl oxygen to the membrane environment compared to that for an α-helix. Exposing the carbonyl oxygens to the membrane bilayer is energetically unfavorable and to date only one example of a transmembrane 310-helix has been observed. This sole example, helix VII-310 of subunit I from the Paracoccus dentrificans enzyme cytochrome c oxidase (Ostermeier, et al., 1997), is 11 residues in length and is buried within the core of the transmembrane helical bundle. Only two of the carbonyl groups within Helix VII-310 are exposed to the lipid bilayer and this exposure occurs at the bilayer interfacial region where there are opportunities to stabilize these charges. Additionally residues His325 and His326 of Helix VII-310 are ligands for the binuclear metal center formed by the CuB and heme a3 sites and electrostatics in the region are highly influenced by the presence of the binuclear metal center.
While departures from uniformity for transmembrane helices have been observed by both crystallography and solid state NMR (Hu, et al., 2007), the membrane bilayer environment places strict energetic limits on allowed conformations. Observations of PISA wheels throughout the literature in solid state NMR are uniformly consistent with an average peptide plane tilt angle (relative to the helix axis) of 8°. Peptide plane tilt angles of 12°, consistent with the average torsion angles in α-helices of water soluble proteins, are well outside the experimental distribution of resonances as shown in Fig. 5 and in many other spectra in the literature. Interestingly, the torsion angles originally suggested by Pauling in 1951 (Pauling and Corey, 1951), based upon calculations in vacuo, provide a tilt angle of 8° (ϕ = -60° and ψ = -45°) consistent with the NMR data from many membrane proteins and peptides.
We have seen repeatedly through solid state NMR data, spectral simulations, transmembrane helix energetics (Ben-Tal, et al., 1996; Popot and Engelman, 2000) and analyses of membrane protein crystal structures that transmembrane helices are typically highly uniform structures. The linear correlation between crystallographic resolution and reduced torsion angle variance clearly shows this trend toward high helical uniformity. Similarly, the observation of PISA wheels is shown to be consistent with a maximum variation in backbone φ,ψ torsion angles of just ±6°. Here, detailing the restrictions from hydrogen bond geometry and peptide plane tilt angles refines this restriction in φ,ψ torsion angle space. It is now clear that transmembrane α-helices, as a result of their amino acid composition, the lack of water in the bilayer interstices and the low dielectric of the environment, have a tendency to be far more uniform in structure than their counterparts in water soluble proteins.
Experimental Procedures
PISEMA Spectral Simulations
Simulated PISEMA spectra were calculated using in-house scripts written for MatLab (The MathWorks, Natick, MA). For all PISEMA spectral simulations the motionally averaged dipolar magnitude (ν⫽ = 10.735 kHz) and motionally averaged chemical shift tensor (σ11 = 57.3, σ22 = 81.2, σ33 = 227.8 ppm) were held constant based on averaged experimental data (Wang, et al., 2000). The relative orientation between the chemical shift tensor element σ33 and ν⫽ of the dipolar tensor was set to 17°, consistent with previous experiments (Oas, et al., 1987; Teng, et al., 1992; Hong, et al., 1998) and simulations (Wang, et al., 2000; Brender, et al., 2001; Nevzorov and Opella, 2003). 15N chemical shifts were referenced to liquid ammonia at 0 ppm via a saturated solution of 15NH4NO3 at 26 ppm. Initial PISEMA spectra were simulated for an 18 residue α-helix with 0° rotation about the helical axis (ρ = 0°) and a helix axis tilt angle (τ) of 30° while backbone torsion angles (ϕ,ψ) were allowed to vary randomly about the ideal values (ϕ = -60°, ψ = -45°) (Kim and Cross, 2002). The helix axis tilt angle (τ) is defined as the angle between the magnetic field vector B0 and the helix axis (hz) and is defined as 0° when hz is parallel to B0. The helix rotation (ρ) is defined as the rotation of the Cα atom of the first helix residue away from the plane formed by hz and B0. The helix rotation is defined as 0° when the Cα atom lies between hz and B0 in the hz/B0 plane (Tian, et al., 2003). Randomized variations in (ϕ,ψ) for each residue were generated using a random number generator within MatLab. Simulations with randomized backbone torsion angle variations are denoted as ϕ,ψ = ± x°. Simulations incorporating fast dynamic motions utilized averaging of both chemical shift and dipolar couplings calculated for helices with a Gaussian distribution (width at half-height value of ± x°) for rotation about the helix axis or helix axis wobble. Simulations were also conducted for helices with a decreasing generalized order parameter (S2).
Simulated PISEMA spectra utilizing a restricted torsion angle space were conducted for the influenza A M2 proton channel transmembrane domain (M2-TMD) using a helix rotation (ρ) of 10°, helix tilt (τ) of 38°, and the chemical shift and dipolar tensors stated above. The restricted torsion angle space was determined through calculations of α-helical hydrogen bond (i to i+4) geometry for a range of torsion angles. A series of model peptides with 18 residues and standard peptide bond lengths and angles (Arnott and Dover, 1967) were built in MatLab and backbone ϕ,ψ torsion angles were allowed to vary between -10° and -100° in 1° increments for a total of 8100 model peptides. Calculations of hydrogen bond lengths (H•••O) and angles (N-H•••O and N•••O=C) were made for each model peptide and plotted on Ramachandran-δ diagrams (Kim and Cross, 2002).
Ramachandran Plots for Proteins of Known Structure
To probe transmembrane helix uniformity ϕ,ψ torsion angles were examined from residues within the transmembrane helices of 27 integral membrane protein crystal structures. Transmembrane helices were initially identified within the above proteins using TMHMM, v. 2.0 (Krogh, et al., 2001). Transmembrane helix termini were identified as two consecutive residues with N-H•••O distances of greater than 2.5Å. PDB codes for the 27 crystal structures analyzed were 1C3W, 1E12, 1EHK, 1EZV, 1FFT, 1FX8, 1IWG, 1JB0, 1JGJ, 1KQF, 1L7V, 1L9H, 1LGH, 1OCC, 1OKC, 1P7B, 1PRC, 1Q16, 1R3J, 1RC2, 1RHZ, 1SU4, 1VF5, 1XQF, 2AHY, 2OAR and 2OAU. Resolutions of the 27 analyzed structures range from 1.55 to 3.7Å. Backbone ϕ,ψ torsion angles were determined using the Bio3d package written for the R statistical software platform (Grant, et al., 2006). Ramachandran-δ diagrams and root mean square (rms) torsion angle variations were calculated using MatLab.
Acknowledgments
The authors wish to thank Sai Achuthan for helpful discussions and insights concerning energetics and geometries for transmembrane α–helix hydrogen bonds and the resolution of degeneracies for solid state NMR PISEMA spectra. R.C. Page was supported by American Heart Association predoctoral fellowship 0615223B. This work was supported by National Institutes of Health grants PO1 GM64676 and R01 AI23007. NMR spectroscopy was performed at the National High Magnetic Field Laboratory supported by NSF cooperative DMR-0084173 and the State of Florida.
Research Funding: American Heart Association (Predoctoral Fellowship 0615223B to R.C. Page); National Institutes of Health (Grants PO1 GM64676 and R01 AI23007); National High Magnetic Field Laboratory.
Footnotes
Publisher's Disclaimer: This is a PDF file of an unedited manuscript that has been accepted for publication. As a service to our customers we are providing this early version of the manuscript. The manuscript will undergo copyediting, typesetting, and review of the resulting proof before it is published in its final citable form. Please note that during the production process errors may be discovered which could affect the content, and all legal disclaimers that apply to the journal pertain.
References
- Arnott S, Dover SD. Refinement of bond angles of an α-helix. J Mol Biol. 1967;30:209–212. doi: 10.1016/0022-2836(67)90253-7. [DOI] [PubMed] [Google Scholar]
- Asbury T, Quine JR, Achuthan S, Hu J, Chapman MS, Cross TA, Bertram R. pipath: An optimized algorithm for generating α-helical structures from PISEMA data. J Magn Reson. 2006;183:87–95. doi: 10.1016/j.jmr.2006.07.020. [DOI] [PubMed] [Google Scholar]
- Baker EN, Hubbard RE. Hydrogen bonding in globular proteins. Prog Biophys Molec Biol. 1984;44:97–179. doi: 10.1016/0079-6107(84)90007-5. [DOI] [PubMed] [Google Scholar]
- Barlow DJ, Thornton JM. Helix geometry in proteins. J Mol Biol. 1988;201:601–619. doi: 10.1016/0022-2836(88)90641-9. [DOI] [PubMed] [Google Scholar]
- Ben-Tal N, Ben-Shaul A, Nicholls A, Honig B. Free-energy determinants of alpha-helix insertion into lipid bilayers. Biophys J. 1996;70:1803–1812. doi: 10.1016/S0006-3495(96)79744-8. [DOI] [PMC free article] [PubMed] [Google Scholar]
- Blundell T, Barlow D, Borkakoti N, Thornton J. Solvent-induced distortions and the curvature of alpha-helices. Nature. 1983;306:281–283. doi: 10.1038/306281a0. [DOI] [PubMed] [Google Scholar]
- Brender JR, Taylor DM, Ramamoorthy A. Orientation of amide-nitrogen-15 chemical shift tensors in peptides: a quantum chemical study. J Am Chem Soc. 2001;123:914–922. doi: 10.1021/ja001980q. [DOI] [PubMed] [Google Scholar]
- Brown MF, Seelig J, Haberlen U. Structural dynamics in phospholipid bilayers from deuterium spin--lattice relaxation time measurements. J Chem Phys. 1979;70:5045–5053. [Google Scholar]
- Buffy JJ, Traaseth NJ, Mascioni A, Gor’kov PL, Chekmenev EY, Brey WW, Veglia G. Two-dimensional solid-state NMR reveals two topologies of sarcolipin in oriented lipid bilayers. Biochemistry. 2006;45:10939–10946. doi: 10.1021/bi060728d. [DOI] [PubMed] [Google Scholar]
- Cantor RS. Lipid composition and the lateral pressure profile in bilayers. Biophys J. 1999;76:2625–2639. doi: 10.1016/S0006-3495(99)77415-1. [DOI] [PMC free article] [PubMed] [Google Scholar]
- Chakrabarti P, Bernard M, Rees DC. Peptide-bond distortions and the curvature of alpha-helices. Biopolymers. 1986;25:1087–1093. doi: 10.1002/bip.360250609. [DOI] [PubMed] [Google Scholar]
- Cramer WA, Engelman DM, Von Heijne G, Rees DC. Forces involved in the assembly and stabilization of membrane proteins. FASEB J. 1992;6:3397–3402. doi: 10.1096/fasebj.6.15.1464373. [DOI] [PubMed] [Google Scholar]
- DeAngelis AA, Howell SC, Nevzorov AA, Opella SJ. Structure Determination of a Membrane Protein with Two Trans-membrane Helices in Aligned Phospholipid Bicelles by Solid-State NMR Spectroscopy. J Am Chem Soc. 2006;128:12256–12267. doi: 10.1021/ja063640w. [DOI] [PMC free article] [PubMed] [Google Scholar]
- Donohue J. Hydrogen Bonded Helical Configurations of the Polypeptide Chain. Proc Natl Acad Sci USA. 1953;39:470–478. doi: 10.1073/pnas.39.6.470. [DOI] [PMC free article] [PubMed] [Google Scholar]
- Dürr UH, Yamamoto K, Im SC, Waskell L, Ramamoorthy A. Solid-state NMR reveals structural and dynamical properties of a membrane-anchored electron-carrier protein, cytochrome b5. J Am Chem Soc. 2007;129:6670–6701. doi: 10.1021/ja069028m. [DOI] [PMC free article] [PubMed] [Google Scholar]
- Engelman DM, Steitz TA. The spontaneous insertion of proteins into and across membranes: the helical hairpin hypothesis. Cell. 1981;23:411–422. doi: 10.1016/0092-8674(81)90136-7. [DOI] [PubMed] [Google Scholar]
- Fabiola F, Bertram R, Korostelev A, Chapman MS. An improved hydrogen bond potential: impact on medium resolution protein structures. Protein Sci. 2002;11:1415–1423. doi: 10.1110/ps.4890102. [DOI] [PMC free article] [PubMed] [Google Scholar]
- Grant BJ, Rodrigues AP, ElSawy KM, McCammon JA, Caves LS. Bio3d: an R package for the comparative analysis of protein structures. Bioinformatics. 2006;22:2695–2696. doi: 10.1093/bioinformatics/btl461. [DOI] [PubMed] [Google Scholar]
- Hong M, Gross JD, Hu W, Griffin RG. Determination of the Peptide Torsion Angle ϕ by 15N Chemical Shift and 13Cα-1Hα Dipolar Tensor Correlation in Solid-State MAS NMR. J Magn Reson. 1998;135:169–177. doi: 10.1006/jmre.1998.1573. [DOI] [PubMed] [Google Scholar]
- Hu J, Asbury T, Achuthan S, Li C, Bertram R, Quine JR, Fu R, Cross TA. Backbone structure of the amantadine-blocked trans-membrane domain M2 proton channel from influenza A virus. Biophys J. 2007;92:4335–4343. doi: 10.1529/biophysj.106.090183. [DOI] [PMC free article] [PubMed] [Google Scholar]
- Hughson AG, Lee GF, Hazelbauer GL. Analysis of protein structure in intact cells: Crosslinking in vivo between introduced cysteines in the transmembrane domain of a bacterial chemoreceptor. Protein Sci. 1997;6:315–322. doi: 10.1002/pro.5560060206. [DOI] [PMC free article] [PubMed] [Google Scholar]
- Jeffrey GA, Saenger W. Hydrogen Bonding in Biological Structures. Berlin; Springer: 1991. [Google Scholar]
- Kim S, Cross TA. Uniformity, ideality, and hydrogen bonds in transmembrane α-helices. Biophys J. 2002;83:2084–2095. doi: 10.1016/S0006-3495(02)73969-6. [DOI] [PMC free article] [PubMed] [Google Scholar]
- Kovacs FA, Denny JK, Song Z, Quine JR, Cross TA. Helix tilt of the M2 transmembrane peptide from influenza A virus: an intrinsic property. J Mol Biol. 2000;295:117–125. doi: 10.1006/jmbi.1999.3322. [DOI] [PubMed] [Google Scholar]
- Krogh A, Larsson B, von Heijne G, Sonnhammer EL. Predicting transmembrane protein topology with a hidden Markov model: application to complete genomes. J Mol Biol. 2001;305:567–580. doi: 10.1006/jmbi.2000.4315. [DOI] [PubMed] [Google Scholar]
- Levin EJ, Kondrashov DA, Wesenberg GE, Phillips GN., Jr Ensemble Refinement of Protein Crystal Structures: Validation and Application. Structure. 2007;15:1040–1052. doi: 10.1016/j.str.2007.06.019. [DOI] [PMC free article] [PubMed] [Google Scholar]
- Li C, Gao P, Qin H, Chase R, Gor’kov PL, Brey WW, Cross TA. Uniformly aligned full-length membrane proteins in liquid crystalline bilayers for structural characterization. J Am Chem Soc. 2007;129:5304–5305. doi: 10.1021/ja068402f. [DOI] [PMC free article] [PubMed] [Google Scholar]
- Li C, Qin H, Gao FP, Cross TA. Solid-state NMR characterization of conformational plasticity within the transmembrane domain of the influenza A M2 proton channel. Biochim Biophys Acta. 2007;1768:3162–3170. doi: 10.1016/j.bbamem.2007.08.025. [DOI] [PMC free article] [PubMed] [Google Scholar]
- Low BW, Baybutt RB. The Pi Helix--A Hydrogen Bonded Configuration of the Polypeptide Chain. J Am Chem Soc. 1952;74:5806–5807. [Google Scholar]
- Low BW, Greenville-Wells HJ. Generalized Mathematical Relationships for Polypeptide Chain Helices. The Coordinates of the Pi Helix. Proc Natl Acad Sci USA. 1953;39:785–802. doi: 10.1073/pnas.39.8.785. [DOI] [PMC free article] [PubMed] [Google Scholar]
- Mai W, Hu W, Wang C, Cross TA. Orientational constraints as three-dimensional structural constraints from chemical shift anisotropy: the polypeptide backbone of gramicidin A in a lipid bilayer. Protein Sci. 1993;2:532–542. doi: 10.1002/pro.5560020405. [DOI] [PMC free article] [PubMed] [Google Scholar]
- Marassi FM, Opella SJ. A Solid-State NMR Index of Helical Membrane Protein Structure and Topology. J Magn Reson. 2000;144:150–155. doi: 10.1006/jmre.2000.2035. [DOI] [PMC free article] [PubMed] [Google Scholar]
- Marassi FM, Opella SJ. Simultaneous assignment and structure determination of a membrane protein from NMR orientational restraints. Protein Sci. 2003;12:403–411. doi: 10.1110/ps.0211503. [DOI] [PMC free article] [PubMed] [Google Scholar]
- Marrink S-J, Berkowitz M. Water and Membranes. In: Disalvo EA, Simon SA, editors. Permeability and stability of lipid bilayers. Boca Raton: CRC Press; 1994. pp. 21–48. [Google Scholar]
- Nevzorov AA, Opella SJ. Structural fitting of PISEMA spectra of aligned proteins. J Magn Reson. 2003;160:33–39. doi: 10.1016/s1090-7807(02)00138-6. [DOI] [PubMed] [Google Scholar]
- Nilsson J, Persson B, von Heijne G. Comparative analysis of amino acid distributions in integral membrane proteins from 107 genomes. Proteins. 2005;60:606–616. doi: 10.1002/prot.20583. [DOI] [PubMed] [Google Scholar]
- Oas TG, Hartzell CJ, Dahlquist FW, Drobny GP. The amide nitrogen-15 chemical shift tensors of four peptides determined from carbon-13 dipole-coupled chemical shift powder patterns. J Am Chem Soc. 1987;109:5962–5966. [Google Scholar]
- Opella SJ, Marassi FM, Gesell JJ, Valente AP, Kim Y, Oblatt-Montal M, Montal M. Structures of the M2 channel-lining segments from nicotinic acetylcholine and NMDA receptors by NMR spectroscopy. Nat Struct Biol. 1999;6:374–379. doi: 10.1038/7610. [DOI] [PMC free article] [PubMed] [Google Scholar]
- Ostermeier C, Harrenga A, Ermler U, Michel H. Structure at 2.7 Å resolution of the Paracoccus denitrificans two-subunit cytochrome c oxidase complexed with an antibody FV fragment. Proc Natl Acad Sci USA. 1997;94:10547–10553. doi: 10.1073/pnas.94.20.10547. [DOI] [PMC free article] [PubMed] [Google Scholar]
- Page RC, Li C, Hu J, Gao FP, Cross TA. Lipid Bilayers: An Essential Environment for the Understanding of Membrane Proteins. Magn Reson Chem. 2007;45:S2–S11. doi: 10.1002/mrc.2077. [DOI] [PubMed] [Google Scholar]
- Park SH, Mrse AA, Nevzorov AA, Mesleh MF, Oblatt-Montal M, Montal M, Opella SJ. Three-dimensional structure of the channel-forming transmembrane domain of virus protein “u” (Vpu) from HIV-1. J Mol Biol. 2003;333:409–424. doi: 10.1016/j.jmb.2003.08.048. [DOI] [PubMed] [Google Scholar]
- Pauling L, Corey RB. Two Hydrogen-Bonded Spiral Configurations of the Polypeptide Chain. J Am Chem Soc. 1950;72:5349–5349. [Google Scholar]
- Pauling L, Corey RB. Atomic coordinates and structure factors for two helical configurations of polypeptide chains. Proc Natl Acad Sci USA. 1951;37:235–240. doi: 10.1073/pnas.37.5.235. [DOI] [PMC free article] [PubMed] [Google Scholar]
- Pauling L, Corey RB, Branson HR. The structure of proteins; two hydrogen-bonded helical configurations of the polypeptide chain. Proc Natl Acad Sci USA. 1951;37:205–211. doi: 10.1073/pnas.37.4.205. [DOI] [PMC free article] [PubMed] [Google Scholar]
- Poon A, Birn J, Ramamoorthy A. How Does an Amide-15N Chemical Shift Tensor Vary in Peptides? J Phys Chem B. 2004;108:16577–16585. doi: 10.1021/jp0471913. [DOI] [PMC free article] [PubMed] [Google Scholar]
- Popot JL, Engelman DM. Helical membrane protein folding, stability, and evolution. Annu Rev Biochem. 2000;69:881–922. doi: 10.1146/annurev.biochem.69.1.881. [DOI] [PubMed] [Google Scholar]
- Quine JR, Achuthan S, Asbury T, Bertram R, Chapman MS, Hu J, Cross TA. Intensity and mosaic spread analysis from PISEMA tensors in solid-state NMR. J Magn Reson. 2006;179:190–198. doi: 10.1016/j.jmr.2005.12.002. [DOI] [PubMed] [Google Scholar]
- Ramamoorthy A, Wei Y, Lee D-K. PISEMA Solid-State NMR Spectroscopy. In: Webb GA, editor. Ann R NMR S. Vol. 52. Academic Press; 2004. pp. 1–52. [Google Scholar]
- Ramamoorthy A, Kandasamy SK, Lee DK, Kidambi S, Larson RG. Structure, topology, and tilt of cell-signaling peptides containing nuclear localization sequences in membrane bilayers determined by solid-state NMR and molecular dynamics simulation studies. Biochemistry. 2007;46:965–975. doi: 10.1021/bi061895g. [DOI] [PMC free article] [PubMed] [Google Scholar]
- Sanders CR, Hare BJ, Howard KP, Prestegard JH. Magnetically-oriented phospholipid micelles as a tool for the study of membrane-associated molecules. Progress in Nuclear Magnetic Resonance Spectroscopy. 1994;26:421–444. [Google Scholar]
- Seelig A, Seelig J. The dynamic structure of fatty acyl chains in a phospholipid bilayer measured by deuterium magnetic resonance. Biochemistry. 1974;13:4839–4845. doi: 10.1021/bi00720a024. [DOI] [PubMed] [Google Scholar]
- Senes A, Ubarretxena-Belandia I, Engelman DM. The Cα---H•••O hydrogen bond: A determinant of stability and specificity in transmembrane helix interactions. Proc Natl Acad Sci USA. 2001;98:9056–9061. doi: 10.1073/pnas.161280798. [DOI] [PMC free article] [PubMed] [Google Scholar]
- Shanahan HP, Thornton JM. Amino acid architecture and the distribution of polar atoms on the surfaces of proteins. Biopolymers. 2005;78:318–328. doi: 10.1002/bip.20295. [DOI] [PubMed] [Google Scholar]
- Smith LJ, Bolin KA, Schwalbe H, MacArthur MW, Thornton JM, Dobson CM. Analysis of main chain torsion angles in proteins: prediction of NMR coupling constants for native and random coil conformations. J Mol Biol. 1996;255:494–506. doi: 10.1006/jmbi.1996.0041. [DOI] [PubMed] [Google Scholar]
- Spencer RH, Rees DC. The alpha-helix and the organization and gating of channels. Annu Rev Biophys Biomol Struct. 2002;31:207–233. doi: 10.1146/annurev.biophys.31.082901.134329. [DOI] [PubMed] [Google Scholar]
- Stickle DF, Presta LG, Dill KA, Rose GD. Hydrogen bonding in globular proteins. J Mol Biol. 1992;226:1143–1159. doi: 10.1016/0022-2836(92)91058-w. [DOI] [PubMed] [Google Scholar]
- Teng Q, Iqbal M, Cross TA. Determination of the carbon-13 chemical shift and nitrogen-14 electric field gradient tensor orientations with respect to the molecular frame in a polypeptide. J Am Chem Soc. 1992;114:5312–5321. [Google Scholar]
- Tian C, Gao PF, Pinto LH, Lamb RA, Cross TA. Initial structural and dynamic characterization of the M2 protein transmembrane and amphipathic helices in lipid bilayers. Protein Sci. 2003;12:2597–2605. doi: 10.1110/ps.03168503. [DOI] [PMC free article] [PubMed] [Google Scholar]
- Traaseth NJ, Buffy JJ, Zamoon J, Veglia G. Structural dynamics and topology of phospholamban in oriented lipid bilayers using multidimensional solid-state NMR. Biochemistry. 2006;45:13827–13834. doi: 10.1021/bi0607610. [DOI] [PubMed] [Google Scholar]
- Wang J, Denny J, Tian C, Kim S, Mo Y, Kovacs F, Song Z, Nishimura K, Gan Z, Fu R, Quine JR, Cross TA. Imaging Membrane Protein Helical Wheels. J Magn Reson. 2000;144:162–167. doi: 10.1006/jmre.2000.2037. [DOI] [PubMed] [Google Scholar]
- Wang J, Kim S, Kovacs F, Cross TA. Structure of the transmembrane region of the M2 protein H(+) channel. Protein Sci. 2001;10:2241–2250. doi: 10.1110/ps.17901. [DOI] [PMC free article] [PubMed] [Google Scholar]
- White SH, Wiener MC. Determination of the structure of fluid lipid bilayer membranes. In: Disalvo EA, Simon SA, editors. Permeability and stability of lipid bilayers. Boca Raton: CRC Press; 1994. pp. 1–19. [Google Scholar]
- White SH, Wimley WC. Membrane protein folding and stability: physical principles. Annu Rev Biophys Biomol Struct. 1999;28:319–365. doi: 10.1146/annurev.biophys.28.1.319. [DOI] [PubMed] [Google Scholar]
- Wu CH, Ramamoorthy A, Opella SJ. High-Resolution Heteronuclear Dipolar Solid-State NMR Spectroscopy. J Magn Reson Ser A. 1994;109:270–272. [Google Scholar]
- Xu F, Cross TA. Water: foldase activity in catalyzing polypeptide conformational rearrangements. Proc Natl Acad Sci USA. 1999;96:9057–9061. doi: 10.1073/pnas.96.16.9057. [DOI] [PMC free article] [PubMed] [Google Scholar]
- Zeri AC, Mesleh MF, Nevzorov AA, Opella SJ. Structure of the coat protein in fd filamentous bacteriophage particles determined by solid-state NMR spectroscopy. Proc Natl Acad Sci USA. 2003;100:6458–6463. doi: 10.1073/pnas.1132059100. [DOI] [PMC free article] [PubMed] [Google Scholar]


