

Abstract
West Nile virus (family Flaviviridae, genus Flavivirus, WNV) invaded the Colorado Desert biome of southern California during summer 2003 and seemed to displace previously endemic St. Louis encephalitis virus (family Flaviviridae, genus Flavivirus, SLEV, an antigenically similar Flavivirus in the Japanese encephalitis virus serocomplex). Western equine encephalomyelitis virus (family Togaviridae, genus Alphavirus, WEEV), an antigenically distinct Alphavirus, was detected during 2005 and 2006, indicating that conditions were suitable for encephalitis virus introduction and detection. Cross-protective “avian herd immunity” due to WNV infection possibly may have prevented SLEV reintroduction and/or amplification to detectable levels. During 2003−2006, WNV was consistently active at wetlands and agricultural habitats surrounding the Salton Sea where Culex tarsalis Coquillett served as the primary enzootic maintenance and amplification vector. Based on published laboratory infection studies and the current seroprevalence estimates, house sparrows, house finches, and several Ardeidae may have been important avian amplifying hosts in this region. Transmission efficiency may have been dampened by high infection rates in incompetent avian hosts, including Gamble's quail, mourning doves, common ground doves, and domestic pigeons. Early season WNV amplification and dispersal from North Shore in the southeastern portion of the Coachella Valley resulted in sporadic WNV incursions into the urbanized Upper Valley near Palm Springs, where Culex pipiens quinquefasciatus Say was the primary enzootic and bridge vector. Although relatively few human cases were detected during the 2003−2006 period, all were concentrated in the Upper Valley and were associated with high human population density and WNV infection in peridomestic populations of Cx. p. quinquefasciatus. Intensive early mosquito control during 2006 seemed to interrupt and delay transmission, perhaps setting the stage for the future reintroduction of SLEV.
Keywords: West Nile virus, St. Louis encephalitis virus, western equine encephalomyelitis virus, Culex tarsalis, Culex pipiens quinquefasciatus
Although a single human case of West Nile virus (family Flaviviridae, genus Flavivirus, WNV) reportedly was acquired in Los Angeles, CA, during 2002, enzootic activity was not documented in California until 2003, when a pool of Culex tarsalis Coquillett collected near El Centro in Imperial County on 16 July tested positive (Reisen et al. 2004b). Epidemic transmission occurred the following year in Los Angeles, but then it subsided dramatically, perhaps in association with increasing “herd immunity” within the peridomestic passerine community and the depopulation of some corvid roosts (Wilson et al. 2006). This pattern of invasion, amplification, and subsidence has been reported elsewhere as WNV has invaded new areas of North America (Komar 2003, Hayes et al. 2005).
Transmission of St. Louis encephalitis virus (family Flaviviridae, genus Flavivirus, SLEV), a member of the Japanese encephalitis virus (family Flaviviridae, genus Flavivirus, JEV) serocomplex closely related to WNV, has been documented continually in California since its discovery as a cause of human illness in 1938 (Howitt 1939, Reeves and Hammon 1962). Although activity levels were highly variable (Fig. 1), enzootic SLEV activity was detected either by sentinel chicken seroconversions or by positive mosquito pools during each of the 20 yr before our study (Hui et al. 1999, Steinlein et al. 2003). Most SLEV activity has been confined to the southeastern desert biome (Madon et al. 1974; Workman et al. 1976; Meylan et al. 1989; Reisen et al. 1992a, 2002, 2004b), with occasional incursions into Los Angeles (Murray et al. 1985, Work et al. 1985) and Kern County (Reisen et al. 1992b), resulting in limited outbreaks of human illness. The invasion of WNV into the SLEV endemic areas of southeastern California provided a unique natural experiment to test the hypothesis that two closely related members of the Japanese encephalitis virus serocomplex could not persist and amplify concurrently within the same niche (Work 1971). WNV and SLEV seem to exploit the same avian host and vector species, although the NS3 helicase mutation present in the invading WNV genotype that confers elevated virulence for passeriform birds, especially the Corvidae (Brault et al. 2007), would seem to provide a competitive advantage. We tested this hypothesis herein by comparing enzootic activity levels of both viruses over a 4-yr period after the invasion of WNV. During 2005, western equine encephalomyelitis virus (family Togaviridae, genus Alphavivirus, WEEV) was reintroduced into southeastern California (Hom et al. 2006). We present these regional data to document that an antigenically different virus that exploits the same mosquito and avian hosts was able enter and amplify in southeastern California concurrently with WNV.
Fig. 1.
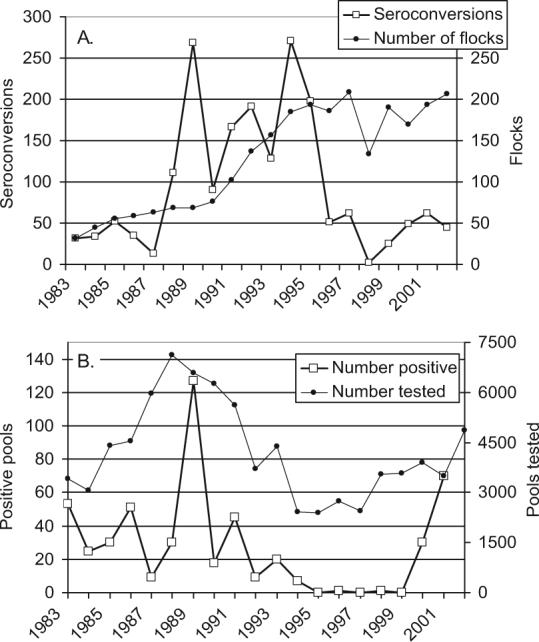
Twenty-year history of SLEV activity in (A) sentinel chicken flocks and (B) mosquito pools before the arrival of WNV. Data from California Mosquitoborne Encephalitis Virus Surveillance Program summarized from Hui et al. (1999) and Steinlein et al. (2003).
The incidence of human cases in the deserts of southeastern California has remained low compared with Los Angeles and the San Joaquin Valley, despite the repeated detection of high levels of enzootic WNV activity each summer. Moderate vector competence and low numbers of highly susceptible avian hosts such as American crows seemed to result in low infection rates in peridomestic populations of Culex pipiens quinquefasciatus Say, perhaps limiting human cases (Reisen et al. 2006a). A primary objective of our current research was to expand these early observations and to describe the distribution, amplification, and dispersal of WNV in the desert biome of southeastern California, where temperature is not limiting and the Culex vector species, tarsalis and p. quinquefasciatus, are abundant and reproductively active throughout most of the year.
Materials and Methods
Description of Study Area
The Salton Sea and peripheral desert separates the intensely irrigated agroecosystems of the Coachella and Imperial valleys (Fig. 2). The Coachella Valley (1,748 km2) slopes downward from residential areas surrounding the city of Palm Springs in the northwest at an elevation of 150 m to intensely irrigated agriculture in the southeast along the Salton Sea at an elevation of −69 m below sea level. The Whitewater riparian corridor transects the Coachella Valley and flows into the north end of the Salton Sea, creating a delta region heavily populated by water birds. The Imperial Valley (11,905 km2) and northern parts of Baja Norte and Sonora states of Mexico are extensively irrigated for row crops and citrus, with tail water feeding into the Alamo and New rivers, which flow north into the Salton Sea. Climate in southeastern California typically is dry with little rain, occasionally concentrated during brief summer monsoon or winter rains. Temperatures are mild during winter and hot during summer, when maximum temperatures approach 45°C. Most importantly, maximum temperatures during every month exceed minimum thresholds required for SLEV and WNV extrinsic incubation (Reisen et al. 2006b), thereby theoretically allowing virus transmission to occur throughout the year.
Fig. 2.

Map of Coachella Valley showing the locations of fixed mosquito trapping sites and chicken flocks within each geographic zone. Insert shows locations of sites at Zone A along the southern shore of the Salton Sea in Imperial County.
Sampling during the current study focused on wetlands managed for migratory waterfowl in Imperial County along the South Shore of the Salton Sea and on multiple sites in different habitats within the Coachella Valley. Based on landscape, and the history of virus activity and dispersal (Reisen et al. 1995a), we divided Coachella Valley into areas along the North and West shores of the Salton Sea, wetlands managed for duck hunting, and Upland, Mid Valley, and Upper Valley zones, progressing from the rural community of Mecca to urban Palm Springs (Fig. 2).
Sampling
The locations of fixed mosquito sampling sites are shown in Fig. 2. Mosquitoes were collected biweekly using dry ice-baited CDC-style traps (CO2 traps) that were operated for one night without lights (Newhouse et al. 1966). In the residential settings of Coachella Valley, gravid Cx. p. quinquefasciatus females also were collected using hay infusion-baited up-draft gravid female traps (Cummings 1992). Collections were returned alive to the laboratory where mosquitoes were anesthetized with triethylamine; identified to species, sex, and reproductive condition; enumerated into pools of ≤50 females each; frozen at −80°C; and then shipped on dry ice to the Center for Vectorborne Diseases BSL3 Arbovirus Laboratory at University of California, Davis (CVEC), for later testing for virus infection.
Ten sentinel White Leghorn laying hens, 16−18 wk old, were prebled, banded, and deployed each April at three standard coop sites in Imperial Valley and 9−10 sites in Coachella Valley (Fig. 2). Hens were bled by lancet prick of the comb, with the blood collected on filter paper strips (Reisen et al. 1993), dried at air temperature, and shipped to the Viral and Rickettsial Diseases Laboratory of the California Department of Health Services for testing. Hens seroconverting or dying were replaced at the next scheduled bleeding. Care and bleeding of sentinel chickens was approved by a University of California Davis Institutional Animal Care and Use Committee (IACUC) protocol.
From January 2003 through June 2005, wild birds were collected weekly or biweekly in Coachella Valley at two fixed mist netting sites (8−10 size 36−38-mm mesh mist nets operated for 3−4 h starting at dawn) on the northeastern and northwestern shores of the Salton Sea, and at seven grain-baited traps located from the Salton Sea through Palm Springs to the northwest. Bird collection sites were situated within 0.5 km of the chicken flocks shown in Fig. 2. Birds were identified to species, sex, and age; banded using U.S. Geological Survey (USGS) bands; bled (0.1 ml of blood into 0.9 ml of saline); and then immediately released near the point of capture. Blood samples were held at ambient conditions until transported to the laboratory where they were clarified by centrifugation and frozen at −80°C until shipped to CVEC for testing. The collection of wild birds was done under an approved IACUC Protocol, CA Resident Scientific Collection Permit 801049−02 by the State of California Department of Fish and Game, Federal Fish and Wildlife Permit No. MB082812−0, and Master Station Banding Marking and Salvage Permit No. 22673 by the USGS.
Dead birds were reported by the public to the Dead Bird Program hotline (McCaughey et al. 2003), identified to species if possible, geocoded, and mapped. Birds collected within 24 h of death were shipped to the California Animal Health and Food Safety laboratory at San Bernardino or Davis for necropsy and kidney tissue samples forwarded to CVEC for testing.
Human and equine cases were diagnosed by local health care providers and reported to county and state health departments.
Laboratory Testing
Mosquito pools were triturated in a Spex Mixer Mill (Spex CertiPrep, Metuchen, NJ) in diluent (phosphate-buffered saline, 15% fetal bovine serum, antibiotics) and the RNA extracted using either a robotic ABI 6700 or manually using an ABI 6100 (Applied Biosystems, Foster City, CA). RNA were screened for WNV, SLEV, and WEEV by using a real-time multiplex reverse transcription-polymerase chain reaction (RT-PCR) with an ABI Prism 7900 TaqMan, using published (Lanciotti and Kerst 2001) and unpublished primers from the envelope gene. Initially, all positives were confirmed by virus isolation on Vero cell culture, in situ enzyme immunoassay (EIA) (Graham et al. 1986), and/or a second singleplex RT-PCR by using primer sets from the North Shore region (Chiles et al. 2004). Confirmation rates were excellent if the critical threshold (Ct) score was <30; therefore, during years 3 and 4 of our study confirmation by the second primer set was only done on samples with a screening Ct value >30 and <40. Dead bird tissues were screened and confirmed only for WNV by using a singleplex RT-PCR following the same paradigm as indicated above for mosquito pools. Previous studies indicated that few birds succumb from infection with WEEV or SLEV (Reisen et al. 2003b).
Chicken sera were screened for antibody by WEEV and WNV/SLEV antigens by using an EIA (Reisen et al. 1994). Wild bird sera were screened using an indirect sandwich EIA with a polyclonal anti-bird detector antibody (Chiles and Reisen 1998, Ebel et al. 2002). Presumptive positives were confirmed using a plaque reduction neutralization test (PRNT), with positives producing >80% reduction of >50 plaques at a 1:20 dilution. To identify the infecting virus, an end point titer ≥4× the competing virus was used to separate antibody raised by WNV or SLEV. Because of antigenic similarity definitive determination was not always possible, so wild bird sera were scored as being negative (EIA positive/negative well ratio <2), unconfirmed Flavivirus (P/N >2, PRNT ≥1:20), Flavi-virus confirmed (P/N >2 and PRNT ≥1:20, but PRNT <4× competing virus), and WNV or SLEV (P/N >2, PRNT titer ≥4× the competing virus). Data were presented for Flavivirus, SLEV, and WNV positives, because previously we demonstrated that EIA but not PRNT antibody persists into the following season (Reisen et al. 2003a, 2004a), so many of the unconfirmed EIA positives during the spring were probably old infections from the previous summer.
Results
Climate
Rainfall and temperature were reported from Mecca in Coachella Valley (Figs. 2 and 3). Rainfall was scarce, with only 105 mm falling on 47 d during the 4-yr period; only three rainfall events exceeded 10 mm, and no rain was detected from March 2005 through December 2006. The depth of the Salton Sea progressively decreased during our study (Fig. 4), thereby limiting vernal shoreline inundation and mosquito larval habitat. Maximum daily temperatures ranged from 10.6 to 46.1°C and generally remained above the 14°C minimum required for SLEV or WNV replication in Cx. tarsalis (Reisen et al. 2006b), thereby allowing viral replication in infected mosquitoes during every month of the year. When tested by analysis of variance (ANOVA) blocked by month, mean annual maximum temperatures did not vary significantly among years (F = 1.3, df = 3, 1413, P = 0.26). Minimum temperatures ranged from −1.7 to 33.3°C, and they were below 14°C from October through April. Minimum temperatures varied among years (F = 4.82; df = 3, 1,413; P = 0.002), being significantly warmer during 2003 (mean 15.5°C) than the other 3 yr (range 14.7−14.9°C) when tested by a Tukey–Kramer posteriori multiple range test (P = 0.05).
Fig. 3.

Changes in rainfall in mm and maximum and minimum temperature in °C recorded at the Mecca Fire Station, Riverside County, CA (33° 32′ N, 119° 59′W, elevation 55 m), January 2003–December 2006. Horizontal line shows the minimal temperature required for WNV replication in Cx. tarsalis mosquitoes.
Fig. 4.

Monthly and yearly changes in the maximum elevation of the surface of the Salton Sea in meters below sea level at North Shore, Riverside County, CA (33° 33′ N, 115° 49′ W).
Mosquito Abundance
Overall, 661,950 female mosquitoes comprising 13 species were collected by CO2 and gravid traps, of which Cx. tarsalis was most abundant, making up 46% of the total, followed by Culex erythrothorax Dyar (38%) and Cx. p. quinquefasciatus (10%). The less frequently collected species included Psorophora confinnis (Dyar & Knab) (3.2%) and Aedes vexans (Meigen) (2.4%); Culex stigmatosoma Dyar, Culex erraticus (Dyar & Knab), Aedes dorsalis (Meigen), Aedes taeniorhynchus (Wiedemann), Anopheles franciscanus McCraken, Anopheles hermsi Barr & Guptavanij, and Culiseta inornata (Williston) each made up <0.1%. Further analyses focused on the three abundant Culex species.
Counts of the three abundant Culex species per CO2 trap per night, transformed by ln(y + 1), varied significantly among zones when tested by repeated measures ANOVAs, with years and zones as main effects (F > 4.3; df = 6, 27; P < 0.001). These patterns were not significantly different among years, because both the year and year by zone interaction effects were not significant (P > 0.05). Cx. tarsalis was most abundant within zones A and C near the Salton Sea containing managed wetlands that were inundated during late summer–fall to produce habitat for migratory water fowl, followed by wetlands in zones B and D at the North and West shores of the Salton Sea, respectively, and then zones E–G that were progressively more densely populated moving from the southeastern to northwestern portion of the Coachella Valley (Fig. 2; Table 1). Seasonal abundance patterns with vernal and autumnal peaks generally reflected changes in water availability (Fig. 5). Midsummer declines were associated with hot dry weather, and the decrease in the depth of the Salton Sea, whereas winter declines were associated with cool weather and reproductive diapause in Cx. tarsalis (Reisen et al. 1995d). The regional abundance pattern for Cx. p. quinquefasciatus was opposite that observed for Cx. tarsalis, with significantly (P < 0.05) greatest abundance detected in the urbanized zone G in the Upper Valley, followed by zones F and E (Table 1). Even though larval habitats were associated with urban sources in older neighborhoods, abundance peaked during spring, similar to Cx. tarsalis near the Salton Sea (Fig. 5). Larvae of Cx. erythrothorax only develop in wetlands with dense stands of cattails (Bohart and Washino 1978), and in agreement this species was only abundant within zones A and D, both of which contained wetlands with large Typha stands.
Table 1.
Geometric mean abundance of Cx. tarsalis, Cx. p. quinquefasciatus (quink), and Cx. erythrothorax (erythro) per CO2 trap-night within each of seven geographical zones during April—October 2003−2006
| Zone | Trap-nights | Cx. tarsalis | Cx. quink | Cx. erythro |
|---|---|---|---|---|
| A. South Shore | 382 | 71.9a | 0.1c | 16.9a |
| B. North Shore | 814 | 12.7bc | 0.4c | 1.2b |
| C. Duck Club | 388 | 59.5a | 1.3c | 1.8b |
| D. West Shore | 545 | 37.2a | 4.5b | 8.4a |
| E. Upland | 830 | 7.7c | 4.2c | 0.1b |
| F. Mid Valley | 276 | 11.5bc | 14.3a | 1.0b |
| G. Upper Valley | 282 | 0.3d | 11.1ab | 0.0b |
Means followed by the same letter were not significantly different when tested by Fisher's least significant difference (P > 0.05).
Fig. 5.

Geometric mean abundance in Cx. tarsalis and Cx. p. quinquefasciatus (quink) per trap night collected at replicated dry ice-baited traps within each of the seven zones during 2003−2006.
Mosquito Infection
Overall, 356,893 female mosquitoes were tested in 9,139 pools, of which 19 were positive for WEEV, three for SLEV, and 248 for WNV (Table 2). Pools positive for WEEV were detected only during 2005 in Cx. tarsalis collected from wetlands near the Salton Sea. The three pools positive for SLEV were detected in Cx. tarsalis collected from wetlands in Coachella Valley during 2003; in July before the establishment of WNV and in August and October after WNV was detected in the same area. All pools positive for WNV were from either Cx. tarsalis or Cx. p. quinquefasciatus. Overall, 188 (2.9%) of 6,427 pools of Cx. tarsalis were positive for WNV, with an MLE infection rate (IR) of 0.68 positive females per 1,000 tested. The percentage of Cx. p. quinquefasciatus pools positive (2.9%; 60 pools positive of 2,039 tested) was identical to Cx. tarsalis, but the IR was higher (1.01 per 1,000), because Cx. tarsalis were collected throughout the year, whereas Cx. p. quinquefasciatus were collected mostly during summer in the urban areas where pool size frequently was <50 and many of the females tested were collected by gravid traps. These gravid females had blood fed ≥3 d previously, were now ready to oviposit; therefore, they were more likely to be infected than females collected in CO2 traps that included many nulliparous females host-seeking for the first time (Reisen et al. 1995b). Positive WNV pools were detected during each year in Cx. tarsalis, whereas 54 of 60 Cx. p. quinquefasciatus positive pools were collected during 2005, when sampling was expanded during evaluations of ground ULV applications (Lothrop et al. 2007). Of these 54 positive pools, 19 (35%) were from females collected from gravid traps.
Table 2.
Summary of surveillance results by year
| Surveillance method | 2003 | 2004 | 2005 | 2006 | Total |
|---|---|---|---|---|---|
| Mosquito collections | |||||
| Trap-nights: CO2 trap | 1,022 | 991 | 1,201 | 946 | 4,160 |
| Gravid | 0 | 0 | 105 | 596 | 701 |
| Cx. tarsalis | 102,341 | 63,072 | 84,308 | 72,416 | 322,137 |
| Cx. p. quinquefasciatus | 14,365 | 4,567 | 33,627 | 24,355 | 76,914 |
| Cx. erythrothorax | 85,813 | 34,623 | 107,421 | 62,920 | 290,777 |
| Mosquito pools (n) | 1,803 | 1,840 | 2,758 | 2,731 | 9,132 |
| Total mosquitoes | 73,921 | 67,190 | 109,796 | 105,986 | 356,893 |
| Positive pools | |||||
| WNV | 22 | 104 | 83 | 39 | 248 |
| SLEV | 3 | 0 | 0 | 0 | 3 |
| WEEV | 0 | 0 | 19 | 0 | 19 |
| Sentinel chickens (flocks) | 13 | 13 | 12 | 12 | 12−13 |
| Seroconversions | |||||
| WNV | 50 | 85 | 94 | 107 | 336 |
| SLEV | 4 | 0 | 0 | 0 | 4 |
| WEEV | 0 | 0 | 43 | 2 | 45 |
| Wild birds (sera tested) | 3,456 | 3,523 | 921a | 0 | 7,900 |
| WNV | 40 | 205 | 28 | 273 | |
| SLEV | 10 | 18 | 1 | 29 | |
| WNV/SLEV (UI) | 42 | 84 | 25 | 151 | |
| WEEV | 2 | 7 | 0 | 9 | |
| Dead birds tested (n) | 0 | 23 | 26 | 44 | 93 |
| WNV positive | 0 | 6 | 3 | 2 | 11 |
| Horse cases | 0 | 0 | 0 | 0 | 0 |
| Human cases | 0 | 7 | 5 | 1 | 13 |
Sampling terminated in June 2005.
Infection rates in Culex females varied regionally (Table 3). For Cx. tarsalis, infection rates were significantly highest along the South and North shores of the Salton Sea, whereas for Cx. p. quinquefasciatus regional infection rates were low throughout. Interestingly, infection rates for Cx. tarsalis and Cx. p. quinquefasciatus collected in the urbanized Upper Valley were not statistically different, because the 95% CL overlapped. Although abundance of both species typically peaked in early spring or fall, WNV infection rates typically were greatest during the hottest months in midsummer (Fig. 6), when they frequently exceeded the five per 1,000 threshold for epidemic transmission (Kramer 2007). Interestingly, WNV was detected in April 2004 and 2006 at North Shore (zone B), several months before WNV was detected at the South Shore (zone A) in Imperial County, prompting extensive early season mosquito control operations during 2005 and 2006 (B.L. et al., unpublished data).
Table 3.
Overall WNV IRs per 1,000 females tested estimated by the maximum likelihood method, included are the number of pools tested and 95% CL for each estimate
| Ecozone |
Cx. tarsalis |
Cx. p. quinquefasciatus |
||||
|---|---|---|---|---|---|---|
| Pools | IR | 95% CL | Pools | IR | 95% CL | |
| A. South Shore | 714 | 1.72 | 1.31, 2.23 | 2 | 0 | |
| B. North Shore | 1,272 | 1.07 | 0.82, 1.39 | 23 | 0 | 0.00, 6.78 |
| C. Duck Club | 2,259 | 0.46 | 0.34, 0.60 | 30 | 1.05 | 0.06, 5.14 |
| D. West Shore | 828 | 0.44 | 0.26, 0.71 | 118 | 0.53 | 0.09, 1.72 |
| E. Upland | 840 | 0.41 | 0.23, 068 | 284 | 0 | 0.00, 0.47 |
| F. Mid Valley | 317 | 0.39 | 0.15, 0.78 | 160 | 0 | 0.00, 0.81 |
| G. Upper Valley | 64 | 0.72 | 0.04, 3.48 | 1,422 | 1.49 | 1.15, 1.90 |
Fig. 6.

Cx. tarsalis and Cx. p. quinquefasciatus (quink) WNV infection rates per 1,000 females tested calculated by the maximum likelihood method of Biggerstaff and the cumulative number of sentinel chicken seroconversions per flock (chick) within each zone plotted as a function of time in months within each year.
Sentinel Chicken Seroconversions
Twelve to 13 flocks of 10 sentinel chickens each were bled biweekly from April through late fall or winter during each year, of which 45 chickens seroconverted to WEEV, four to SLEV and 336 to WNV (Table 2). Overall, 43 of 45 WEEV seroconversions occurred during 2005, agreeing with infection patterns in Cx. tarsalis. The two seroconversions detected during 2006 were the only evidence of WEEV activity that year in southeastern California, although WEEV remained active in Kern County to the north (Carroll et al. 2007). Four seroconversions to SLEV were detected within two flocks during September 2003 at zones A and B, after the arrival of WNV. Seroconversions to WNV were detected each year, and all flocks had at least one seroconversion during more than one season. The number of seroconversions per flock per zone per year was highest at South Shore and Duck Club zones A and C, and then the number progressively decreased moving northwest into Upper Valley zones E–G (Fig. 7), agreeing with the distribution of Cx. tarsalis abundance and infection rates (Tables 1 and 3). Because positive hens were replaced as soon as possible after seroconversion, flocks near the Salton Sea frequently had >10 seroconversions per year (Fig. 6). The seasonal timing of seroconversions generally agreed with increases in Cx. tarsalis infection rates, but on 10 of 28 occasions occurred earlier than or in the absence of mosquito infection (Fig. 6).
Fig. 7.

Sentinel chicken seroconversions to WNV per flock per year within each of seven zones.
Avian Seroprevalence
From January 2003 through June 2005, a total of 7,900 sera were collected from 91 species of birds and tested for antibodies, of which nine were positive for WEEV, 29 for SLEV, and 273 for WNV (Tables 2 and 4). These sera were screened for antibody by EIA by using WEEV and SLEV antigens, with positives tested by PRNT for confirmation and to separate antibodies from SLEV and WNV. An additional 151 sera were positive by EIA by using SLEV antigen and confirmed, but end point PRNT titers were equivocal for SLEV or WNV; therefore, the infecting virus could not be identified. SLEV positive birds were collected each year (Table 2), although the numbers positive progressively declined each year and 10 of the 29 SLEV positives, including all of those detected after June 2004, were considered to be dual infections with titers >1:80 for both SLEV and WNV. Collectively, these data indicated that there probably were no new SLEV infections after 2003. For further analyses, sera with unidentified Flavivirus and dual WNV/SLEV infections were combined with WNV positives to provide a measure of herd immunity.
Table 4.
Sera from free-ranging birds collected in Coachella Valley by mist-netting or grain baited traps from January 2003 through June 2005 and tested for antibodies to WEEV, SLEV, WNV, or unidentified Flavivirus (see text)
| Common name | Resid | Comp | Mortality (%) | Sera | Antibody positive |
Flavi (%) | Recap (%) | |||
|---|---|---|---|---|---|---|---|---|---|---|
| WEEV | SLEV | WNV | UI FLAV | |||||||
| Mourning dove | YR | 0, 0.019a | 0 | 1,761 | 3 | 3 | 31 | 37 | 4.0 | 19.1 |
| Gambel's quail | YR | 0 | 0 | 1,471 | 4 | 8 | 101 | 42 | 10.3 | 55.9 |
| House sparrow | YR | 0.73, 1.59a | 17 | 656 | 9 | 6 | 2.3 | 15.9 | ||
| House finch | YR | 1.51, 1.76a | 67 | 615 | 1 | 16 | 13 | 4.7 | 27.3 | |
| Brown-headed cowbird | YR | 0 | 0 | 343 | 2 | 5 | 2.0 | 67.1 | ||
| White-crowned sparrow | W | ND | 281 | 1 | 1 | 0.7 | 22.8 | |||
| Wilson's warbler | M | ND | 281 | 0.0 | 0.0 | |||||
| Common ground dove | YR | 0.34 | 0 | 252 | 37 | 13 | 19.8 | 26.2 | ||
| Yellow warbler | M | 1 | 25 | 238 | 0.0 | 0.0 | ||||
| Common yellowthroat | M | ND | 231 | 6 | 2.6 | 13.4 | ||||
| Savannah sparrow | W | ND | 183 | 1 | 2 | 1.6 | 2.7 | |||
| Rock pigeon | YR | 0a | 0 | 176 | 7 | 51 | 11 | 39.2 | 42.0 | |
| Abert's towhee | YR | ND | 172 | 2 | 1.2 | 52.3 | ||||
| Marsh wren | YR | ND | 162 | 1 | 1 | 1.2 | 37.7 | |||
| Orange-crowned warbler | M | 3.57 | 89 | 131 | 0.0 | 0.8 | ||||
| Gambel's White-crowned sparrow | W | 1.74 | 62 | 114 | 2 | 1.8 | 16.7 | |||
| Lincoln's sparrow | W | ND | 109 | 1 | 0.9 | 10.1 | ||||
| Song sparrow | YR | 1.24 | 17 | 95 | 0.0 | 42.1 | ||||
| Warbling vireo | M | ND | 70 | 0.0 | 0.0 | |||||
| Ruby-crowned kinglet | W | ND | 65 | 1 | 1 | 3.1 | 16.9 | |||
| Least bittern | YR | ND | 41 | 1 | 8 | 12 | 5 | 61.0 | 39.0 | |
| Audubon's warbler | W | ND | 37 | 0.0 | 0.0 | |||||
| Unidentified empidonax | M | ND | 32 | 0.0 | 6.3 | |||||
| Verdin | YR | ND | 32 | 0.0 | 0.0 | |||||
| MacGillivray's warbler | M | ND | 28 | 0.0 | 0.0 | |||||
| Western tanager | M | ND | 27 | 0.0 | 0.0 | |||||
| Northern rough-winged swallow | YR | ND | 26 | 0.0 | 0.0 | |||||
| Great-tailed grackle | YR | 2.01a | 33 | 22 | 1 | 4.5 | 0.0 | |||
| White-winged dove | S | ND | 19 | 1 | 4 | 3 | 42.1 | 10.5 | ||
| Nashville warbler | M | ND | 18 | 0.0 | 0.0 | |||||
| Swainson's thrush | M | ND | 17 | 0.0 | 0.0 | |||||
| Black-headed grosbeak | M | ND | 15 | 0.0 | 0.0 | |||||
| Eurasian collared-dove | YR | ND | 13 | 0.0 | 7.7 | |||||
| Lazuli bunting | M | ND | 11 | 0.0 | 0.0 | |||||
| Western kingbird | S | ND | 10 | 0.0 | 10.0 | |||||
| 56 species ≤9 specimens tested | 146 | 0 | 1 | 4 | 2 | 4.8 | 2.2 | |||
| Grand total | 7,900 | 9 | 29 | 273 | 151 | 5.7 | 27.4 | |||
Species listed in order of sera tested and included sera from recaptured banded birds [recap]. Also shown are residency status [Res], host competence [Comp] and mortality following experimental infection.
ND, not done.
Comp, WNV reservoir competence calculated following Komar et al. (2003).
Positive sera were detected in 21 of the 91 species of birds (Table 4). Overall, 27.4% of the 7,900 sera came from banded birds, of which 10% were WNV seropositive as defined above. This number was significantly higher than 4% of the unbanded birds that were seropositive. Data from recaptures were included in these analyses, because these birds were part of the entire population and their removal may have provided a downward bias in age structure and therefore WNV seroprevalence. There was no significant difference in WNV seroprevalence between hatching year (HY = 5.2%; n = 2,249) and after hatching year (AHY = 5.6%; n = 4,751) birds (P = 0.7). For this comparison, all birds older than HY, including second year and after second year birds, were combined with AHY birds. There were no statistical differences (P > 0.05) in seroprevalence (P > 0.05) among these >HY older age classifications when tested by chi-square test. WNV seroprevalence for birds in which sex could be determined indicated that there was no statistical difference (χ2 = 1.86, P = 0.17) between males (2.54%; n = 2,674) and females (3.34%; n = 1,887). Therefore, age and sex were not considered further in our analyses.
Numbers of birds positive for SLEV, WNV, and Flavivirus during each month are shown in Fig. 8A. Seroprevalence varied significantly among residency status (contingency χ2 = 112, df = 3, P < 0.001), being greater (18.9%) for summer resident species than year-round residents (6.6%; χ2 = 8.9, df = 1, P = 0.003) (Table 5). Seroprevalence was lowest in winter residents such as white-crowned sparrows and absent in transient migrants such as yellow and Wilson's warblers (Table 4). Similar to Cx. tarsalis abundance, WNV infection in Cx. tarsalis and sentinel chicken seroconversions, avian seroprevalence was significantly highest at wetlands near the Salton Sea and lowest at Mid and Upper Valley sites (χ2 = 167.3, df = 4, P < 0.001) (Table 6).
Fig. 8.

(A) Total avian sera positive for SLEV, WNV and unidentified flavivirus (FLAV) plotted as a function of month of collection. (B) Monthly avian seroprevalence rates against WNV among year round residents of Coachella Valley.
Table 5.
Residency status and seroprevalence of birds collected in Coachella Valley
| Residency | Tested | Positive | % |
|---|---|---|---|
| Migrant | 911 | 0 | 0.0 |
| Summer | 37 | 7 | 18.9 |
| Winter | 825 | 10 | 1.2 |
| Year-round | 6,123 | 407 | 6.6 |
| Total | 7,896 | 424 | 5.4 |
Positives included WNV and unidentified Flavivirus.
Table 6.
Avian seroprevalence rates by geographical zone, Coachella Valley
| Zone | Tested | Positive | % |
|---|---|---|---|
| B. North Shore | 3,315 | 242 | 7.3 |
| C. Duck Club | 941 | 103 | 10.9 |
| D. West Shore | 692 | 38 | 5.5 |
| F. Mid Valley | 485 | 10 | 2.1 |
| G. Upper Valley | 2,447 | 25 | 1.0 |
| Total | 7,880 | 418 | 5.3 |
Birds were not sampled in zones A and E.
Monthly changes in WNV seroprevalence for year-round resident avian species showed marked variation, with highest seroprevalence at the end of each transmission season during fall and early winter (Fig. 8B). The marked declines observed during January 2004 and February 2005 may relate to low sample sizes of 54 and 85 birds, respectively, during those months or to unknown factors. Although seroprevalence curves depicted the cumulative response of avian populations to infection, they failed to account for infection related mortality. Of the bird species captured during our study for which experimental infection data were available (Komar et al. 2003, Reisen et al. 2005a), those with highest viremias and therefore greatest host competence measures frequently had elevated mortality (e.g., house finches); therefore, they contributed minimally to herd immunity compared with species such as Gamble's quail that always survived infection (Reisen et al. 2006c). Mortality also was important because the depopulation of critical host species also could dampen amplification transmission (Ladeau et al. 2007).
Dead Birds
Overall, 12% (n = 93) of dead birds reported by the public and submitted for necropsy were positive for WNV by singleplex RT-PCR (Table 2). No dead birds were tested from Coachella Valley during 2003. Bird species testing positive during 2004−2006 included mallard duck (three positive/seven tested), American crow (two/four), American coot (one/one), house finch (one/10), house sparrow (one/five), barn owl (one/one), pigeon (one/one), and flamingo (one/one). All dead birds were reported from the northeastern part of the valley within urbanized zones E–G, emphasizing the importance of the human population in detecting and reporting dead birds. Few corvids are found within Coachella Valley (http://www.mbr-pwrc.usgs.gov/bbs/bbs.html), perhaps explaining the few numbers of dead birds reported. Large birds such as semidomesticated mallards were found at ponds in residential areas. The flamingo was part of a captive flock displayed at a hotel in Palm Desert.
Human Cases
In total, 13 human WNV cases were reported during 2004−2006; none were reported in 2003 (Table 2). All the human cases resided in the northeastern part of the valley within urbanized zones E–G, but the actual point of infection was not known. The population of Coachella Valley was estimated to be ≈411,000 in 2005, of which 320,000 lived within zones E–G. At the peak of the WNV outbreak in 2004, seven human cases were reported from Coachella Valley, yielding an incidence of 2.18 cases per 100,000 for the urbanized area. In contrast, 5% of residents had evidence of previous infection with SLEV, and these individuals resided throughout the valley (Reisen et al. 1996a). In this previous, serosurvey a special effort was made to obtain samples from residents of the agricultural communities near the Salton Sea, and it may be that these residents have a higher level of acquired immunity that those residing in the Upper Valley.
Discussion
The invasion of California by WNV seemed to result in the competitive displacement of SLEV, supporting our hypothesis that two antigenically similar Flaviviruses within the JEV complex cannot be amplified concurrently within the same niche. Reports from areas such as Pakistan (Igarashi et al. 1994), India (Jamgaonkar et al. 2003), and Australia (Russell 1995) where one or more Flaviviruses in the JEV complex persist sympatrically would seem to reject this hypothesis; however, detailed studies describing concurrent enzootic amplification of these viruses within the same host systems at the same locations are lacking. Although SLEV was detected during the invasion year of 2003, infected mosquitoes, sentinel chicken seroconversions, or human cases were not detected during the subsequent 2004−2006 period. Confirmed SLEV antibody in wild birds after 2004 was detected only in after hatching year birds, and it seemed to be old infections amplified by subsequent WNV infection, because the resulting PRNT antibody was not specific. Ongoing surveillance has failed to detect SLEV again during 2007 and will continue to search for the introduction of SLEV during 2008. In contrast, five, four, one, and two human SLEV cases were reported from adjacent Arizona during 2003−2006, respectively (http://diseasemaps.usgs.gov/sle_historical.html). SLEV cases also were reported from Texas and Mississippi, states concurrent with WNV activity.
Several factors related to avian virulence may have contributed to the apparent WNV competitive advantage. Previous infection of house finches with WNV produced sterilizing immunity against subsequent infection with both WNV and SLEV, whereas previous infection with SLEV protected against SLEV and WNV mortality, but it did not prevent a moderate WNV viremia after infection (Fang and Reisen 2006). Similar results were reported using a golden hamster laboratory model (Tesh et al. 2002). Although avian herd immunity against both viruses during spring seemed low, differences in seroprevalence rates may have contributed to the disappearance of SLEV from California. Overall, SLEV seroprevalence during the 4 yr before the arrival of WNV (1.3%; n = 7,857) (Table 7) was significantly lower (χ2 = 196, df = 1, P < 0.0001) than flavivirus seroprevalence rates during the following 3 yr (5.6%; n = 7,900) (Table 2). In addition, these seroprevalence rates failed to account for depopulation of key species such as house finches in which a high percentage die during acute infection (Table 4). In addition, although the median infectious dose to infect Cx. tarsalis with SLEV is much lower than with WNV (Hardy and Reeves 1990, Reisen et al. 2005a), SLEV is less virulent in birds, produces elevated viremia titers in fewer species, and it has lower overall host competency (Reisen et al. 2003b) than WNV. SLEV may rely upon elevated viremias produced in nestlings for effective amplification (Mahmood et al. 2004). In contrast, the invading strain of WNV produces elevated viremias in a wide range of bird species (Komar 2003), and it has effectively amplified to epidemic levels throughout California despite moderate susceptibility in Culex vectors (Reisen et al. 2005a). A combination of these and perhaps yet unknown factors have apparently been sufficient to preclude the reestablishment of SLEV. Interestingly, WEEV was detected in both Cx. tarsalis pools and sentinel chicken sera tested from Imperial, Coachella, and San Joaquin valleys (Carroll et al. 2006), thereby documenting the potential for an antigenically dissimilar virus using the same mosquito and avian hosts to be introduced and detected in California.
Table 7.
Avian seroprevalence rates with SLEV before the arrival of WNV
| Yr | Tested | SLEV positive | % |
|---|---|---|---|
| 1999 | 1,460 | 0 | 0.00 |
| 2000 | 2,206 | 30 | 1.36 |
| 2001 | 1,028 | 38 | 3.70 |
| 2002 | 2,399 | 27 | 1.13 |
The temporal and spatial distribution of enzootic WNV transmission generally mirrored the abundance of the primary vector mosquito, Cx. tarsalis, and it was similar to patterns reported previously for WEEV and SLEV (Reisen et al. 1992a, 1995c, 1996b, 2002), with the following exceptions: 1) amplification commenced earlier during spring, 2) Cx. p. quinquefasciatus became important epidemiologically after virus dispersed into the urbanized Upper Valley, 3) wild bird seroprevalence rates and therefore herd immunity were higher than recorded previously for SLEV, and 4) SLEV was absent. Cx. tarsalis was considered to be the primary enzootic maintenance and amplification vector in Coachella Valley, based on its high abundance, ornithophagic feeding habits throughout California (Reisen and Reeves 1990), and the Coachella Valley (Lothrop et al. 1997), frequent and repeated infection with WNV, and moderate to high vector competence (Goddard et al. 2002, Reisen et al. 2005a). Although transmission in the fall generally terminated in October with the onset of cooler weather and diapause in Cx. tarsalis (Reisen et al. 1995d), virus activity occasionally continued at a low levels into December. Previously, isolates of WEEV and SLEV were made from December through March, but not from 15 March through 15 May (Reisen et al. 1992a). In the current study, sentinel chicken flocks maintained during winter in zones A–D were tested monthly with negative results (data not shown). Multiple WNV positive pools of Cx. tarsalis were detected in April at North Shore in zone B during 2004 (14 April, two of 21 pools, infection rate 1.9 per 1,000) and 2006 (13 April, four of 19 pools, infection rate 4.2 per 1,000). Although WNV activity was detected in December in Texas (Tesh et al. 2004) and in January in San Bernardino (Hom et al. 2006) and Los Angeles, CA (Feiszli et al. 2007), to our knowledge these positive pools represent the earliest detection of WNV in host-seeking mosquitoes in North America. Early WNV activity allowed virus amplification and dispersal during peak vernal Cx. tarsalis abundance. Interestingly, although flooding of managed wetlands for migratory waterfowl during late summer and fall resulted in a significant increase in Cx. tarsalis abundance, WNV infection rates continued to subside during this period due to the high recruitment of nulliparous females associated with emergence from the flooded duck clubs. However, even though infection rates decreased, serocon-versions in sentinel chickens continued, thereby documenting the persistence of infectious female mosquitoes.
Cx. p. quinquefasciatus were abundant in older neighborhoods in the urbanized Upper Valley, zones F–G, and they were repeatedly infected during intensive sampling in 2005, but they seemed to be infrequently infected during other years. Similar to earlier cases of SLEV (Reisen et al. 1996a, 2002), human cases of WNV were detected only in residents of the Upper Valley. Although infection rates in Cx. tarsalis and Cx. p. quinquefasciatus were statistically similar within this urbanized area, it is likely that Cx. p. quinquefasciatus was the important bridge vector, because of its abundance in peridomestic habitats and diverse host-feeding pattern that includes humans (Reisen et al. 1990, Reisen and Reeves 1990).
Prevalence of Flavivirus antibody in 7,900 wild bird samples collected from January 2003 through June 2005 was 5.7%, significantly greater (χ2 = 556, P < 0.0001) than reported for SLEV during 1996−1998 (0.25%; n = 10,945) (Reisen et al. 2000) and observed subsequently (Fig. 8). Based on host-competence studies (Komar et al. 2003; Reisen et al. 2005a,b, 2006c) and the frequency of natural infection detected by seroprevalence, house sparrows, house finches, and perhaps selected ardeids, such as least bitterns, seem to be the most important avian host species in Coachella Valley. Although experimental infections were not done with least bitterns because of their threatened status in California, other ardeid species such as black-browned night herons produce very elevated viremias after experimental and natural infection, and they most likely are important hosts when nesting and roosting over land (Reisen et al. 2005b, Armijos et al. 2007). Several Columbiformes (mourning dove, common ground dove, white winged dove, and rock or domestic pigeon) and Galliformes (Gamble's quail and domestic chickens) were frequently seropositive, but adults of these species have a very low host competence, because they produce viremias that rarely exceed 4 log10 plaque-forming units of virus per ml. These species therefore probably are “dead end” hosts for WNV and their repeated infection most likely dampens transmission. Although not tested for WNV, mourning dove nestlings experimentally infected with SLEV produced very high viremias that efficiently infected Cx. tarsalis (Mahmood et al. 2004), so it is possible that nestling doves could contribute to viral amplification. In contrast, quail chicks were not competent hosts for either SLEV or WNV (Reisen et al. 2006c). High infection rates in less competent avian hosts probably dampen virus amplification in habitats with high avian diversity, because of the frequent diversion of infectious host-seeking vectors to incompetent hosts (Kilpatrick et al. 2006). Other competent avian hosts were either transients (e.g., orange crowned warbler) or winter residents (e.g., white-crowned sparrow) and most likely would be of minimal importance in virus amplification.
Collective Flavivirus herd immunity peaked at >10% during November 2003 and August 2004. Virus transmission seemed to abruptly subside after August 2004, despite the fact temperatures were not limiting and Cx. tarsalis abundance rebounded in response to wetland flooding in zones C and D. Similar transmission patterns were observed in subsequent years, but avian seroprevalence data were not available. A mid-season cessation of epidemic transmission also was observed in Los Angeles during the epidemic of 2004, but here house sparrow and house finch seroprevalence rates exceeded 35% (Wilson et al. 2006). In contrast, markedly higher herd immunity seemed to have had minimal impact on WNV transmission patterns in Kern County (Carroll et al. 2007). Our ongoing research attempts to elucidate epidemiological conditions that will allow the resurgence of WNV in California.
Corvids were noticeably absent from live bird serology or dead bird necropsy results from Coachella Valley. Although desert ravens and occasional American crows are found in Coachella Valley, they are relatively rare (http://www.mbr-pwrc.usgs.gov/bbs/bbs.html). Moderate vector competence and the absence of highly competent corvid populations were considered to reasons that infection rates were low within Cx. p. quinquefasciatus populations in Coachella Valley compared with those measured in Los Angeles and Kern Counties during 2004 (Reisen et al. 2006a). Interestingly, the following year, Cx. p. quinquefasciatus focal infection rates at several sites in zone G increased to epidemic levels of more than five infected females/1,000), and they were associated with a small outbreak of human cases. Unfortunately, avian sampling had been terminated by this time, and we have no data to explain this focal and ephemeral increase in activity.
The consistent pattern of early season activity at the relatively isolated and small area at North Shore, followed by dispersal to the rest of Coachella Valley, provided a unique opportunity to measure the ability of intense early season mosquito control to reduce or delay virus activity. Our results reported in a companion article (Lothrop et al. 2008) indicate that some of the reduction in virus activity during 2006 may be attributable to early season mosquito abatement.
Acknowledgments
We especially thank D. Gomsi, the Governing Board, and staff of the Coachella Valley Mosquito and Vector Control District who provided technical, logistical, and fiscal support for this project. Mosquito pools and dead bird tissues were tested by R. E. Chiles, E. G. Green, B. C. Young, N. Kahl, M. Shaffii, S. Ashtari, M. Dannen, K. Simmons, A. Chow, and others at the Arbovirus Research Unit, Center for Vectorborne Diseases, University of California, Davis. Dead bird reports were provided by the Dead Bird Surveillance Program led by R. Carney of the Vectorborne Disease Section, California Department of Public Health. Tissues were collected at necropsy by the California Animal Health of Food Safety Laboratory at University of California Davis. Reports of human cases were provided by the Riverside County Department of Health Services. Sentinel chicken sera were tested by E. Baylis and staff at the Viral and Rickettsial Diseases Laboratory, California Department of Public Health. Selected data summaries were provided by B. Park and C. Barker, University of California Davis. This research was funded, in part, by grant R01 AI55607 from the National Institute of Allergy and Infectious Diseases, National Institutes of Health, and special funds for the Mosquito Research Program allocated annually through the Division of Agriculture and Natural Resources, University of California.
References Cited
- Armijos V, Wheeler SS, Fang Y, Garcia S, Wright SA, Kelley K, Reisen WK. Are ardeid colonies nesting over dry land a source of West Nile virus amplification? Proc. Mosq. Vector Control Assoc. Calif. 2007;75:7–8. [Google Scholar]
- Bohart RM, Washino RK. Mosquitoes of California. University of California Press; Berkeley, CA: 1978. [Google Scholar]
- Brault AC, Huang CY, Langevin SA, Kinney RM, Bowen RA, Ramey WN, Panella NA, Holmes EC, Powers AM, Miller BR. A single positively selected West Nile viral mutation confers increased virogenesis in American crows. Nat. Genet. 2007;39:1162–1166. doi: 10.1038/ng2097. [DOI] [PMC free article] [PubMed] [Google Scholar]
- Carroll B, Takahashi RM, Barker CM, Reisen WK. The reappearance of West Nile Virus in Kern County during 2005. Proc. Mosq. Vector Control Assoc. Calif. 2006;74:12–15. [PMC free article] [PubMed] [Google Scholar]
- Carroll BD, Takahashi RM, Reisen WK. West Nile Virus activity in Kern County during 2006. Proc. Mosq. Vector Control Assoc. Calif. 2007;75:17–22. [PMC free article] [PubMed] [Google Scholar]
- Chiles RE, Green EN, Fang Y, Reisen WK, Edman JD, Brault AC. Surveillance for arboviruses in California mosquito pools: current and future protocols. Proc. Mosq. Vector Control Assoc. Calif. 2004;72:15–17. [Google Scholar]
- Chiles RE, Reisen WK. A new enzyme immunoassay to detect antibodies to arboviruses in the blood of wild birds. J. Vector Ecol. 1998;23:123–135. [PubMed] [Google Scholar]
- Cummings RF. Design and use of a modified Reiter gravid mosquito trap for mosquito-borne encephalitis surveillance in Los Angeles County, California. Proc. Mosq. Vector Control Assoc. Calif. 1992;60:170–176. [Google Scholar]
- Ebel GD, DuPuis AP, Nicholas D, Young D, Maffei J, Kramer LD. Detection by enzyme-linked immunosorbent assay of antibodies to West Nile virus in birds. Emerg. Infect. Dis. 2002;8:979–982. doi: 10.3201/eid0809.020152. [DOI] [PMC free article] [PubMed] [Google Scholar]
- Fang Y, Reisen WK. Previous infection with West Nile or St. Louis encephalitis viruses provides cross protection during reinfection in house finches. Am. J. Trop. Med. Hyg. 2006;75:480–485. [PubMed] [Google Scholar]
- Feiszli T, Park B, Kramer VL, Kjemtrup A, Eldridge BF, Fang Y, Reisen WK, Baylis E, Jean C, Glover J, et al. Surveillance for mosquito-borne encephalitis virus activity in California, 2006. Proc. Mosq. Vector Control Assoc. Calif. 2007;75:48–59. [Google Scholar]
- Goddard LB, Roth AE, Reisen WK, Scott TW. Vector competence of California mosquitoes for West Nile virus. Emerg. Infect. Dis. 2002;8:1385–1391. doi: 10.3201/eid0812.020536. [DOI] [PMC free article] [PubMed] [Google Scholar]
- Graham RR, Hardy JL, Presser SB. Use of the in situ enzyme immunoassay for the rapid detection of arbovirus infections in mosquitoes in California. Proc. Calif. Mosq. Vector Control Assoc. 1986;54:10. [Google Scholar]
- Hardy JL, Reeves WC. Experimental studies on infection in vectors. In: Reeves WC, editor. Epidemiology and control of mosquito-borne arboviruses in California, 1943−1987 Sacramento, California. California Mosquito Vector Control Association; Sacramento, CA: 1990. pp. 145–250. [Google Scholar]
- Hayes EB, Komar N, Nasci RS, Montgomery SP, O'Leary DR, Campbell GL. Epidemiology and transmission dynamics of West Nile virus disease. Emerg. Infect. Dis. 2005;11:1167–1173. doi: 10.3201/eid1108.050289a. [DOI] [PMC free article] [PubMed] [Google Scholar]
- Hom A, Bonilla D, Kjemtrup A, Kramer VL, Cahoon-Young B, Barker CM, Marcus L, Glaser C, Cossen C, Baylis E, et al. Surveillance for mosquito-borne encephalitis virus activity and human disease, including West Nile virus, in California, 2005. Proc. Mosq. Vector Control Assoc. Calif. 2006;74:43–55. [Google Scholar]
- Howitt BF. Viruses of equine and St. Louis encephalitis in relationship to human infections in California 1937−1938. Am. J. Publ. Health. 1939;29:1083–1097. doi: 10.2105/ajph.29.10.1083. [DOI] [PMC free article] [PubMed] [Google Scholar]
- Hui LT, Husted SR, Myers CM, Ascher MS, Reisen WK, Kramer VL. Summary of St. Louis encephalitis and western equine encephalomyelitis virus activity in California, 1969−1997. Proc. Mosq. Vector Control Assoc. Calif. 1999;67:61–72. [Google Scholar]
- Igarashi A, Tanaka M, Morita K, Takasu T, Ahmed A, Ahmed A, Akram DS, Waqar MA. Detection of West Nile and Japanese encephalitis viral genome sequences in cerebrospinal fluid from acute encephalitis cases in Karachi, Pakistan. Microbiol. Immunol. 1994;38:827–830. doi: 10.1111/j.1348-0421.1994.tb01866.x. [DOI] [PubMed] [Google Scholar]
- Jamgaonkar AV, Yergolkar PN, Geevarghese G, Joshi GD, Joshi MV, Mishra AC. Serological evidence for Japanese encephalitis virus and West Nile virus infections in water frequenting and terrestrial wild birds in Kolar District, Karnataka State, India. A retrospective study. Acta Virol. 2003;47:185–188. [PubMed] [Google Scholar]
- Kilpatrick AM, Daszak P, Jones MJ, Marra PP, Kramer LD. Host heterogeneity dominates West Nile virus transmission. Proc. Biol. Sci. 2006;273:2327–2333. doi: 10.1098/rspb.2006.3575. [DOI] [PMC free article] [PubMed] [Google Scholar]
- Komar N. West Nile virus: epidemiology and ecology in North America. Adv. Virus Res. 2003;61:185–234. doi: 10.1016/s0065-3527(03)61005-5. [DOI] [PubMed] [Google Scholar]
- Komar N, Langevin S, Hinten S, Nemeth N, Edwards E, Hettler D, Davis B, Bowen R, Bunning M. Experimental infection of North American birds with the New York 1999 strain of West Nile virus. Emerg. Infect. Dis. 2003;9:311–322. doi: 10.3201/eid0903.020628. [DOI] [PMC free article] [PubMed] [Google Scholar]
- Kramer VL. California State mosquito-borne virus surveillance and response plan. California Department of Health Services. 2007 doi: 10.4269/ajtmh.2003.68.508. ( http://westnile.ca.gov/resources.php) [DOI] [PubMed]
- Ladeau SL, Kilpatrick AM, Marra PP. West Nile virus emergence and large-scale declines of North American bird populations. Nature (Lond.) 2007;447:710–713. doi: 10.1038/nature05829. [DOI] [PubMed] [Google Scholar]
- Lanciotti RS, Kerst AJ. Nucleic acid sequence-based amplification assays for rapid detection of West Nile and St. Louis encephalitis viruses. J. Clin. Microbiol. 2001;39:4506–4513. doi: 10.1128/JCM.39.12.4506-4513.2001. [DOI] [PMC free article] [PubMed] [Google Scholar]
- Lothrop HD, Tempelis CH, Reisen WK. Host selection by Culex tarsalis around the margin of the Salton Sea in the Coachella Valley of California. Proc. Mosq. Vector Control Assoc. Calif. 1997;65:28–29. [Google Scholar]
- Lothrop HD, Lothrop B, Palmer M, Wheeler SS, Gutierrez A, Gomsi DE, Reisen WK. Efficacy of pyrethrin and permethrin ground ULV applications for adult Culex control in rural and urban desert environments of the Coachella Valley of California. J. Am. Mosq. Control Assoc. 2007;20:190–207. doi: 10.2987/8756-971X(2007)23[190:EOPAPG]2.0.CO;2. [DOI] [PubMed] [Google Scholar]
- Lothrop HD, Lothrop B, Gomsi DE, Reisen WK. Impact of focal early season mosquito control on West Nile virus amplification in the Coachella Valley of California. Vector Borne and Zoonotic Dis. 2008 doi: 10.1089/vbz.2007.0238. (in press) [DOI] [PMC free article] [PubMed] [Google Scholar]
- Madon MB, Workman EB, Krone LJ, Magy HI. Occurrence of arboviruses in mosquitoes collected in Imperial and Riverside counties, California 1972. Bull. Soc. Vector Ecol. 1974;1:14–21. [Google Scholar]
- Mahmood F, Chiles RE, Fang Y, Barker CM, Reisen WK. Role of nestling mourning doves and house finches as amplifying hosts of St. Louis encephalitis virus. J. Med. Entomol. 2004;41:965–972. doi: 10.1603/0022-2585-41.5.965. [DOI] [PubMed] [Google Scholar]
- McCaughey K, Miles SQ, Woods L, Chiles RE, Hom A, Kramer VL, Jay-Russel M, Sun B, Reisen WK, Scott TW, et al. The California West Nile virus dead bird surveillance program. Proc. Mosq. Vector Control Assoc. Calif. 2003;71:38–43. [Google Scholar]
- Meylan MF, Work TH, Jozan M. Analysis of arbovirus isolations: Culex tarsalis and Culex quinquefasciatus collected in the Imperial Valley, 1967−1987. Proc. Calif. Mosq. Vector Control Assoc. 1989;57:23–27. [Google Scholar]
- Murray RA, Habel LA, Mackey KJ, Wallace HG, Peck BA, Mora SJ, Ginsberg MM, Emmons RW. Epidemiological aspects of the 1984 St. Louis encephalitis epidemic in southern California. Proc. Calif. Mosq. Vector Control Assoc. 1985;53:5–9. [Google Scholar]
- Newhouse VF, Chamberlain RW, Johnston JG, Jr., Sudia WD. Use of dry ice to increase mosquito catches of the CDC miniature light trap. Mosq. News. 1966;26:30–35. [Google Scholar]
- Reeves WC, Hammon WM. Epidemiology of the arthropod-borne viral encephalitides in Kern County, California, 1943−1952. Univ. Calif. Berkeley Public Health. 1962;4:1–257. [PubMed] [Google Scholar]
- Reisen WK, Reeves WC. Bionomics and ecology of Culex tarsalis and other potential mosquito vector species. In: Reeves WC, editor. Epidemiology and control of mosquito-borne arboviruses in California, 1943−1987. California Mosquito and Vector Control Association; Sacramento, CA: 1990. pp. 254–329. [Google Scholar]
- Reisen WK, Meyer RP, Tempelis CH, Spoehel JJ. Mosquito abundance and bionomics in residential communities in Orange and Los Angeles Counties, California. J. Med. Entomol. 1990;27:356–367. doi: 10.1093/jmedent/27.3.356. [DOI] [PubMed] [Google Scholar]
- Reisen WK, Hardy JL, Presser SB, Milby MM, Meyer RP, Durso SL, Wargo MJ, Gordon EW. Mosquito and arbovirus ecology in southeastern California, 1986−1990. J. Med. Entomol. 1992a;29:512–524. doi: 10.1093/jmedent/29.3.512. [DOI] [PubMed] [Google Scholar]
- Reisen WK, Meyer RP, Milby MM, Presser SB, Emmons RW, Hardy JL, Reeves WC. Ecological observations on the 1989 outbreak of St. Louis encephalitis virus in the southern San Joaquin Valley of California. J. Med. Entomol. 1992b;29:472–482. doi: 10.1093/jmedent/29.3.472. [DOI] [PubMed] [Google Scholar]
- Reisen WK, Lin J, Presser SB, Enge B, Hardy JL. Evaluation of new methods for sampling sentinel chickens for antibodies to WEE and SLE viruses. Proc. Calif. Mosq. Vector Control Assoc. 1993;61:33–36. [Google Scholar]
- Reisen WK, Presser SB, Lin J, Enge B, Hardy JL, Emmons RW. Viremia and serological responses in adult chickens infected with western equine encephalomyelitis and St. Louis encephalitis viruses. J. Am. Mosq. Control Assoc. 1994;10:549–555. [PubMed] [Google Scholar]
- Reisen WK, Hardy JL, Lothrop HD. Landscape ecology of arboviruses in southern California: patterns in the epizootic dissemination of western equine encephalomyelitis and St. Louis encephalitis viruses in Coachella Valley, 1991−1992. J. Med. Entomol. 1995a;32:267–275. doi: 10.1093/jmedent/32.3.267. [DOI] [PubMed] [Google Scholar]
- Reisen WK, Lothrop HD, Hardy JL. Bionomics of Culex tarsalis (Diptera: Culicidae) in relation to arbovirus transmission in southeastern California. J. Med. Entomol. 1995b;32:316–327. doi: 10.1093/jmedent/32.3.316. [DOI] [PubMed] [Google Scholar]
- Reisen WK, Lothrop HD, Presser SB, Milby MM, Hardy JL, Wargo WJ, Emmons RW. Landscape ecology of arboviruses in southern California: temporal and spatial patterns of vector and virus activity in Coachella Valley, 1990−1992. J. Med. Entomol. 1995c;32:255–266. doi: 10.1093/jmedent/32.3.255. [DOI] [PubMed] [Google Scholar]
- Reisen WK, Smith PT, Lothrop HD. Short term reproductive diapause by Culex tarsalis (Diptera: Culicidae) in the Coachella Valley of California. J. Med. Entomol. 1995d;32:654–662. doi: 10.1093/jmedent/32.5.654. [DOI] [PubMed] [Google Scholar]
- Reisen WK, Chiles RE, Lothrop HD, Presser SB, Hardy JL. Prevalence of antibodies to mosquito-borne encephalitis viruses in residents of the Coachella Valley. Am. J. Trop. Med. Hyg. 1996a;55:667–671. doi: 10.4269/ajtmh.1996.55.667. [DOI] [PubMed] [Google Scholar]
- Reisen WK, Hardy JL, Chiles RE, Kramer LD, Martinez VM, Presser SB. Ecology of mosquitoes and lack of arbovirus activity at Morro Bay, San Luis Obispo County, California. J. Am. Mosq. Control Assoc. 1996b;12:679–687. [PubMed] [Google Scholar]
- Reisen WK, Lundstrom JO, Scott TW, Eldridge BF, Chiles RE, Cusack R, Martinez VM, Lothrop HD, Gutierrez D, Wright S, Boyce K, Hill BR. Patterns of avian seroprevalence to western equine encephalomyelitis and St. Louis encephalitis viruses in California, USA. J. Med. Entomol. 2000;37:507–527. doi: 10.1603/0022-2585-37.4.507. [DOI] [PubMed] [Google Scholar]
- Reisen WK, Lothrop HD, Chiles RE, Cusack R, Green E-GN, Fang Y, Kensington M. Persistence and amplification of St. Louis encephalitis virus in the Coachella Valley of California, 2000−2001. J. Med. Entomol. 2002;39:793–805. doi: 10.1603/0022-2585-39.5.793. [DOI] [PubMed] [Google Scholar]
- Reisen WK, Chiles RE, Green EN, Fang Y, Mahmood F. Previous infection protects finches from re-infection with St. Louis encephalitis virus. J. Med. Entomol. 2003a;40:300–305. doi: 10.1603/0022-2585-40.3.300. [DOI] [PubMed] [Google Scholar]
- Reisen WK, Chiles RE, Martinez VM, Fang Y, Green EN. Experimental infection of California birds with western equine encephalomyelitis and St. Louis encephalitis viruses. J. Med. Entomol. 2003b;40:968–982. doi: 10.1603/0022-2585-40.6.968. [DOI] [PubMed] [Google Scholar]
- Reisen WK, Chiles RE, Martinez VM, Fang Y, Green EN. Encephalitis virus persistence in California birds: experimental infections in mourning doves (Zenaidura macroura). J. Med. Entomol. 2004a;3:462–466. doi: 10.1603/0022-2585-41.3.462. [DOI] [PubMed] [Google Scholar]
- Reisen WK, Lothrop HD, Chiles RE, Madon MB, Cossen C, Woods L, Husted S, Kramer VL, Edman JD. West Nile Virus in California. Emerg. Infect. Dis. 2004b;10:1369–1378. doi: 10.3201/eid1008.040077. [DOI] [PMC free article] [PubMed] [Google Scholar]
- Reisen WK, Fang Y, Martinez VM. Avian host and mosquito (Diptera: Culicidae) vector competence determine the efficiency of West Nile and St. Louis encephalitis virus transmission. J. Med. Entomol. 2005a;42:367–375. doi: 10.1093/jmedent/42.3.367. [DOI] [PubMed] [Google Scholar]
- Reisen WK, Wheeler SS, Yamamoto S, Fang Y, Garcia S. Nesting ardeid colonies are not a focus of elevated West Nile virus activity in southern California. Vector Borne Zoonotic Dis. 2005b;5:258–266. doi: 10.1089/vbz.2005.5.258. [DOI] [PubMed] [Google Scholar]
- Reisen WK, Barker CM, Carney R, Lothrop HD, Wheeler SS, Wilson JL, Madon MB, Takahashi R, Carroll B, Garcia S, et al. Role of corvids in epidemiology of West Nile virus in southern California. J. Med. Entomol. 2006a;43:356–367. doi: 10.1603/0022-2585(2006)043[0356:rocieo]2.0.co;2. [DOI] [PubMed] [Google Scholar]
- Reisen WK, Fang Y, Martinez VM. Effects of temperature on the transmission of West Nile virus by Culex tarsalis (Diptera: Culicidae). J. Med. Entomol. 2006b;43:309–317. doi: 10.1603/0022-2585(2006)043[0309:EOTOTT]2.0.CO;2. [DOI] [PubMed] [Google Scholar]
- Reisen WK, Martinez VM, Fang Y, Garcia S, Ashtari S, Wheeler SS, Carroll BD. Role of California (Callipepla californica) and Gambel's (Callipepla gambelii) quail in the ecology of mosquito-borne encephalitis viruses in California, USA. Vector Borne Zoonotic Dis. 2006c;6:248–260. doi: 10.1089/vbz.2006.6.248. [DOI] [PubMed] [Google Scholar]
- Russell RC. Arboviruses and their vectors in Australia: an update on the ecology and epidemiology of some mosquito-borne arboviruses. Rev. Med. Vet. Entomol. 1995;83:141–158. [Google Scholar]
- Steinlein DB, Husted S, Reisen WK, Kramer VL, Chiles RE, Glaser C, Cossen C, Tu E, Gilliam S, Hui LT, et al. Summary of mosquito-borne encephalitis virus surveillance in California: 1998−2002. Proc. Mosq. Vector Control Assoc. Calif. 2003;71:17–27. [Google Scholar]
- Tesh RB, Parsons R, Siirin M, Randle Y, Sargent C, Guzman H, Wuithiranyagool T, Higgs S, Vanlandingham DL, Bala AA, Haas K, Zerinque B. Year-round West Nile virus activity, Gulf Coast region, Texas and Louisiana. Emerg. Infect. Dis. 2004;10:1649–1652. doi: 10.3201/eid1009.040203. [DOI] [PMC free article] [PubMed] [Google Scholar]
- Tesh RB, Travasos da Rosa AP, Guzman H, Araujo TP, Xiao SY. Immunization with heterologous flaviviruses protective against fatal West Nile encephalitis. Emerg. Infect. Dis. 2002;8:245–251. doi: 10.3201/eid0803.010238. [DOI] [PMC free article] [PubMed] [Google Scholar]
- Wilson JL, Reisen WK, Madon MB. Three Years of West Nile virus in Greater Los Angeles County. Proc. Mosq. Vector Control Assoc. Calif. 2006;74:9–11. [Google Scholar]
- Work TH. On the Japanese B–West Nile virus complex or an arbovirus problem of six continents. Am. J. Trop. Med. Hyg. 1971;20:169–186. doi: 10.4269/ajtmh.1971.20.169. [DOI] [PubMed] [Google Scholar]
- Work TH, Jozan M, Wallace HG, Ryan P, Green G, Tietze N. Ecological evidence of St. Louis encephalitis virus transmission in southern California. Proc. Calif. Mosq. Vector Control Assoc. 1985;53:16–21. [Google Scholar]
- Workman EB, Madon MB, Emmons RW, Magy HI, Rohe DL, Krone LJ. Arbovirus and mosquito vector surveillance in coastal and irrigated desert areas of southern California 1972−73. Bull. Soc. Vector Ecol. 1976;3:27–40. [Google Scholar]