

Abstract
Visceral leishmaniasis (VL) caused by Leishmania chagasi is endemic to northeast Brazil. A positive delayed-type hypersensitivity skin test response (DTH+) is a marker for acquired resistance to disease, clusters in families, and may be genetically controlled. Twenty-three single nucleotide polymorphisms (SNPs) were genotyped in the cytokine 5q23.3-q31.1 region IRF1-IL5-IL13-IL4-IL9-LECT2-TGFBI in 102 families (323 DTH+; 190 DTH−; 123 VL individuals) from a VL endemic region in northeast Brazil. Data from 20 SNPs were analysed for association with DTH+/− status and VL using family-based, stepwise conditional logistic regression analysis. Independent associations were observed between the DTH+ phenotype and markers in separate linkage disequilibrium blocks in LECT2 (OR 2.25; P=0.005; 95% CI=1.28-3.97) and TGFBI (OR 1.94; P=0.003; 95% CI=1.24-3.03). VL child/parent trios gave no evidence of linkage and association, but the DTH− phenotype was associated with SNP rs2070874 at IL4 (OR 3.14; P=0.006; 95% CI=1.38-7.14), and SNP rs30740 between LECT2 and TGFBI (OR 3.00; P=0.042; 95% CI=1.04-8.65). These results indicate several genes in the immune response gene cluster at 5q23.3-q31.1 influence outcomes of L. chagasi infection in this region of Brazil.
Introduction
Leishmaniasis refers to a spectrum of diseases caused by protozoa belonging to the genus Leishmania. Distinct clinical forms of leishmaniasis are typically caused by different species of the parasite. The leishmaniases are caused by the Leishmania spp. protozoa, and parasites are acquired through the bite of infected sand flies in 88 endemic countries (Electronic Database Information 1). The clinical form of leishmaniasis that causes the most fatalities is visceral leishmaniasis (VL), a disease usually caused by members of the Leishmania donovani species complex, L. infantum or L. donovani in the Old World and L. infantum/chagasi in Latin America.1,2 However, the outcome of infection with these parasites is quite variable. In most individuals, infection with L. donovani complex parasites is asymptomatic, usually accompanied by a positive delayed type hypersensitivity (DTH) skin test response to leishmania antigen, called a Montenegro response. Progressive infection is associated with high titres of anti-leishmania antibodies and a negative DTH.3-5 Antibody titres are detected by ELISA using crude leishmania antigen or the recombinant antigen k39, which is an indicator of acute infection in some populations including Brazil.6-8 Clinically symptomatic VL is accompanied by hepatosplenomegaly, fevers, cachexia, and progressive suppression of cellular immunity, eventually leading to death if treatment does not intervene. Even in endemic regions where treatment is available, the death rate from VL is approximately 10%.2,4
Variability in human VL is explained in part by host factors that increase susceptibility, e.g. young age and nutritional status.2,9 Heterogeneity in parasite isolates contribute,10-12 but there is gathering evidence that host genetic factors also play a role in determining the outcome of human infection with parasites causing VL.13-15 A role for host genetics was first suggested by studies in mice showing that polymorphism at Slc11a1 (formerly Nramp1/Lsh/Ity/Bcg) determines innate macrophage-mediated resistance to infection with L. donovani 16 and L. infantum/chagasi17, whereas the murine major histocompatibility complex (MHC) controls acquired T cell-mediated recovery.17,18 Candidate gene studies in humans have confirmed a role for SLC11A1 in human VL,19,20 with variable evidence for the role for human HLA genes play in regulating clinical disease.21-25 Based upon human studies demonstrating increased circulating levels of the T helper 2 cytokine interleukin-4 (IL-4) in VL patients,26,27 candidate gene analysis has also demonstrated association between clinical VL and polymorphisms at IL4.28
Thus far, the emphasis in human genetic studies of VL has been on finding associations between genetic variants and clinical disease. Epidemiological studies in Brazil have show that a positive DTH response (DTH+) is a marker for developing acquired resistance to disease.4 DTH+ shows marked clustering in families,29 and appears to be under genetic control.30 In order to investigate genetic factors that might be associated with the DTH+ phenotype, we have been working in a site in northeast Brazil where the prevalence of VL in peri-urban areas has been high for the past two decades.31 Using this population we have been able to discern not only symptomatic individuals, but also asymptomatic DTH+ infected persons and individuals who remain DTH negative (DTH−) despite prolonged residence in a dwelling where there is demonstrated risk of L. chagasi infection. Here we report on a study of candidate genes on chromosome 5q23.3-q31.1, near the cluster of genes encoding type 2 cytokines, and their association with DTH+ and DTH− phenotypes in VL.
Methods
Study subjects and study procedures
Brazilian subjects with active VL were identified because they were admitted to one of three public hospitals in Natal, northeast Brazil. Transmission of VL is both focal and transient, and this allowed us to identify neighbourhoods with ongoing or recent transmission of L. chagasi infection. Clinical and epidemiological characteristics of an overlapping population from the region has been published previously.31 Hospitalized individuals were interviewed for their level of interest in the study, and the location of their houses determined. Subjects and their family members were later visited in their homes where informed consent was obtained. Families in the endemic neighbourhood without a VL case lived in houses adjacent to or near VL case families. These homes were less than 500 meters from a case family home.
Family members were interviewed for information on relationships, medical history, and current medical status. Consenting subjects were examined, blood was drawn, and a leishmania skin test (Montenegro) was administered. Blood was tested for leishmania serology and routine cell counts, and DNA was extracted from 10 ml of blood leukocytes as described previously.32 Skin test results were read 48-72 hours after test placement, at which time subjects were informed of test results and referred to the appropriate medical facility for any medical conditions found. The diagnosis of VL was confirmed by compatible clinical symptoms, response to glucantime therapy, and one of two parasitological tests. Either the parasite was visualized on Giemsa stain of a bone marrow aspirate, or the patient had positive serological response to leishmania antigens by ELISA. The antigen for ELISA was prepared from a lysate of whole Leishmania chagasi promastigotes, and/or from recombinant k39 kindly provided by Steven Reed, Ph.D., IDRI, Seattle, WA.6,33
Phenotype definitions
VL index cases identified through the hospitals were used to ascertain a total of 102 leishmaniasis (mixed for VL and DTH+, or neighbourhood DTH+ only families) pedigrees (156 nuclear families; Table 1). Phenotypes within families (Table 1) were defined as: VL, including historic cases or cases current at the time of study; DTH+, including individuals with a positive skin test reaction, defined as ≥5 mm of induration 48-72 hours after test placement; and DTH−, including individuals were negative for leishmania serology with a Montenegro skin test reaction <5 mm in size. DTH+ and DTH− subjects all had a negative history for VL or comparable illness. The DTH− category included subjects living in households for >3 years with a >40% infection rate but who had remained healthy and DTH−. As such, all DTH− individuals included in the genetic study were over 3 years of age. We hypothesize that such exposed individuals may clear the parasite through innate immune mechanisms before an adaptive immune response to parasite antigen develops. Positive serology for leishmania antigens usually indicates active infection. Although documented (Table 1), there were insufficient samples to permit meaningful analysis of antibody positive individuals as a separate phenotype for genetic analysis. The 102 pedigrees provided a total of 123 VL cases with 107 child/parent trios, 323 DTH+ individuals with 176 child/parent trios, and 190 DTH− individuals with 118 child/parent trios.
Table 1.
Distribution of study subjects by phenotype (VL, DTH+, AB+, DTH−) as defined in the text.
| (A) | ||||||
|---|---|---|---|---|---|---|
| N individuals with phenotypes | Total | |||||
| VL | DTH+ | AB+ | DTH− | Unknown | ||
| Individuals | 123 | 323 | 20 | 190 | 17 | 673 |
| Females | 46 | 169 | 11 | 110 | 11 | 347 |
| Males | 77 | 154 | 9 | 80 | 6 | 326 |
| (B) | |||
|---|---|---|---|
| VL phenotype |
DTH+ phenotype |
DTH− phenotype |
|
| Number of pedigrees | 82 | 93 | 68 |
| Number of nuclear families | 87 | 100 | 76 |
| Nuclear families: 1 sib with phenotype | 70 | 50 | 45 |
| Nuclear families: 2 sibs with phenotype | 17 | 35 | 21 |
| Nuclear families: 3 sibs with phenotype | 1 | 8 | 9 |
| Nuclear families: 4 sibs with phenotype | 0 | 4 | 1 |
| Nuclear families: 5 sibs with phenotype | 0 | 2 | 0 |
| Nuclear families: 6 sibs with phenotype | 0 | 1 | 0 |
| Total number with phenotype | 123 | 323 | 190 |
| Total number with phenotype in nuclear families |
107 | 176 | 118 |
All subjects were residents of neighborhoods outside or peripheral to Natal, Brazil. (A) provides details of the total number of individuals by phenotype included in the study. (B) shows the distribution of VL, DTH+ and DTH− phenotypes by nuclear family. A total of 102 pedigrees containing 156 nuclear families were studied. All subjects were residents of neighborhoods outside or peripheral to Natal, Brazil. (A) provides details of the total number of individuals by phenotype included in the study. (B) shows the distribution of VL, DTH+ and DTH− phenotypes by nuclear family. A total of 102 pedigrees containing 156 nuclear families were studied.
Ethical approvals
Approval for work with human subjects was obtained from the Ethical Research Committee at the Universidade Federal do Rio Grande do Norte, the Comissão Nacional de Ética em Pesquisa (CONEP), the University of Iowa, Johns Hopkins University, the University of Virginia and the National Human Genome Research Institute boards. The Brazilian university has FWA, and its Institutional Review Board is registered with the NIH.
Genotyping methods
Twenty-three single nucleotide polymorphisms (SNPs) were selected from chromosome 5q23.3-q31.1 on the basis of public domain information on allele frequencies, proximity to genes, and the known functional SNPs in IL4. HapMap data was not available at the time this study commenced. Taqman SNP Genotyping Assays were ordered from ABI using both pre-made and custom design assays [i.e., “Assays-on-Demand” or “Assays-By-Design”, Electronic Database Information 2 (see Supplementary Information)]. Taqman assays were performed using 40 ng of genomic DNA and analyzed using an ABI Prism 7000 Sequence Detection System and associated 7000 System SDS Software v.1.2 (ABI).
Statistical analyses
All SNP genotypes were checked with the program PEDCHECK34 to identify Mendelian inconsistencies. Allele frequencies were determined from unrelated individuals in these families using the computer program SPLINK.35 Deviation from Hardy Weinberg Equilibrium (HWE) was determined using a set of unrelated individuals from the families (parents and individuals married in). Tests for HWE were carried out within STATA™ 9.1 (Electronic Database Information 3) using the GenAssoc package (Electronic Database Information 4). Markers that were out of HWE were excluded from the analysis. Linkage disequilibrium (LD) between pairs of markers across chromosome 5q23.3-q31.1 was determined for the set of unrelated individuals using Hedrick's definition of Lewontin's D' statistic36 and r2.37 LD plots were generated using the default settings in Haploview38 available from the HapMap Project site (Electronic Database Information 5).
Power calculations for trios were performed using the method of Knapp.39 This provides an estimate of power for independent trios, which would be the case for trios in the families for a true functional variant, or something in complete LD with it.40 In this case, we determined statistical power on the basis of the number of full child/parent trios for each phenotype. For the DTH+ phenotype, the 176 child/parent trios had ≥82.6% power to detect an effect corresponding to an odds ratio = 2 (at p=0.01) for SNPs with variant allele frequencies of ≥0.2; but only ≤51.0% power for SNPs with variant allele frequencies ≤0.1. For the VL and DTH− phenotypes, ∼110 child/parent trios provided ≥56.4% power to detect a similar effect size for SNPs with variant allele frequencies of ≥0.2; and ≤31.4% power for SNPs with variant allele frequencies of ≤0.1. All SNPs used in the study had minor allele frequencies ≥0.2. Since not all markers studied fall into the category of functional markers, or markers in complete LD with a functional marker, robust tests were performed to take account of multiple trios within a pedigree in the association tests (cf. below).
Allelic association was determined using a family-based design in which sets of cases and ‘pseudo-sib’ controls are created where the cases comprise the genotypes of the “affected” offspring, and the ‘pseudo-sib’ controls are genotypes possible from the parental mating type.41 Odds ratios, 95% confidence intervals and P values were estimated using conditional logistic regression models employing a robust variance-covariance matrix to control for clustering of trios within a pedigree, and a Wald χ2 test to indicate overall significance for allelic associations. Correction for multiple testing was not performed on the analysis for individuals markers, as groups of these markers were in LD and therefore not independent of each other. Instead, a stepwise conditional logistic-regression procedure41 was used to determine which SNPs within and between candidate genes contribute independently to the observed associations. In the stepwise analysis, Wald χ2 tests were used to compare models in which the effect of adding a second locus is compared with a model where main effects at the primary locus only are included. Only pair-wise comparisons were made. A likelihood ratio test comparing the two models determined whether including the second locus adds independent main effects, or whether after inclusion of the first marker, the second marker no longer accounts for significant association. Robust case/pseudo-control statistical tests, which were used throughout to take account of familial clustering, were developed by Heather Cordell and David Clayton41 at the Cambridge Institute for Medical Research (available at Electronic Database Information 6) and were implemented within STATA™ 9.1.
Bioinformatics
Global alignment of genomic sequence for the region LECT2 to TGFBI from human, dog, cow, mouse and chicken was undertaken to locate evolutionarily conserved non-coding sequences (CNS) that might contain long-range regulatory elements and transcription factor binding sites. CNS are defined as regions of conserved sequence approaching or similar in magnitude to that observed at the known exons in the region under examination. Genomic sequence for the six organisms was exported in FASTA format from ENSEMBL (NCBI Build 36, Ensembl Genebuild August 2006, Database version 42.36d) and associated annotation exported in the form of a General Feature Format (GFF) file. The global alignment tool LAGAN was used to align genomic sequences using guide trees (((human dog) cow) mouse) and ((human mouse) chicken). SYNPLOT42 was used to visualize the annotated alignment. CNS were analyzed for promoter and enhancer elements using PROMO (Electronic Database Information 7), AliBaba v2.1 (Electronic Database Information 8) and Mat-Inspector (Electronic Database Information 9).
Results
Subject characteristics
The study group consisted of 688 subjects from 102 families (Table 1). All families included members that were infected with L. chagasi, documented either by a history of VL and/or a positive Montenegro reaction without a history of disease. Some subjects were reported in earlier studies.31,32 The Montenegro test is a highly sensitive measure of prior L. chagasi infection because of the low incidence of diseases with the potential to cross-react (e.g. Trypanosoma cruzi) and the fact that no other Leishmania species with autochthonous transmission have been detected in the vicinity of Natal. Thus, individuals with a positive Montenegro but no history of active disease were considered to have had asymptomatic L. chagasi infection. As outlined above, the individuals that defined the DTH− phenotype were those who had remained negative for the Montenegro skin test despite ≥3 years exposure in households with ≥40% infection rate.
SNP markers
Individuals from the 102 pedigrees were genotyped for 23 SNPs. Table 1 indicates the distribution of phenotypes in pedigrees, and nuclear families included in these pedigrees. Locations of SNPs in relation to genes in the region on chromosome 5q23.3-q31.1 are shown in figure 1, with the markers further defined in Table 2. One SNP (rs848) was eliminated from the analysis because it was not polymorphic in our population. Two SNP markers (rs31564 and rs2107506) that deviated from HWE were also excluded.
Figure 1.

Drawing of the chromosome 5q23.3-q31.1 region showing relative positions of genes and SNPs (not to scale). Boxes indicate the locations of genes including both exons and introns. Letters referring to SNPs (dotted vertical arrows; open dots are SNPs associated with the DTH− phenotype; grey-filled dots are SNPs associated with the DTH+ phenotype) are defined in Table 2. Distances between the start of the 5' UTR of IRF1 and end of the 3'UTR of IL4, the 5'UTR of SEC24 and 3'UTR of DCOL, and the 5'UTR of IL9 and 3'UTR of TGFBI are indicated with dotted horizontal arrows. Solid horizontal arrows indicate the direction of the coding region for selected genes. Brackets refer to markers in LD clusters (H to O; R to V) as defined by D' (see figure 2). Markers not shown on the figure were not analyzed statistically, either because there was only one allele or they were out of Hardy Weinberg Equilibrium. (See methods section for details.)
Table 2.
Details of genomic bp location, functional position relative to genes, allelic variants, and minor allele frequencies for the 18 SNPs at 5q23.3-q31.1 used in the association analyses.
| Gene | SNP | Location(bp) a | Functional Position |
Letter on Map b |
SNPc alleles |
Strand | Minor Allele Frequency |
|---|---|---|---|---|---|---|---|
| 5q23.3 | |||||||
| IRF1 |
131,846,679- 131,854,333 |
||||||
| rs2070727 | 131,848,174 | Intron 8 | A | T/G | − | 0.348 | |
| rs11242120 | 131,898,588 | Intergenic | C | T/C | + | 0.378 | |
| IL5 |
131,905,035- 131,907,113 |
||||||
| IL13 |
131,021,764- 132,024,700 |
||||||
| IL4 |
131,037,272- 132,046,267 |
||||||
| rs2070874 | 132,037,609 | 5′UTR | D | C/T | − | 0.34 | |
| 5q31.1 | |||||||
| IL9 |
135,255,834- 135,259,415 |
||||||
| rs31564 | 135,258,152 | Intron 3 | E | G/T | + | Not used | |
| LECT2 |
135,310,499- 135,318,622 |
||||||
| rs31530 | 135,310,529 | 3′ UTR | H | C/T | − | 0.394 | |
| rs31517 | 135,314,928 | Nonsynonymous exon 3 |
I | G/A | − | 0.398 | |
| rs248166 | 135,320,607 | Upstream | J | T/C | − | 0.211 | |
| rs248163 | 135,321,150 | Upstream | K | G/A | − | 0.17 | |
| rs248158 | 135,321,969 | Upstream | L | C/T | − | 0.378 | |
| rs2526146 | 135,327,750 | Intergenic | M | A/G | − | 0.422 | |
| rs2526152 | 135,340,932 | Intergenic | N | A/G | − | 0.446 | |
| rs30740 | 135,354,489 | Intergenic | O | A/G | − | 0.249 | |
| rs12520800 | 135,357,814 | Intergenic | P | T/G | + | 0.325 | |
| rs13157444 | 135,364,460 | Intergenic | Q | A/G | + | 0.443 | |
| rs4976360/ | 135,382,223 | Intergenic | R | T/A | + | 0.431 | |
| rs2282790 | 135,391,774 | Upstream | S | G/A | + | 0.36 | |
| TGFBI |
135,392,597- 135,427,406 |
||||||
| rs1054124 | 135,416,562 | Synonymous exon 8 |
T | G/A | + | 0.465 | |
| rs4669 | 135,420,325 | Synonymous exon 12 |
U | T/C | + | 0.41 | |
| rs7725447 | 135,434,433 | Intergenic | V | G/A | 0.406 |
NOTE.
Location on human chromosome 5 (ENSEMBL web site; NCBI Build 36, Ensembl Genebuild August 2006, Database version 42.36d)
Letter code refers to Fig. 1
Major over minor allele for this Brazilian population.
Allelic association
Results of the conditional logistic regression analysis to look for association between the 20 SNPs on chromosomes 5q23-q33 and either clinical VL, DTH+ or DTH− phenotypes are shown in Table 3. No significant associations were observed for clinical VL. This may reflect the limited power to detect association compared to the other two infection-related phenotypes. Six markers in two clusters (fig. 1) were significantly associated with the DTH+ phenotype; two markers were associated with the DTH− phenotype. There was no overlap in markers associated with DTH+ versus DTH− phenotypes.
Table 3.
Results of robust conditional logistic regression analysis to look for association between SNPs on chromosome 5q23.3-q31.1 and three leishmaniasis-related phenotypes (VL, DTH+ and DTH−).
| Label | SNP | Phenotype | Robust Allele- wise Global Test P-value |
Allele | Odds Ratio | 95% CI |
|---|---|---|---|---|---|---|
| D | rs2070874 | DTH+ | 0.382 | C | 1.24 | 0.77 - 2.01 |
| L | rs248158 | DTH+ | 0.005 | G | 2.25 | 1.28 - 3.97 |
| M | rs2526146 | DTH+ | 0.015 | A | 1.65 | 1.10 - 2.47 |
| N | rs2526152 | DTH+ | 0.015 | A | 1.53 | 1.08 - 2.16 |
| O | rs30740 | DTH+ | 0.139 | T | 1.47 | 0.89 - 2.45 |
| R | rs4976360 | DTH+ | 0.003 | T | 1.94 | 1.24 - 3.03 |
| T | rs1054124 | DTH+ | 0.013 | A | 1.91 | 1.15 - 3.18 |
| U | rs4669 | DTH+ | 0.029 | C | 1.69 | 1.06 - 2.71 |
| D | rs2070874 | DTH− | 0.006 | C | 3.14 | 1.38 - 7.14 |
| L | rs248158 | DTH− | 0.281 | G | 1.56 | 0.69 - 3.52 |
| M | rs2526146 | DTH− | 0.408 | A | 1.57 | 0.54 - 4.58 |
| N | rs2526152 | DTH− | 0.202 | A | 1.31 | 0.86 - 1.99 |
| O | rs30740 | DTH− | 0.042 | T | 3.00 | 1.04 - 8.65 |
| R | rs4976360 | DTH− | 0.722 | T | 0.87 | 0.39 - 1.91 |
| T | rs1054124 | DTH− | 0.536 | A | 1.25 | 0.62 - 2.53 |
| U | rs4669 | DTH− | 0.722 | C | 0.89 | 0.49 - 1.65 |
| D | rs2070874 | VL | 0.123 | C | 1.60 | 0.88 - 2.91 |
| L | rs248158 | VL | 0.869 | G | 1.05 | 0.60 - 1.82 |
| M | rs2526146 | VL | 0.881 | A | 1.04 | 0.63 - 1.70 |
| N | rs2526152 | VL | 1.000 | A | 1.00 | 0.64 - 1.55 |
| O | rs30740 | VL | 0.140 | T | 2.33 | 0.76 – 7.19 |
| R | rs4976360 | VL | 1.000 | T | 1.00 | 0.46 - 2.17 |
| T | rs1054124 | VL | 0.794 | A | 1.10 | 0.55 - 2.17 |
| U | rs4669 | VL | 0.874 | C | 0.96 | 0.55 - 1.65 |
Data are shown for 8 of the 18 SNPs analysed (see figure 1) that showed association with at least one phenotype. CI = confidence interval. Bold indicates a significant allele-wise association.
Linkage disequilibrium
Two major LD blocks, as defined by D' (fig. 2A) and r2 (fig. 2B), were observed for the 18 markers used to determine allelic association across 5q23.3-q31.3 in Brazil. These closely mimic LD blocks across this region generated using public domain HapMap-CEU data for Caucasians (data not shown). For the DTH+ associations, the three SNPs (rs248158, rs2526146, rs2526152; labeled L, M and N in fig. 1) that lie immediately upstream of LECT2 (fig. 1) were located in the first LD block, and were in strong LD with each other (D'=1; r2>0.82) but not with the other 3 DTH+ associated SNPs (rs4976360, rs1054124, rs4669; labeled R, T and U in fig. 1) that lie immediately upstream or within TGFBI. Conversely, the 3 SNPs at TGFBI (rs4976360, rs1054124, rs4669; labeled R, T and U in fig. 1) were located in the second LD block and were in strong LD with each other as defined by D' (D'=0.76-0.91), but with reduced r2 between marker rs4976360 (R) upstream of TGFBI and the two SNPs (rs1054124, rs4669; T and U) within TGFBI (r2=0.20-0.21). For the DTH− associations, SNP rs2070874 (D) lies within IL4 (3.3 Mb proximal to the start of the first LD block), and was not in LD with any other genotyped SNP across the region. Note that SNP rs30740 (labeled O) was located in LD block 1 as defined by D' (fig. 2A) but not by r2 (fig. 2B).
Figure 2.
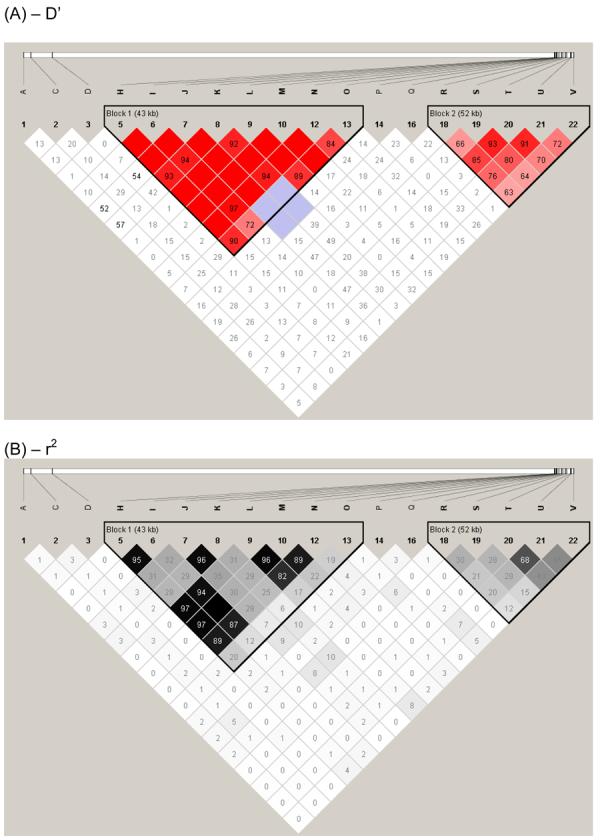
LD plot generated using the default settings in Haploview available from the HapMap Project site (http://www.hapmap.org/). LD between pairs of markers across chromosome 17q11.1-q22 was determined within Haploview using (A) D' or (B) r2 statistics. LD values between markers are indicated at the intercept of the two markers on the matrix. Empty boxes indicate that the LD value is 1. Intensity of colour on the red/pink or black/grey scale indicates the degree of confidence in the LD value. Two main haplotype blocks outlined within the black triangles lie within this region of 5q23.3-q31.1: rs31530 (H) -rs30740 (O) encompassing LECT2; and rs4976360 (R) - rs7725447 (V) encompassing TGFBI. All SNPs used had minor allele frequencies >0.1 (see table 2).
Stepwise conditional logistic regression analysis
Stepwise conditional logistic regression analysis was undertaken to determine, in particular, whether SNPs located within and between the two LD blocks in this genomic region exerted independent main effects on the risk of having the DTH+ phenotype. Stepwise analysis within block 1 indicated that none of the 3 markers (L, M and N) showed significant independent main effects (Table 4), suggesting that they are all in strong LD (fig. 2) with a causal variant in this LD block. Stepwise analysis of SNPs within block 2 indicates that rs4976360 (R) adds significantly to rs4669 (U), but U does not add to R (Table 4). The most likely explanation for this is that R, or a variant in strong LD with R, is the causal variant. This is supported by the observations: (1) that R is the locus with the more significant single-SNP association (table 3); and (2) that once R is included in the model, U was no longer required. In contrast, when U is put into the model first, R was still required to achieve significance, i.e. U alone does not explain all of the association with DTH+ in this LD block, and therefore U is not likely to be the causal locus. SNP rs1054124 (T) also does not add significantly to R (table 4), suggesting that in block 2, locus R is sufficient to explain all the statistical association with DTH+.
Table 4.
Results of robust stepwise conditional logistic regression analysis to look for independent associations between SNPs on chromosome 5q23.3-q31.1 and two leishmaniasis-related phenotypes (DTH+ and DTH−).
| NULL MODEL | ALTERNATIVE MODEL | Na | Wald χ2 | df | P-valueb |
|---|---|---|---|---|---|
| DTH+ phenotype – within LD blocks | |||||
| LD Block 1 SNPs | Adding Block 1 SNP to Block 1 | ||||
| (L) rs248158 | (L+M) | 182 | 0.00 | 1 | 0.985 |
| (L) rs248158 | (L+N) | 212 | 0.03 | 1 | 0.863 |
| (M) rs2526146 | (M+L) | 182 | 2.36 | 1 | 0.125 |
| (M) rs2526146 | (M+N) | 220 | 3.13 | 1 | 0.077 |
| (N) rs2526152 | (N+L) | 212 | 2.80 | 1 | 0.094 |
| (N) rs2526152 | (N+M) | 220 | 0.06 | 1 | 0.811 |
| LD Block 2 | Adding Block 2 SNP to Block 2 | ||||
| (R) rs4976360 | (R+T) | 154 | 2.07 | 1 | 0.150 |
| (R) rs4976360 | (R+U) | 192 | 1.99 | 1 | 0.160 |
| (T) rs1054124 | (T+R) | 154 | 2.63 | 1 | 0.105 |
| (T) rs1054124 | (T+U) | 180 | 0.35 | 1 | 0.554 |
| (U) rs4669 | (U+R) | 192 | 4.60 | 1 | 0.032 |
| (U) rs4669 | (U+T) | 180 | 1.60 | 1 | 0.206 |
| DTH+ phenotype – between LD blocks | |||||
| LD Block 1 SNPs | Adding Block 2 SNP to Block 1 | ||||
| (L) rs248158 | (L+R) | 176 | 9.93 | 1 | 0.002 |
| (L) rs248158 | (L+T) | 152 | 5.12 | 1 | 0.024 |
| (L) rs248158 | (L+U) | 180 | 10.02 | 1 | 0.002 |
| (M) rs2526146 | (M+R) | 180 | 9.24 | 1 | 0.002 |
| (M) rs2526146 | (M+T) | 158 | 7.11 | 1 | 0.008 |
| (M) rs2526146 | (M+U) | 202 | 4.54 | 1 | 0.033 |
| (N) rs2526152 | (N+R) | 188 | 4.39 | 1 | 0.036 |
| (N) rs2526152 | (N+T) | 178 | 7.78 | 1 | 0.005 |
| (N) rs2526152 | (N+U) | 214 | 4.71 | 1 | 0.030 |
| LD Block 2 SNPs | Adding Block 1 SNP to Block 2 | ||||
| (R) rs4976360 | (R+L) | 176 | 6.23 | 1 | 0.013 |
| (R) rs4976360 | (R+M) | 180 | 9.20 | 1 | 0.002 |
| (R) rs4976360 | (R+N) | 188 | 1.21 | 1 | 0.272 |
| (T) rs1054124 | (T+L) | 152 | 8.33 | 1 | 0.004 |
| (T) rs1054124 | (T+M) | 158 | 12.06 | 1 | 0.001 |
| (T) rs1054124 | (T+N) | 178 | 4.28 | 1 | 0.039 |
| (U) rs4669 | (U+L) | 180 | 11.51 | 1 | 0.001 |
| (U) rs4669 | (U+M) | 202 | 7.95 | 1 | 0.005 |
| (U) rs4669 | (U+N) | 214 | 6.60 | 1 | 0.010 |
| DTH− phenotype | |||||
| (D) rs2070874 | (D+O) | 116 | 2.80 | 1 | 0.095 |
| (O) rs30740 | (O+D) | 116 | 3.61 | 1 | 0.057 |
N = number of observations in the conditional logistic regression stepwise comparison based on the number of cases and ‘pseudo-sib’ controls from trios fully genotyped for both markers being compared.
Bold indicates significant independent effects for the SNP when added to the alternative model.
Strikingly, all of the markers in LD block 1 add significant independent effects to all of the markers in block 2, and vice versa (Table 4). Together with the evidence for two distinct LD blocks in this population (fig. 2), this stepwise analysis strongly supports the presence of two separate genes controlling the DTH+ phenotype across this region of chromosome 5.
The data also provide evidence of association for the single SNP in IL4 (rs2070874) influencing the DTH− phenotype, plus borderline evidence for SNP rs30740 (labeled O) between LECT2 and TGFBI (see Table 3). However, evidence for any independent effects of either of these two SNPs given the other was only marginally significant when stepwise logistic models were examined on the DTH− phenotype (Table 4).
Bioinformatic analysis
SNPs L, M and N [rs248158, rs2526146 and rs2526152, respectively] in LD block 1 lie in the intergenic region upstream of the LECT2 gene (fig. 3). Similarly, SNP rs4976360 (R) that appears to absorb all of the association within LD block 2, lies upstream of TGFBI. LECT2 and TGFBI are encoded on opposite strands. Hence, all of these SNPs lie within potential upstream regulatory regions of these two genes. Bioinformatic analysis was undertaken to determine whether any of these SNPs lie within CNS that could represent potential regulatory elements. Figure 3 displays the multiple alignment generated by LAGAN as viewed using SYNPLOT, the SNP positions, and exons encoding LECT2 and TGFBI. Also indicated are regions of CNS in between LECT2 and TGFBI for the 4 mammalian species human, dog, cow and mouse. Although GENSCAN predictions in ENSEMBL have annotated additional potential coding sequences across this region (green blocks, fig. 3), none of these were supported by RNA or expressed sequence tag (EST) data, and none were conserved across all mammalian species (fig. 3) or with chicken (data not shown). Hence, it is unlikely that further functional genes occur within this region that could account for the associations observed in our analysis of the DTH+ or DTH− phenotypes.
Figure 3.
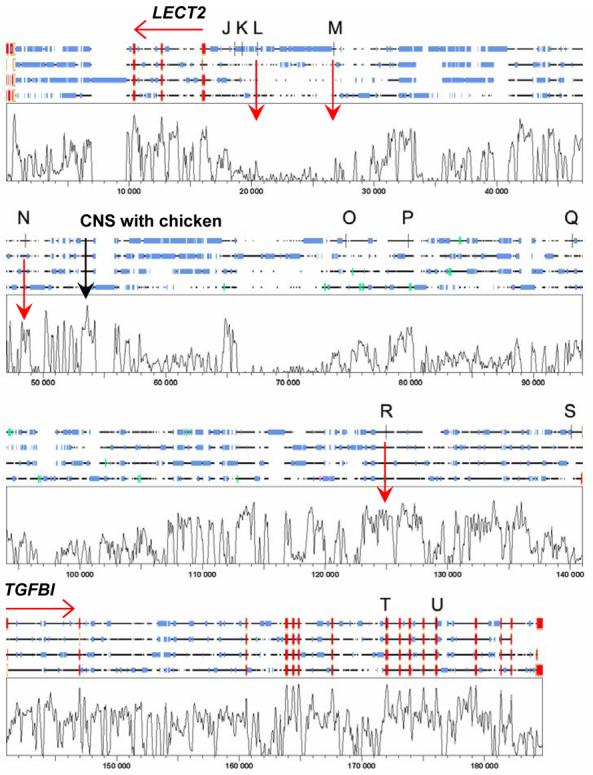
Shows the SYNPLOT output for the multiple alignment of (top to bottom) human, dog, cow and mouse sequences carried out across the region LECT2 to TGFBI on chromosome 5q31.1 using LAGAN. On the 4-species alignments red boxes define exons at the two genes, blue boxes indicate repetitive sequence, green boxes show GENSCAN auto-annotated putative exons, vertical black bars show the positions of SNPs (J to U, see table 2) used in this study. The plot shows degree of conservation of sequence across all 4 species, on a vertical scale 0-100%. CNS are defined as regions of conserved sequence that are approaching or similar in magnitude to that observed at the known exons for the two genes. Examples of potential regions of CNS of interest are indicated by vertical red arrows, including the single CNS showing high conservation between these mammalian species and chicken (data not shown).
SNPs rs248158 (L) and rs2526146 (M) do not themselves fall within regions of strong CNS (fig. 2), but a number of functionally relevant transcription factor binding sites are gained or lost with alternative variants at these two sites (Table 5), indicating that they could be functional. Of further interest are several peaks of strong CNS between SNPs rs2526146 (M) and rs2526152 (N). N itself lies in a CNS, and functionally relevant transcription factor binding sites are predicted to be present for the DTH+ associated allele A but not for alternative G allele. One peak immediately distal to rs2526152 (N) in particular, was the only region highly conserved when mammalian and chicken alignments were made (peak labeled in fig. 3; chicken data not shown). These CNS could contain elements regulating LECT2 expression that may contain important functional polymorphic variants.
Table 5.
Analysis of putative transcription factor binding sites lost or gained by carriage of alternative alleles at SNPs in the upstream regions of LECT2 and TGFBI that show allelic association with the DTH+ phenotype.
| SNP | Allele | TFBS | Description | Tool |
|---|---|---|---|---|
| rs248158_L | G | CEBPA C/EBPα |
CCAAT enhancer binding protein, alpha; myeloid TF crucial for granulopoiesis | AliBaba |
| rs2526146_M | G | CEBPB C/EBPβ |
NF-IL6, nuclear factor triggered by interleukin 6 | PROMO |
| rs2526146_M | G | c-Jun | Component of AP1 TF | PROMO |
| rs2526146_M | G | LXRE | Highly conserved DR1 element selected by LXRbeta/RXR heterodimers | MatInspector |
| rs2526146_M | G | LEF1 | Lymphoid enhancer-binding factor-1 expressed in pre-B and T cells, involved in the Wnt signal transduction pathway | MatInspector |
| rs2526152_N | A | EVI1 | Ecotropic viral integration site 1 encoded factor, amino-terminal zinc finger domain; myeloid TF | MatInspector |
| rs2526152_N | A | YY1 | Yin and Yang 1 ubiquitous TF | MatInspector |
| rs2526152_N | A | SMARCA3 | SWI/SNF related, matrix associated, actin dependent regulator of chromatin, subfamily a, member 3 | MatInspector |
| rs4976360_R | T | HSF | Heat shock TF | AliBaba |
| rs4976360_R | T | E2F | Critical determinant of G1/S-phase transition during the mammalian cell cycle | MatInspector |
| rs4976360_R | A | CEBPA C/EBPα |
CCAAT enhancer binding protein, alpha; myeloid TF crucial for granulopoiesis | AliBaba |
| rs4976360_R | A | STAT3 | TF for acute phase response gene | MatInspector |
Under allele, bold indicates the DTH+ associated allele, normal type indicates the allele not associated with the DTH response. Bioinformatic analysis demonstrated that the transcription factor binding site (TFBS) was only present with the allele indicated, and was lost with the alternative allele at each SNP shown. TF = transcription factor.
The region upstream of TGFBI including SNP rs4976360 (R) was also analysed for CNS and transcription factor binding sites. SNP rs4976360 (R) itself lies within a region of strong CNS with the two alleles at this SNP also showing association with gain or loss of binding sites (Table 5) for functionally relevant transcription factors. Loss or gain of transcription factors with marker R SNP alleles are delineated in Table 5.
Discussion
Previous studies have highlighted the region of chromosome 5q23.3-q31.1 as containing a cluster of immune response genes important in regulating type 1 and type 2 immune responses, and controlling susceptibility to parasitic diseases.28,43,44 Consistent with these observations, we demonstrate here that multiple genes across this region are associated with different phenotypic manifestations of L. chagasi infection in northeast Brazil. In a previous study of clinical VL in Sudan, associations were observed with polymorphisms at IL4 but not IL9.28 Although we could not replicate this finding for the clinical VL phenotype in northeast Brazil, possibly due to small sample sizes and limited power, we did find evidence of allelic association between IL4 (OR 3.14; P=0.006; 95% CI 1.38-7.14) and DTH− phenotype in individuals who were negative for the Leishmania-specific Montenegro skin test response despite an extended period (> 3 years) of exposure to L. chagasi. We hypothesize that this group of individuals may have innate immunity leading to early elimination of Leishmania parasites before an acquired T cell-mediated immune response can be induced, at least as measured by the DTH response. Early studies in mice suggested there is rapid IL-4 production in response to Leishmania major infection, possibly due to priming by microbial antigens from intestinal flora, and this may drive the acquired T cell response down a type 2 pathway.45 In humans, innate immunity cytokine profiles, including an increase in IL-4 positive neutrophils and natural killer cells, were associated with early active disease.46 We hypothesize that the DTH− phenotype in Brazil may represent innately low IL-4 producers who are resistant to developing clinical VL, and could represent the corollary of associations observed earlier in Sudan28 where early high IL-4 production may predict onset of clinical disease. A larger sample for both exposed DTH− and VL phenotypes in Brazil will be required to validate these observations.
The DTH+ phenotype has been used in previous studies in Brazil as a measure of infection with L. chagasi. Epidemiological data on Montenegro skin test data in a sample of 502 individuals from 94 families from Jacobina, State of Bahia, Brazil, were analyzed using complex segregation analysis. The results provide evidence for a major gene controlling infection, as determined by a DTH+ phenotype, with a common allele frequency under a recessive (or additive) single gene model (approximately 0.45).30 These results are important, as a DTH+ phenotype is not only a measure of acquired resistance to natural infection,4 but is also the only correlate to date of protection in human vaccine trials.12,47-51 Indeed, the only group of vaccinees in any vaccine trials undertaken to date that showed measurable vaccine-induced protection were those where a DTH skin-test response also converted following vaccination. Furthermore, protection observed in unvaccinated control groups also occurred only among individuals who skin-test converted due to natural exposure during the vaccine trials. Hence, a genetic component regulating ability to acquire resistance to Leishmania parasites has important implications both for natural infection and ability to respond to vaccination. Histologically, the DTH reactions among vaccinated individuals are indistinguishable from those with naturally acquired infections.52 Understanding the mechanisms that determine acquisition of a DTH+ phenotype is important in understanding resistance to leishmaniasis.
Although a clear relationship exists between acquisition of a DTH+ phenotype and measurement of type 1 (IFN-γ) cytokines following re-stimulation of whole blood or peripheral blood mononuclear cells with either leishmanial53 or mycobacterial54,55 antigen in vitro, association with type 2 (IL-4,5,9,10,13) cytokines has not been documented. In concordance with these observations, we found no evidence for an association between the DTH+ phenotype and the type 2 cytokine gene IL4 at 5q23.3. We did not saturate this region with haplotype-tagging SNPs, but our data failed to provide any evidence of association using SNPs at IRF1 and IL5 which lie proximal to IL4. IL13 lies immediately adjacent to, and is in strong LD with, IL4. Hence, it seems unlikely that genes in this region (fig. 1) contribute to the DTH+ phenotype. Instead, we found strong evidence for independent associations between the DTH+ phenotype and SNPs in two strong LD blocks located around the genes LECT2 and TGFBI. We have not formally ruled out IL9, which lies proximal to and hence downstream of LECT2, as a candidate gene in the region. However, there is no evidence from any of the populations analyzed in the HapMap (Electronic Database Information 5) that SNPs at LECT2 tag haplotypes that extend to IL9.
LECT2 encodes leukocyte cell-derived chemotaxin 2, which is chemotactic for neutrophils.56 It shows strong expression in foetal and adult liver,56 but is also generally expressed in vascular, endothelial and smooth muscle cells, adipocytes, cerebral nerve cells, apical squamous epithelia, parathyroid cells, sweat and sebaceous glandular epithelia, Hassall bodies and some mononuclear cells in immunohematopoietic tissue.57 Further research is required to determine whether LECT2 is expressed at the site of injection of the Montenegro skin test antigen, and whether this contributes to chemotactic activity that brings immune cells to the site.52 An early influx of neutrophils has been demonstrated at the site of cutaneous injection of L. donovani promastigotes into hamsters.58 Primer extension analysis shows that several transcription initiation sites occur within 70-230 nucleotides upstream of the translation initiation codon.59 Several transcriptional control sequences relevant to the liver-specific expression have also been identified at the 5′ untranslated region of the human LECT2 gene.59 In our study, there were no associations observed for SNPs located within the LECT2 gene with the DTH+ phenotype, but with SNPs found in the region immediately upstream, i.e. distal to LECT2 on 5q31.1. Bioinformatic analysis demonstrated that a number of transcription factor binding sites are gained or lost in the presence of alternative alleles at these SNPs, including CEBPA that is crucial for normal granulopoiesis, and LEF1 which is active in skin and is known to directly bind to, and regulate, CEBPA to control neutropenia.60 Similarly, LXR transcription factors for which binding sites were lost or gained for SNPs associated with the DTH+ phenotype are known61 regulators of macrophage inflammatory mediators such as inducible nitric oxide synthase, cyclooxygenase-2, and interleukin-6 gene expression that are all relevant to the DTH+ phenotype. LXR agonists reduce inflammation in a model of contact dermatitis.61 Further work will be required to determine whether these in silico leads to functional variants in the 5' region of LECT2 contribute to the association with the DTH+ phenotype that we have observed here.
Associations with the DTH+ phenotype observed for SNPs upstream of TGFBI and intragenic SNPs, were independent of those observed with markers in LECT2. TGFBI encodes the protein keratoepithelin which is up-regulated by transforming growth factor beta (TGF-β), is expressed in many tissues including the eye, and is mutated in several different types of corneal dystrophies.62 This protein contains an N-terminal signal peptide and a C-terminal Arg-Gly-Asp (RGD) motif similar to other adhesion proteins. The RDG motif is found in many extracellular matrix proteins that modulate cell adhesion and migration, and TGFBI has been shown to inhibit cell attachment in vitro and suppress growth of CHO cells in nude mice.63 It is possible that TGFBI expressed in skin epithelial cells could modulate the DTH phenotype. Other candidates are SMAD5 and its antisense transcript DAMS, located ∼100 kb distal to TGFBI on chromosome 5q31.1. SMAD5 plays a critical role in the signalling pathway by which TGF-β inhibits cell proliferation, and there is some evidence from the HapMap (Electronic Database Information 5; data not shown) for long range LD between TGFBI and DAMS/SMAD5 in Caucasians. Nevertheless, our own data indicated independent associations with SNPs both upstream of, and within, the TGFBI gene. Similar to LECT2, functionally relevant transcription factor binding sites are lost or gained with alternative alleles at the 5' SNP associated with the DTH+ phenotype, including CEPBA discussed above and STAT3 which is an important regulator of acute phase responses.
In summary, this study provides evidence that polymorphism at IL4 may contribute to innate immunity to L. chagasi infection in northeast Brazil. In addition, we have found evidence that genes not previously associated with immune response, LECT2 and TGFBI, are associated with ability to mount an acquired immune response to L. chagasi infection as measured by the Montenegro or DTH+ phenotype. These data therefore provide novel insight into mechanisms of resistance to parasite infection. Further analysis of the role of these genes in determining ability to mount a DTH+ response has important implications not only for our understanding of acquired resistance to natural infection, but in understanding the immune mechanisms required to mount a protective immune response to vaccination.
Supplementary Material
Acknowledgements
This research was supported by National Institutes of Health grants AI048822 (MEW), AI45540 (MEW), NIH TMRC grant AI30639 (SMBJ,), Conselho Nacional de Desenvolvimento Científico e Tecnológico (SMBJ), Merit Review and Gulf War grants from the Department of Veterans' Affairs (MEW), The Wellcome Trust (JMB and HJC) and in part by the Intramural Research Program of the National Human Genome Research Institute, National Institutes of Health.
Footnotes
Electronic database information
1. http://www.who.int/tdr/diseases/leish/diseaseinfo.htm
4 http://www-gene.cimr.cam.ac.uk/clayton/software/stata/
6 http://www-gene.cimr.cam.ac.uk/clayton/software/
7 http://alggen.lsi.upc.es/cgi-bin/promo_v3/promo/promoinit.cgi?dirDB=TF_8.3
9 http://www.genomatix.de/cgi-bin/matinspector/matinspector.pl)
REFERENCES
- 1.Wilson ME, Jeronimo SM, Pearson RD. Immunopathogenesis of infection with the visceralizing Leishmania species. Microb Pathog. 2005;38:147–160. doi: 10.1016/j.micpath.2004.11.002. [DOI] [PubMed] [Google Scholar]
- 2.Pearson RD, Sousa AQ. Clinical spectrum of Leishmaniasis. Clin Infect Dis. 1996;22:1–13. doi: 10.1093/clinids/22.1.1. [DOI] [PubMed] [Google Scholar]
- 3.Sundar S, Rosenkaimer F, Murray HW. Successful treatment of refractory visceral leishmaniasis in India using antimony plus interferon-gamma. J Infect Dis. 1994;170:659–662. doi: 10.1093/infdis/170.3.659. [DOI] [PubMed] [Google Scholar]
- 4.Jeronimo SM, Teixeira MJ, Sousa A, Thielking P, Pearson RD, Evans TG. Natural history of Leishmania (Leishmania) chagasi infection in Northeastern Brazil: long-term follow-up. Clin Infect Dis. 2000;30:608–609. doi: 10.1086/313697. [DOI] [PubMed] [Google Scholar]
- 5.Costa CH, Stewart JM, Gomes RB, Garcez LM, Ramos PK, Bozza M, et al. Asymptomatic human carriers of Leishmania chagasi. Am J Trop Med Hyg. 2002;66:334–337. doi: 10.4269/ajtmh.2002.66.334. [DOI] [PubMed] [Google Scholar]
- 6.Braz RF, Nascimento ET, Martins DR, Wilson ME, Pearson RD, Reed SG, et al. The sensitivity and specificity of Leishmania chagasi recombinant K39 antigen in the diagnosis of American visceral leishmaniasis and in differentiating active from subclinical infection. Am J Trop Med Hyg. 2002;67:344–348. doi: 10.4269/ajtmh.2002.67.344. [DOI] [PubMed] [Google Scholar]
- 7.Badaro R, Benson D, Eulalio MC, Freire M, Cunha S, Netto EM, et al. rK39: a cloned antigen of Leishmania chagasi that predicts active visceral leishmaniasis. J Infect Dis. 1996;173:758–761. doi: 10.1093/infdis/173.3.758. [DOI] [PubMed] [Google Scholar]
- 8.Zijlstra EE, Daifalla NS, Kager PA, Khalil EA, El-Hassan AM, Reed SG, et al. rK39 enzyme-linked immunosorbent assay for diagnosis of Leishmania donovani infection. Clin Diagn Lab Immunol. 1998;5:717–720. doi: 10.1128/cdli.5.5.717-720.1998. [DOI] [PMC free article] [PubMed] [Google Scholar]
- 9.Harrison LH, Naidu TG, Drew JS, de Alencar JE, Pearson RD. Reciprocal relationships between undernutrition and the parasitic disease visceral leishmaniasis. Rev Infect Dis. 1986;8:447–453. doi: 10.1093/clinids/8.3.447. [DOI] [PubMed] [Google Scholar]
- 10.El-Safi S, Kheir MM, Bucheton B, Argiro L, Abel L, Dereure J, et al. Genes and environment in susceptibility to visceral leishmaniasis. C R Biol. 2006;329:863–870. doi: 10.1016/j.crvi.2006.07.007. [DOI] [PubMed] [Google Scholar]
- 11.el Tai NO, Osman OF, el Fari M, Presber W, Schonian G. Genetic heterogeneity of ribosomal internal transcribed spacer in clinical samples of Leishmania donovani spotted on filter paper as revealed by single-strand conformation polymorphisms and sequencing. Trans R Soc Trop Med Hyg. 2000;94:575–579. doi: 10.1016/s0035-9203(00)90093-2. [DOI] [PubMed] [Google Scholar]
- 12.Dey A, Singh S. Genetic heterogeneity among visceral and post-Kala-Azar dermal leishmaniasis strains from eastern India. Infect Genet Evol. 2006 doi: 10.1016/j.meegid.2006.09.001. [DOI] [PubMed] [Google Scholar]
- 13.Bucheton B, Kheir MM, El-Safi SH, Hammad A, Mergani A, Mary C, et al. The interplay between environmental and host factors during an outbreak of visceral leishmaniasis in eastern Sudan. Microbes Infect. 2002;4:1449–1457. doi: 10.1016/s1286-4579(02)00027-8. [DOI] [PubMed] [Google Scholar]
- 14.Peacock CS, Collins A, Shaw MA, Silveira F, Costa J, Coste CH, et al. Genetic epidemiology of visceral leishmaniasis in northeastern Brazil. Genet Epidemiol. 2001;20:383–396. doi: 10.1002/gepi.8. [DOI] [PubMed] [Google Scholar]
- 15.Ibrahim ME, Lambson B, Yousif AO, Deifalla NS, Alnaiem DA, Ismail A, et al. Kalaazar in a high transmission focus: an ethnic and geographic dimension. Am J Trop Med Hyg. 1999;61:941–944. doi: 10.4269/ajtmh.1999.61.941. [DOI] [PubMed] [Google Scholar]
- 16.Bradley DJ. Genetic control of natural resistance to Leishmania donovani. Nature. 1974;250:353–354. doi: 10.1038/250353a0. [DOI] [PubMed] [Google Scholar]
- 17.Leclercq V, Lebastard M, Belkaid Y, Louis J, Milon G. The outcome of the parasitic process initiated by Leishmania infantum in laboratory mice: a tissue-dependent pattern controlled by the Lsh and MHC loci. J Immunol. 1996;157:4537–4545. [PubMed] [Google Scholar]
- 18.Blackwell J, Freeman J, Bradley D. Influence of H-2 complex on acquired resistance to Leishmania donovani infection in mice. Nature. 1980;283:72–74. doi: 10.1038/283072a0. [DOI] [PubMed] [Google Scholar]
- 19.Bucheton B, Abel L, Kheir MM, Mirgani A, El-Safi SH, Chevillard C, et al. Genetic control of visceral leishmaniasis in a Sudanese population: candidate gene testing indicates a linkage to the NRAMP1 region. Genes Immun. 2003;4:104–109. doi: 10.1038/sj.gene.6363927. [DOI] [PubMed] [Google Scholar]
- 20.Mohamed HS, Ibrahim ME, Miller EN, White JK, Cordell HJ, Howson JMM, et al. SLC11A1 (formerly NRAMP1) and susceptibility to visceral leishmaniasis in The Sudan. Eur J Hum Genet. 2004;12:66–74. doi: 10.1038/sj.ejhg.5201089. [DOI] [PubMed] [Google Scholar]
- 21.Peacock CS, Sanjeevi CB, Shaw MA, Collins A, Campbell RD, March R, et al. Genetic analysis of multicase families of visceral leishmaniasis in northeastern Brazil: no major role for class II or class III regions of HLA. Genes Immun. 2002;3:350–358. doi: 10.1038/sj.gene.6363852. [DOI] [PubMed] [Google Scholar]
- 22.Amendoiera R, Guilherme L, Martin M, Messias L, Cabello P, Krieger H, et al. HLA and visceral leishmaniasis in families of endemic area in northeast Brazil. Mem I Oswaldo Cruz. 1988;83:119. [Google Scholar]
- 23.Faghiri Z, Tabei SZ, Taheri F. Study of the association of HLA class I antigens with kala-azar. Hum Hered. 1995;45:258–261. doi: 10.1159/000154309. [DOI] [PubMed] [Google Scholar]
- 24.Meddeb-Garnaoui A, Gritli S, Garbouj S, Ben Fadhel M, El Kares R, Mansour L, et al. Association analysis of HLA-class II and class III gene polymorphisms in the susceptibility to mediterranean visceral leishmaniasis. Hum Immunol. 2001;62:509–517. doi: 10.1016/s0198-8859(01)00237-3. [DOI] [PubMed] [Google Scholar]
- 25.Singh N, Sundar S, Williams F, Curran MD, Rastogi A, Agrawai S, et al. Molecular typing of HLA class I and class II antigens in Indian kala-azar patients. Trop Med Int Health. 1997;2:468–471. [PubMed] [Google Scholar]
- 26.Sundar S, Reed SG, Sharma S, Mehrotra A, Murray HW. Circulating T helper 1 (Th1) cell- and Th2 cell-associated cytokines in Indian patients with visceral leishmaniasis. Am J Trop Med Hyg. 1997;56:522–525. doi: 10.4269/ajtmh.1997.56.522. [DOI] [PubMed] [Google Scholar]
- 27.Zwingenberger K, Harms G, Pedrosa C, Omena S, Sandkamp B, Neifer S. Determinants of the immune response in visceral leishmaniasis: evidence for predominance of endogenous interleukin 4 over interferon-gamma production. Clin Immunol Immunopathol. 1990;57:242–249. doi: 10.1016/0090-1229(90)90038-r. [DOI] [PubMed] [Google Scholar]
- 28.Mohamed HS, Ibrahim ME, Miller EN, Peacock CS, Khalil EA, Cordell HJ, et al. Genetic susceptibility to visceral leishmaniasis in The Sudan: linkage and association with IL4 and IFNGR1. Genes Immun. 2003;4:351–355. doi: 10.1038/sj.gene.6363977. [DOI] [PubMed] [Google Scholar]
- 29.Cabello PH, Lima AM, Azevedo ES, Kriger H. Familial aggregation of Leishmnaia chagasi infection in northeastern Brazil. Am J Trop Med Hyg. 1995;52:364–365. doi: 10.4269/ajtmh.1995.52.364. [DOI] [PubMed] [Google Scholar]
- 30.Feitosa MF, Axevedo E, Lima AM, Krieger H. Genetic causes involved in Leishmania chagasi infection in northeastern Brazil. Genet Mol Biol. 1999;22:1–5. [Google Scholar]
- 31.Jeronimo SM, Duggal P, Braz RF, Cheng C, Monteiro GR, Nascimento ET, et al. An emerging peri-urban pattern of infection with Leishmania chagasi, the protozoan causing visceral leishmaniasis in northeast Brazil. Scand J Infect Dis. 2004;36:443–449. doi: 10.1080/00365540410020451. [DOI] [PubMed] [Google Scholar]
- 32.Karplus TM, Jeronimo SM, Chang H, Helms BK, Burns TL, Murray JC, et al. Association between the tumor necrosis factor locus and the clinical outcome of Leishmania chagasi infection. Infect Immun. 2002;70:6919–6925. doi: 10.1128/IAI.70.12.6919-6925.2002. [DOI] [PMC free article] [PubMed] [Google Scholar]
- 33.Evans TG, Teixeira MJ, McAuliffe IT, Vasconcelos I, Vasconcelos AW, Sousa Ade A, et al. Epidemiology of visceral leishmaniasis in northeast Brazil. J Infect Dis. 1992;166:1124–1132. doi: 10.1093/infdis/166.5.1124. [DOI] [PubMed] [Google Scholar]
- 34.O'Connell JR, Weeks DE. PedCheck: a program for identification of genotype incompatibilities in linkage analysis. Am J Hum Genet. 1998;63:259–266. doi: 10.1086/301904. [DOI] [PMC free article] [PubMed] [Google Scholar]
- 35.Holmans P, Clayton D. Efficiency of typing unaffected relatives in an affected sib-pair linkage study with single locus and multiple tightly-linked markers. Am J Hum Genet. 1995;37:1221–1232. [PMC free article] [PubMed] [Google Scholar]
- 36.Hedrick PW. Gametic disequilibrium measures: proceed with caution. Genetics. 1987;117:331–341. doi: 10.1093/genetics/117.2.331. [DOI] [PMC free article] [PubMed] [Google Scholar]
- 37.Devlin B, Risch N. A comparison of linkage disequilibrium measures for fine-scale mapping. Genomics. 1995;29:311–322. doi: 10.1006/geno.1995.9003. [DOI] [PubMed] [Google Scholar]
- 38.Barrett JC, Fry B, Maller J, Daly MJ. Haploview: analysis and visualization of LD and haplotype maps. Bioinformatics. 2005;21:263–265. doi: 10.1093/bioinformatics/bth457. [DOI] [PubMed] [Google Scholar]
- 39.Knapp M. A note on power approximations for the transmission/disequilibrium test. Am J Hum Genet. 1999;64:1177–1185. doi: 10.1086/302334. [DOI] [PMC free article] [PubMed] [Google Scholar]
- 40.Cordell HJ. Properties of case/pseudocontrol analysis for genetic association studies: Effects of recombination, ascertainment, and multiple affected offspring. Genet Epidemiol. 2004;26:186–205. doi: 10.1002/gepi.10306. [DOI] [PubMed] [Google Scholar]
- 41.Cordell HJ, Clayton DG. A unified stepwise regression procedure for evaluating the relative effects of polymorphisms within a gene using case/control or family data: application to HLA in type 1 diabetes. Am J Hum Genet. 2002;70:124–141. doi: 10.1086/338007. [DOI] [PMC free article] [PubMed] [Google Scholar]
- 42.Gottgens B, Gilbert JG, Barton LM, Grafham D, Rogers J, Bentley DR, et al. Long-range comparison of human and mouse SCL loci: localized regions of sensitivity to restriction endonucleases correspond precisely with peaks of conserved noncoding sequences. Genome Res. 2001;11:87–97. doi: 10.1101/gr.153001. [DOI] [PMC free article] [PubMed] [Google Scholar]
- 43.Marquet S, Laurent A, Hillaire D, Dessein H, Kalil J, Feingold J, et al. Genetic localization of a locus controlling the intensity of infection by Schistosoma mansoni on chromosome 5q31-q33. Nat Genet. 1996;14:181–184. doi: 10.1038/ng1096-181. [DOI] [PubMed] [Google Scholar]
- 44.Kouriba B, Chevillard C, Bream JH, Argiro L, Dessein H, Arnaud V, et al. Analysis of the 5q31-q33 locus shows an association between IL13-1055C/T IL-13-591A/G polymorphisms and Schistosoma haematobium infections. J Immunol. 2005;174:6274–6281. doi: 10.4049/jimmunol.174.10.6274. [DOI] [PubMed] [Google Scholar]
- 45.Launois P, Maillar I, Pingel S, Swihart KG, Xenarios I, Acha-Orbea H, et al. IL-4 rapidly produced by Vá4 Và8 CD4+ T cells instructs Th2 development and susceptibility to Leishmania major in BALB/c mice. Immunity. 1997;6:541–549. doi: 10.1016/s1074-7613(00)80342-8. [DOI] [PubMed] [Google Scholar]
- 46.Peruhype-Magalhaes V, Martins-Filho OA, Prata A, Silva Lde A, Rabello A, Teixeira-Carvalho A, et al. Immune response in human visceral leishmaniasis: analysis of the correlation between innate immunity cytokine profile and disease outcome. Scand J Immunol. 2005;62:487–495. doi: 10.1111/j.1365-3083.2005.01686.x. [DOI] [PubMed] [Google Scholar]
- 47.Mayrink W, da Costa CA, Magalhaes PA, Melo MN, Dias M, Lima AO, et al. A field trial of a vaccine against American dermal leishmaniasis. Trans R Soc Trop Med Hyg. 1979;73:385–387. doi: 10.1016/0035-9203(79)90159-7. [DOI] [PubMed] [Google Scholar]
- 48.Antunes CM, Mayrink W, Magalhaes PA, Costa CA, Melo MN, Dias M, et al. Controlled field trials of a vaccine against New World cutaneous leishmaniasis. Int J Epidemiol. 1986;15:572–580. doi: 10.1093/ije/15.4.572. [DOI] [PubMed] [Google Scholar]
- 49.Sharifi I, FeKri AR, Aflatonian MR, Khamesipour A, Nadim A, Mousavi MR, et al. Randomised vaccine trial of single dose of killed Leishmania major plus BCG against anthroponotic cutaneous leishmaniasis in Bam, Iran. Lancet. 1998;351:1540–1543. doi: 10.1016/S0140-6736(98)09552-X. [DOI] [PubMed] [Google Scholar]
- 50.Momeni AZ, Jalayer T, Emamjomeh M, Khamesipour A, Zicker F, Ghassemi RL, et al. A randomised, double-blind, controlled trial of a killed L. major vaccine plus BCG against zoonotic cutaneous leishmaniasis in Iran. Vaccine. 1999;17:466–472. doi: 10.1016/s0264-410x(98)00220-5. [DOI] [PubMed] [Google Scholar]
- 51.Khalil EA, El Hassan AM, Zijlstra EE, Mukhtar MM, Ghalib HW, Musa B, et al. Autoclaved Leishmania major vaccine for prevention of visceral leishmaniasis: a randomised, double-blind, BCG-controlled trial in Sudan. Lancet. 2000;356:1565–1569. doi: 10.1016/s0140-6736(00)03128-7. [DOI] [PubMed] [Google Scholar]
- 52.Mayrink W, Schettini AP, Williams P, Raso P, Magalhaes PA, Lima Ade O, et al. Histological observations on Montenegro's reaction in man. Rev Inst Med Trop Sao Paulo. 1989;31:256–61. doi: 10.1590/s0036-46651989000400008. [DOI] [PubMed] [Google Scholar]
- 53.Castes M, Blackwell J, Trujillo D, Formica S, Cabrera M, Zorrilla G, et al. Immune response in healthy volunteers vaccinated with killed leishmanial promastigotes plus BCG. I: Skin-test reactivity, T cell proliferation and interferon-gamma production. Vaccine. 1994;12:1041–1051. doi: 10.1016/0264-410x(94)90342-5. [DOI] [PubMed] [Google Scholar]
- 54.Black GF, Fine PEM, Warndorff DK, Floyd S, Weir RE, Blackwell JM, et al. Relationship between IFN-gamma and skin test responsiveness to Mycobacterium tuberculosis PPD in healthy, non-BCG-vaccinated young adults in Northern Malawi. Int J Tuberc Lung Dis. 2001;5:664–672. [PubMed] [Google Scholar]
- 55.Weir RE, Fine PE, Nazareth B, Floyd S, Black GF, King E, et al. Interferon-gamma and skin test responses of schoolchildren in southeast England to purified protein derivatives from Mycobacterium tuberculosis and other species of mycobacteria. Clin Exp Immunol. 2003;134:285–94. doi: 10.1046/j.1365-2249.2003.02272. [DOI] [PMC free article] [PubMed] [Google Scholar]
- 56.Yamagoe S, Mizuno S, Suzuki K. Molecular cloning of human and bovine LECT2 having a neutrophil chemotactic activity and its specific expression in the liver. Biochim Biophys Acta. 1998;1396:105–113. doi: 10.1016/s0167-4781(97)00181-4. [DOI] [PubMed] [Google Scholar]
- 57.Nagai H, Hamada T, Uchida T, Yamagoe S, Suzuki K. Systemic expression of a newly recognized protein, LECT2, in the human body. Pathol Int. 1998;48:882–886. doi: 10.1111/j.1440-1827.1998.tb03855.x. [DOI] [PubMed] [Google Scholar]
- 58.Wilson ME, Innes DJ, Sousa AD, Pearson RD. Early histopathology of experimental infection with Leishmania donovani in hamsters. 1987;73:55–63. [PubMed] [Google Scholar]
- 59.Yamagoe S, Kameoka Y, Hashimoto K, Mizuno S, Suzuki K. Molecular cloning, structural characterization, and chromosomal mapping of the human LECT2 gene. Genomics. 1998;48:324–329. doi: 10.1006/geno.1997.5198. [DOI] [PubMed] [Google Scholar]
- 60.Skokowa J, Cario F, Uenalan M, Schamback A, Germeshausen M, Battmer K, et al. LEF-1 is crucial for neutrophil granulcytopoiesis and its expression is severely reduced in congenital neutropenia. Nature Med. 2006;12:1191–1197. doi: 10.1038/nm1474. [DOI] [PubMed] [Google Scholar]
- 61.Joseph SB, Castrillo A, Laffitte BA, Mangellsdorf DJ, Tontonoz P. Reciprocal regulation of inflammation and lipid metabolism by liver X receptors. Nature Med. 2003;9:213–219. doi: 10.1038/nm820. [DOI] [PubMed] [Google Scholar]
- 62.Kannabiran C, Klintworth GK. TGFBI gene mutations in corneal dystrophies. Hum Mutat. 2006;27:615–25. doi: 10.1002/humu.20334. [DOI] [PubMed] [Google Scholar]
- 63.Skonier J, Bennett K, Rothwell V, Kosowski S, Plowman G, Wallace P, et al. beta igh3: a transforming growth factor-beta-responsive gene encoding a secreted protein that inhibits cell attachment in vitro and suppresses the growth of CHO cells in nude mice. DNA Cell Biol. 1994;13:571–84. doi: 10.1089/dna.1994.13.571. [DOI] [PubMed] [Google Scholar]
Associated Data
This section collects any data citations, data availability statements, or supplementary materials included in this article.