

Abstract
We have shown that overexpression of SMS1, an enzyme that converts de novo ceramide into sphingomyelin, is accompanied by attenuated ceramide response and apoptotic resistance after photodamage with the photosensitizer Pc 4 (photodynamic therapy; PDT). To test whether SMS1 overexpression-related effects after PDT can be reversed, in this study SMS1 was downregulated in Jurkat T lymphoma/leukemia cells using small inhibitory RNA (siRNA) for SMS1. Compared to scrambled (control) siRNA-transfectants, in SMS1 siRNA-transfected cells the activity of SMS at rest was downregulated with concomitant decrease in sphingomyelin mass. In SMS1 siRNA-transfected cells increases in ceramides were higher than in control siRNA-transfectants after PDT. Similar findings were obtained for dihydroceramides suggesting the involvement of de novo ceramide pathway. PDT-induced DEVDase (caspase-3-like) activation was enhanced in SMS1 siRNA-transfected cells compared to their control counterparts. The data show that RNA interference-dependent downregulation of SMS1 is associated with increased accumulation of ceramide and dihydroceramide with concomitant sensitization of cells to apoptosis after photodamage. Similarly, in SMS2 siRNA-transfected cells, downregulation of SMS activity was accompanied by potentiated DEVDase activation post-photodamage. These findings suggest that SMS is a potential novel molecular target that can augment therapeutic efficacy of PDT.
Keywords: apoptosis, ceramide, dihydroceramide, electrospray ionization/double mass spectrometry, PDT, phthalocyanine Pc 4, sphingomyelin synthase
Introduction
Ceramide is a key metabolite in both anabolic and catabolic pathways of sphingolipids [1–4]. De novo sphingolipid biosynthesis begins with serine palmitoyltransferase (SPT)-dependent condensation of palmitoyl CoA and L-serine, resulting in the synthesis of 3-ketodihydrosphingosine. In subsequent reactions dihydrosphingosine, dihydroceramide, and de novo ceramide are formed, and the latter can be acted upon by sphingomyelin synthase (SMS) to give rise to sphingomyelin. SMS1 and SMS2, two isoforms of the enzyme, are localized to the Golgi and plasma membrane, respectively [5]. Besides controlling cellular sphingomyelin and ceramide levels [6,7], SMS1 and SMS2 have been shown to regulate cell growth and apoptosis. RNA interference-induced suppression of SMS2 and/or SMS1 are associated with apoptotic resistance [8–10] and inhibition of growth [7].
However, de novo ceramide can be associated with apoptotic sensitization after oxidative stress [11]. The oxidative stress inducer photodynamic therapy uses a photosensitizer, visible light and oxygen to generate reactive oxygen species that can destroy malignant cells by apoptosis [12,13]. Using pharmacologic and genetic approaches, we have demonstrated that de novo sphingolipids are associated with initiation of apoptosis after photodamage with Pc 4 (PDT) [14,15]. We have shown that in the absence of SPT upregulation, de novo ceramide accumulates, while SMS is inhibited post-PDT [16]. These findings support the idea that PDT triggers de novo ceramide accumulation by inhibition of SMS. To test directly the role of SMS in ceramide production and apoptosis, we overexpressed SMS1 in Jurkat cells and found that both ceramide production and apoptosis are suppressed after PDT [17]. The aim of the present study was to test whether downregulation of SMS by siRNA can reverse the effects observed in SMS1-overexpressing cells and sensitize Jurkat cells to apoptosis post-PDT.
Materials and methods
Cell culture
Jurkat, clone E6-1 cells (American Type Culture Collection) were cultured in RPMI 1640 medium (Invitrogen), supplemented with 10% fetal bovine serum (Hyclone), 100 units/ml penicillin, and 100 μg/ml streptomycin, and were maintained at 37°C in a 5% CO2 atmosphere. For PDT experiments, cells were treated in growth medium and all incubations were performed at 37°C in a 5% CO2 atmosphere. The phthalocyanine photosensitizer Pc 4, HOSiPcOSi(CH3)2(CH2)3N(CH3)2, was from Dr. Malcolm E. Kenney (Case Western Reserve University).
Transfection with siRNA and treatment
The sequences of siRNAs for human SMS1 and SMS2 were CAC ACT ATG GCC AAT CAG CAA and AAG GCA CCA AAA AGT ACC CGG, respectively. Two scrambled siRNA were initially tested: Silencer Negative Control #1 (Ambion) and AllStars Negative Control siRNA (Qiagen). The latter was used for all studies described in this paper. Jurkat cells were transfected with double strand siRNAs by electroporation using the Amaxa Nucleofactor device (Amaxa) according to the manufacturer’s instructions. The protocol was optimized regarding the concentration of SMS1 siRNA, transfection and post-transfection conditions in preliminary dose-response experiments (0.001– 3 μM SMS1 siRNA), and using mock cells as controls. Consequently, the following protocol was employed: cells (5 ×10⁶) were transfected with 1.5 μM of each siRNA. Two days after transfection, cells were collected and seeded in fresh growth medium containing Pc 4 (200 nM). Following overnight exposure to Pc 4, cells were irradiated with red light (2 mW/cm2; λmax ~ 670 nm) using a light-emitting diode array (EFOS) at various fluences (135, 270 and 400 mJ/cm2) at room temperature. Two hours post-PDT, cells were harvested, washed with PBS, and further processed for various analyses. For mass spectrometric analysis, cells (5 ×10⁶) were washed twice with PBS, resuspended in 100 μl ethyl acetate/methanol (1:1, v/v), dried under nitrogen, and shipped overnight on dry ice to the Lipidomics Core (Charleston, SC) for further processing.
Electrospray ionization/double mass spectrometry analysis
Following extraction, sphingolipids were separated by high performance liquid chromatography, introduced to electrospray ionization source and then analyzed by double mass spectrometry (Thermo Finnigan TSQ 7000 triple quadrupole mass spectrometer), which allows simultaneous determination of various sphingolipids, including ceramide, dihydroceramide and sphingomyelin species, as well as dihydrosphingosine and sphingosine-1-phosphate [18]. Specifically, cells (2–3 × 10⁶) were fortified with the internal standards (C17-base-D-erythro-sphingosine, C17-sphingosine-1-phosphate, N-palmitoyl-D-erythro-C13-sphingosine, and C17-D-erythro-sphingosine), and extracted with ethyl acetate/iso-propanol/water (60/30/10, v/v). After evaporation and reconstitution in 100 μl of methanol, samples were injected into the HP1100/TSQ 7000 LC/MS system and gradient-eluted from the BDS Hypersil C8, 150 × 3.2 mm, 3 μm particle size column, with 1 mM methanolic ammonium formate/2 mM aqueous ammonium formate mobile phase. Peaks corresponding to the target analytes and internal standards were collected and processed using the Xcalibur software system. Quantitative analysis was based on the calibration curves generated by spiking an artificial matrix with the known amounts of the target analyte synthetic standards and an equal amount of the internal standards. For the calibration curves, the target analyte/internal standard peak area ratios were plotted against analyte concentration. The target analyte/internal standard peak area ratios from the samples were similarly normalized to their respective internal standards and compared to the calibration curves, using a linear regression model. The method is referred to in the remaining text as mass spectrometry.
SMS activity
The enzyme activity was measured in cell lysates prepared from cells (2.5 ×10⁶) treated with PDT as described previously [19,20]. The assay of SMS activity is based on the ability of SMS to incorporate the fluorogenic derivative of C6-ceramide, (N-[6-[(7-nitro-2-1,3-benzoxadiazol-4-yl)amino]hexanoyl]-D-erythro-sphingosine (C6-NBD-ceramide; Avanti), into sphingomyelin. C6-NBD-ceramide-labeled sphingomyelin was extracted, separated by thin layer chromatography (TLC) using chloroform/methanol/water (65/25/4, v/v), and the fluorescence was detected and quantified by the STORM 860 imaging system (GE Healthcare).
DEVDase (caspase-3-like) activity
As described previously [16], the activity of the apoptotic marker DEVDase, was determined in cytosol by an assay based on the enzyme’s ability to cleave the fluorogenic derivative 7-amino-4-methylcoumarin (AMC; Biomol) of the tetrapeptide substrate N-acetyl-Asp-Glu-Val-Asp (DEVD). The released fluorescence of the cleaved DEVD substrate was measured in a F-2500 Hitachi spectrofluorometer (380 nm excitation and 460 nm emission).
Statistical analysis
The –fold changes (ratios) of PDT-treated values divided by corresponding Pc 4 control value were log2 or log10 transformed to improve the normality of the distributions. The response variable Y (e.g., ceramide levels) was regressed (modeled) using linear mixed-effect models (LMEM) in which the dose and the group variables were considered as fixed effects (of interest) while the day variable (i.e., the day of experiment) was treated as a random effect (nuisance variable). The group variable was a factor with two levels (scrambled-, SMS1-transfected cells) and the dose was treated as a continuous variable. The main effects, i.e., that of the group and the dose, on the response Y, were estimated along with their significance as predictors in the model. A separate model was fitted with the data for each sphingolipid molecule. The R statistical environment (www.r-project.org) was used to fit the LMEM model [21].
In the tables, the FCG is the estimated fold-change between groups (cell lines) regarding a response (e.g., ceramide level), assuming a constant dose. The FCD is the estimated fold-change in response to each 100 units of dose (light fluence), regardless of the group. The pGroupFDR and the pDoseFDR are the corresponding adjusted p-values using a false discovery rate adjustment algorithm [22]. This adjustment is required to account for multiple testing (i.e. several molecules tested at the same time) and therefore controls the fraction of false positive findings among all positive test results. For example, if 20 ceramides are tested at the same time and 10 of them had pGroupFDR less than 0.05, this means about 0.05*10 = 0.5 of them (less than 1) might be false positives, which is an acceptable risk. The significance of the group coefficient in the linear model is tested assuming a T distribution, and it is implicitly a two-tailed test.
Results
To verify downregulation of SMS1 by RNA interference in Jurkat cells, the activity of the enzyme was determined in cell lysates (Fig. 1) and the levels of sphingomyelin, a product of SMS, were measured by mass spectrometry (Table 1). As shown in Figure 1, the enzyme activity was downregulated in SMS1 siRNA-transfectants. Based on the calculated FCG value of 0.65, the enzyme activity was reduced by 54% in SMS1 siRNA-transfectants. [The formula used for calculating percent reduction here and elsewhere was: (1/FCG −1)*100.] Using mass spectrometry we found that the levels of eight out of twelve sphingomyelin species were significantly reduced in SMS1 siRNA-transfectants (Table 1). C14-, C16-, C18-, C20-, C22-, C22:1-, C24-, C24:1-sphingomyelin were reduced in SMS1 siRNA-transfectants by 39, 55, 51, 70, 59, 66, 58, and 39%, respectively. The trends for remaining four sphingomyelins were similar but not significant (Table 1).
Figure 1.
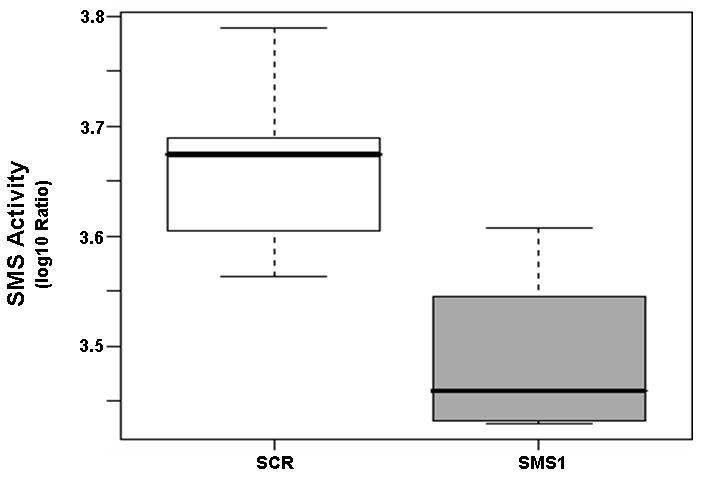
Sphingomyelin synthase (SMS) is downregulated in SMS1 siRNA-transfected Jurkat cells. Cells were transfected with SMS1- or scrambled siRNA as described in “Material and Methods”. Two days after transfection, cells were collected and seeded in fresh growth medium with or without Pc 4 (200 nM). Following overnight exposure to Pc 4, cells were harvested, and the enzyme activity was determined in cell lysates as described in “Material and Methods”. There was no significant difference between Pc 4- and untreated-controls in either cell type, and for the analysis, the values of the two controls were grouped. SCR, scrambled siRNA-transfectants; SMS1, SMS1 siRNA -transfectants.
Table 1.
Statistical analysis of sphingomyelin levels in growing Jurkat cells transfected with scrambled siRNA- or SMS1 siRNA-transfected cells and given Pc 4 only but no light.
| FCG | pGroupFDR | |
|---|---|---|
| C20-SM | 0.59 | 0.015 |
| C16-SM | 0.65 | 0.016 |
| C22:1-SM | 0.60 | 0.016 |
| C18-SM | 0.66 | 0.016 |
| C14-SM | 0.72 | 0.016 |
| C24:1-SM | 0.72 | 0.029 |
| C22-SM | 0.63 | 0.046 |
| C24-SM | 0.63 | 0.046 |
| C26:1-SM | 0.54 | 0.109 |
| C26-SM | 0.48 | 0.109 |
| C18:1-SM | 0.88 | 0.321 |
| C20:1-SM | 0.93 | 0.645 |
The FCG is the estimated fold-change between two cell types (groups) regarding the sphingomyelin (SM) response. The pGroupFDR is the adjusted p-value using false discovery rate algorithm. Bold type indicates statistical significance.
We used mass spectrometry to compare the effects of photodamage in SMS1 siRNA-transfectants and scrambled siRNA-transfectants on the mass of sphingolipids. Twelve species were detected for each of the following sphingolipids: ceramides, dihydroceramides and sphingomyelins. Among ceramides, all but C24- and C24:1-ceramide showed a dose-dependent response to PDT in both cell types, as indicated by pDoseFDRs (Table 2). C22:1-ceramide showed maximal dose-response since the calculated FCD value of 2.02 indicates an overall 102% increase in C22:1-ceramide in both cell types per 100 units of light fluence (Table 2). Five out of twelve ceramides showed significantly enhanced response to PDT in SMS1 siRNA-transfectants compared to scrambled siRNA-transfectants (see pGroupFDRs, Table 2; Fig. 2). Specifically, compared to their control counterparts, in SMS1 siRNA-transfected cells after PDT there was on average a 74, 35, 36, 56 and 45% greater response of C26-, C24-, C24:1-, C22- and C26:1-ceramide, respectively.
Table 2.
Statistical analysis of responses of sphingolipids to PDT in scrambled siRNA- and SMS1 siRNA-transfected cells.
| FCG | FCD | pGroupFDR | pDoseFDR | |
|---|---|---|---|---|
| C26Ceramide | 1.74 | 1.21 | 6.4E-08 | 2.39E-06 |
| C24Ceramide | 1.35 | 0.99 | 1.2E-05 | 5.20E-01 |
| C24:1Ceramide | 1.36 | 1.05 | 2.7E-04 | 1.07E-01 |
| C22Ceramide | 1.56 | 1.10 | 2.7E-04 | 4.86E-02 |
| C26:1Ceramide | 1.45 | 1.48 | 1.0E-03 | 4.71E-09 |
| C16Ceramide | 1.16 | 1.27 | 7.0E-02 | 6.13E-08 |
| C22:1Ceramide | 1.34 | 2.02 | 7.1E-02 | 4.34E-10 |
| C20Ceramide | 1.33 | 1.78 | 7.1E-02 | 8.76E-09 |
| C18:1Ceramide | 1.20 | 1.47 | 8.2E-02 | 1.00E-08 |
| C20:1Ceramide | 1.26 | 1.97 | 2.7E-01 | 3.84E-07 |
| C18Ceramide | 1.10 | 1.93 | 3.6E-01 | 2.17E-12 |
| C14Ceramide | 1.00 | 1.50 | 9.6E-01 | 3.50E-11 |
| DHC24:1-Cer | 1.67 | 1.77 | 2.2E-02 | 8.71E-08 |
| DHC24-Cer | 1.40 | 1.23 | 2.2E-02 | 4.42E-04 |
| DHC22-Cer | 1.27 | 1.32 | 2.2E-02 | 1.20E-07 |
| DHC22:1-Cer | 1.39 | 1.25 | 1.6E-01 | 8.16E-03 |
| DHC14-Cer | 1.23 | 2.36 | 2.6E-01 | 2.18E-12 |
| DHC16-Cer | 1.27 | 2.17 | 2.6E-01 | 4.40E-09 |
| DHC20:1-Cer | 1.25 | 1.78 | 2.6E-01 | 1.08E-06 |
| DHC18:1-Cer | 0.81 | 1.70 | 2.6E-01 | 1.12E-07 |
| DHC18-Cer | 1.16 | 3.98 | 4.8E-01 | 2.71E-13 |
| DHC26-Cer | 1.08 | 1.13 | 5.4E-01 | 1.98E-02 |
| DHC26:1-Cer | 1.05 | 1.45 | 8.1E-01 | 1.11E-05 |
| DHC20-Cer | 1.01 | 1.89 | 9.7E-01 | 4.36E-05 |
| C14-SM | 1.33 | 0.93 | 3.4E-02 | 4.07E-01 |
| C20:1-SM | 0.83 | 1.00 | 6.3E-02 | 9.57E-01 |
| C16-SM | 1.20 | 0.97 | 6.3E-02 | 7.09E-01 |
| C18-SM | 1.16 | 0.95 | 1.1E-01 | 5.31E-01 |
| C26:1-SM | 1.26 | 0.95 | 1.1E-01 | 6.14E-01 |
| C18:1-SM | 1.24 | 1.02 | 1.2E-01 | 8.87E-01 |
| C22-SM | 0.92 | 0.94 | 4.3E-01 | 4.07E-01 |
| C20-SM | 1.09 | 1.01 | 4.4E-01 | 8.87E-01 |
| C24:1-SM | 0.94 | 0.98 | 4.4E-01 | 7.70E-01 |
| C22:1-SM | 0.97 | 0.96 | 8.6E-01 | 5.76E-01 |
| C24-SM | 0.99 | 0.95 | 9.7E-01 | 4.07E-01 |
| C26-SM | 1.00 | 1.00 | 9.7E-01 | 9.57E-01 |
| Sph | 2.35 | 1.05 | 4.4E-04 | 6.03E-01 |
| Sph-1P | 0.54 | 1.28 | 2.6E-02 | 4.72E-02 |
| DHSph-1P | 0.75 | 1.64 | 3.6E-01 | 2.63E-03 |
| DHSph | 1.22 | 1.64 | 3.6E-01 | 1.35E-04 |
DHC24:1-Cer, C24:1-dihydroceramide; C14-SM, C14-sphingomyelin. Similar abbreviations were used for other dihydroceramides and sphingomyelins, respectively. Sph, sphingosine; Sph-1P, sphingosine-1-phosphate, DHSph-1P, dihydrosphingosine-1-phosphate; DHSph, dihydrosphingosine.
The FCG is the estimated fold-change between cell lines (groups) regarding a sphingolipid response, assuming a constant PDT dose. The FCD is the estimated fold-change in response to each 100 units of dose (light fluence), regardless of the group. The pGroupFDR and the pDoseFDR are corresponding adjusted p-values using false discovery rate algorithm. Bold type indicates statistical significance.
Figure 2.

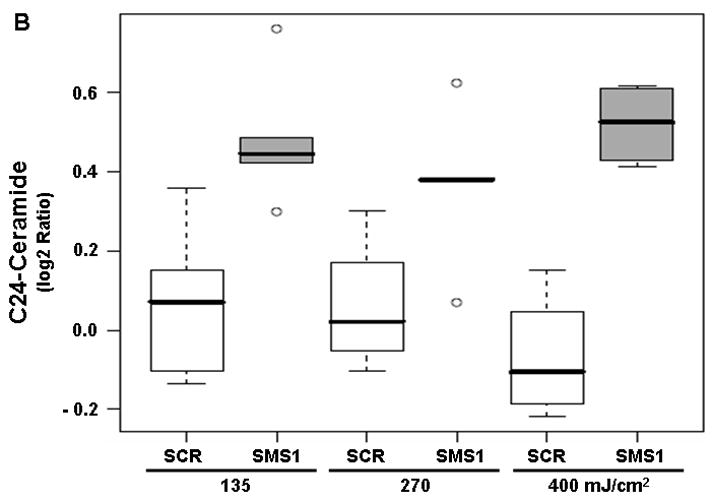
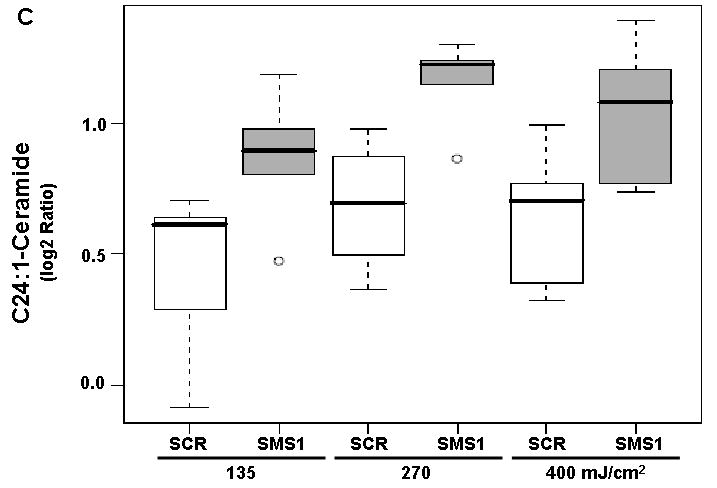
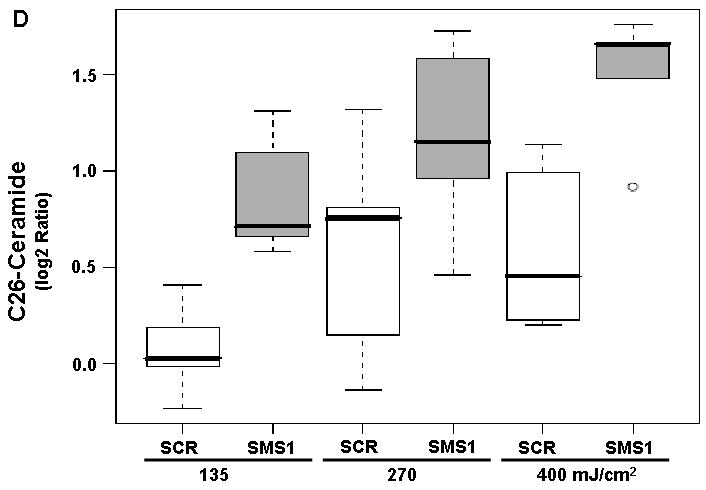
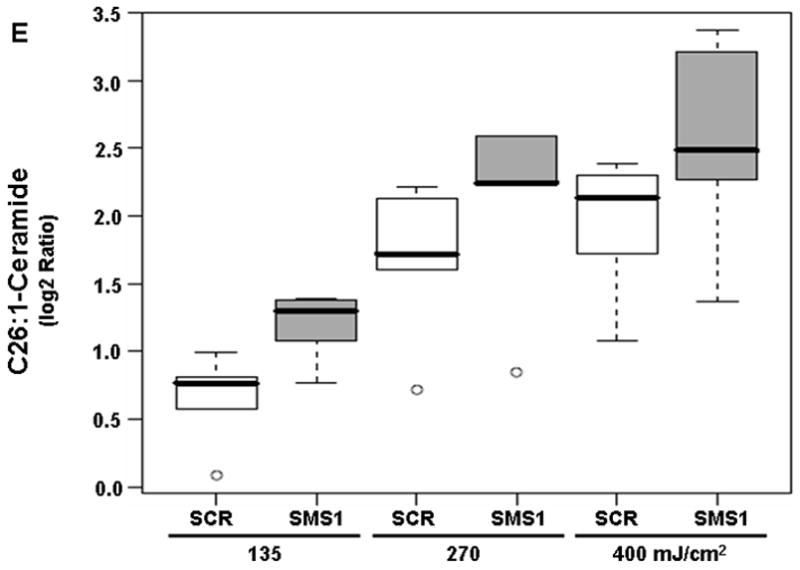
Mass spectrometric analysis reveals enhanced ceramide response to PDT in SMS1 siRNA-transfected Jurkat cells. (A) C22-ceramide; (B) C24-ceramide; (C) C24:1-ceramide; (D) C26-ceramide; (E) C26:1-ceramide. Cells were transfected with SMS1- or scrambled-siRNA as described in “Materials and Methods”. Two days after transfection, cells were collected and seeded in fresh growth medium with or without Pc 4 (200 nM). Following overnight exposure to Pc 4, cells were irradiated with red light at the indicated light fluences (mJ/cm2). Two hours post-PDT cells were harvested, and lipids were extracted. Ceramide levels were determined by mass spectrometry (see “Materials and Methods”). Three-six independent measurements of ceramides were performed. The Y-axis shows log2 ratios for each ceramide as a function of both group and dose variable. This and subsequent figures: the boxes contain 50% of the data and the median value is shown as the horizontal thick line within the box. The whiskers extend to the most extreme data point (minimum and maximum value) which is no more than 1.5 times the interquartile range (i.e., remaining 50% of the data) from the box. Outliers are shown as empty circles. SCR, scrambled siRNA-transfectants; SMS1, SMS1 siRNA -transfectants.
Dihydroceramides, which are precursors of ceramide in the de novo pathway, were also detected by mass spectrometry. All twelve dihydroceramides showed a dose-dependent response to PDT in both cell types (see pDoseFDRs, Table 2). C18-dihydroceramide showed maximal dose response since the calculated FCD value of 3.98 indicates an overall 298% increase in C18-dihydroceramide in both cell types per 100 units of light fluence (Table 2). Three out of twelve dihydroceramides showed significantly enhanced response to PDT in SMS1 siRNA-transfectants relative to scrambled siRNA-transfectants (see pGroupFDRs, Table 2; Fig. 3). Compared to scrambled siRNA-transfected cells, in SMS1 siRNA-transfectants after PDT there was on average a 67, 40, and 27% greater response of C24:1-, C24- and C22-dihydroceramide, respectively.
Figure 3.

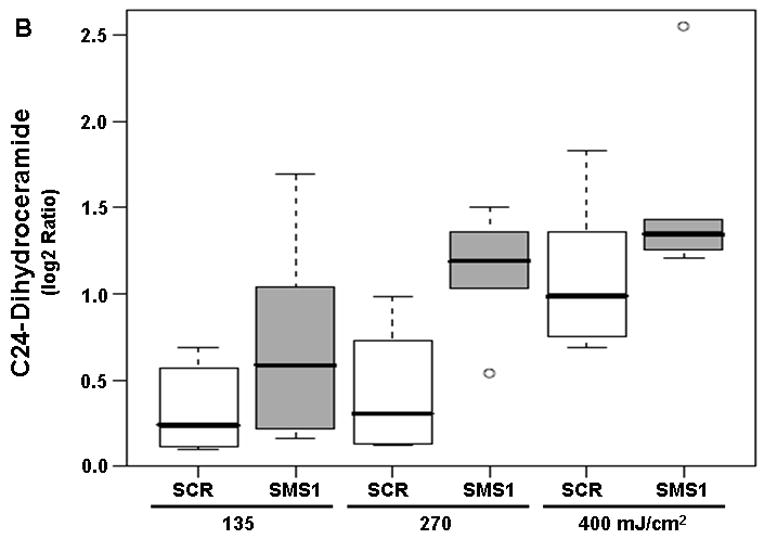
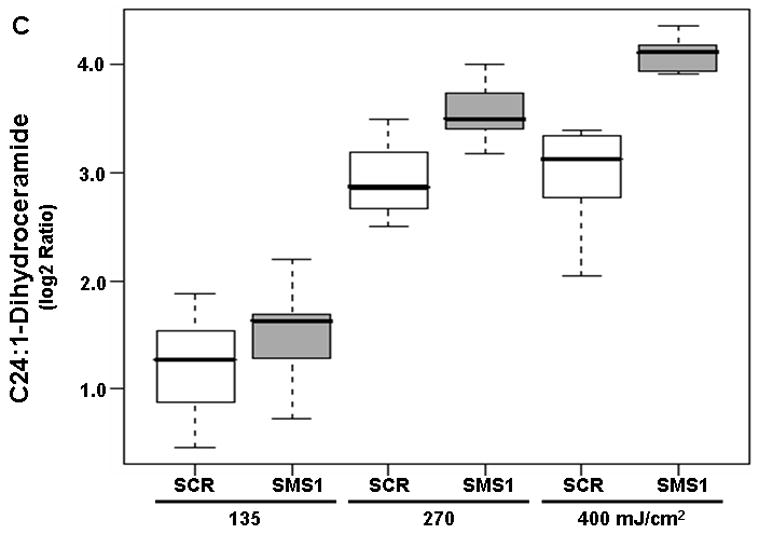
Mass spectrometric analysis reveals enhanced dihydroceramide response to PDT in siRNA SMS1-transfected Jurkat cells. (A) C22-dihydroceramide; (B) C24-dihydroceramide; (C) C24:1-dihydroceramide. See Fig. 2 for experimental details. Dihydroceramide levels were determined by mass spectrometry (see “Materials and Methods”). Three-six independent measurements of ceramides were performed. The Y-axis shows log2 ratios for each ceramide as a function of both group and dose variable. Outliers are shown as empty circles. SCR, scrambled siRNA-transfectants; SMS1, SMS1 siRNA -transfectants.
None of the twelve sphingomyelins showed a dose-dependent response to PDT in either cell type (see pDoseFDRs, Table 2). FCD values indicate that the overall sphingomyelin levels were close to resting levels in both cell types after PDT. All but C14-sphingomyelin showed no difference between two cell types (see pGroupFDRs, Table 2). Downregulation of SMS1 was associated with a 33% greater response of C14-sphingomyelin to PDT, resulting in closer to resting sphingomyelin levels.
Dihydrosphingosine, another precursor of ceramide in the de novo pathway, was also detected by mass spectrometry. As indicated by the pDoseFDR, the sphingolipid showed a dose-dependent response to PDT in both cell types (Table 2). The calculated FCD value indicates an overall 64% increase in dihydrosphingosine per 100 units of light fluence in either cell type (Table 2). However, there was no difference between the two cell types in the response of this sphingolipid to PDT (Table 2).
The accumulation of the proapoptotic sphingosine and the antiapoptotic sphingosine-1-phosphate after PDT showed significant differences between the two cell types (Table 2; Fig. 4). Generation of sphingosine was 135% greater in SMS1 siRNA-transfectants compared to scrambled siRNA-transfectants (Fig. 4A). In contrast, the levels of sphingosine-1-phosphate were 87% lower in SMS1 siRNA-transfectants than in their control counterparts (Fig. 4B). A significant dose-response was detected only for sphingosine-1-phosphate. The calculated FCD value of 1.28 indicates an overall 28% increase in sphingosine-1-phosphate per 100 units of light fluence in either cell type (Table 2). Dihydrosphingosine-1-phosphate, which is, in addition to sphingosine-1-phosphate, a product of sphingosine kinase, showed a dose-response in both cell types but no difference between them after photodamage (Table 2).
Figure 4.

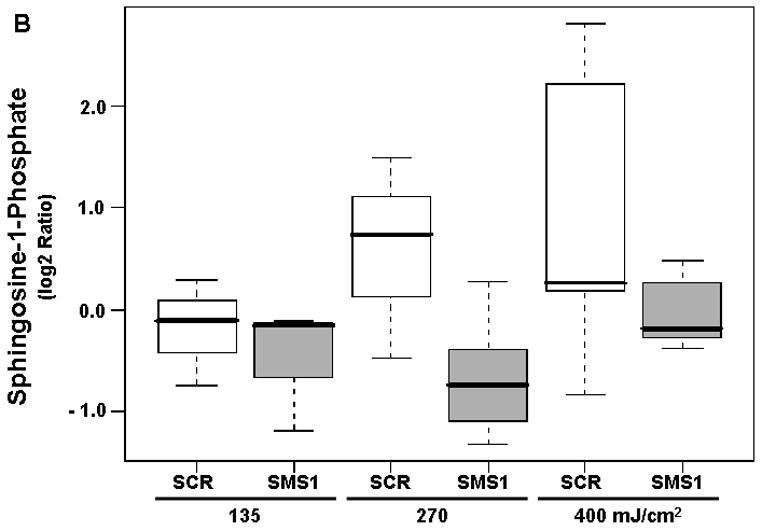
Mass spectrometric analysis identifies different responses of sphingosine (A) and sphingosine-1-phosphate (B) to PDT in SMS1 siRNA-transfected Jurkat cells compared to their control counterparts. See Fig. 2 for experimental details. Sphingolipid levels were determined by mass spectrometry (see “Materials and Methods”). Three-six independent measurements of sphingolipids were performed. The Y-axis shows log2 ratios for each sphingolipid as a function of both group and dose variable. Outliers are shown as empty circles. SCR, scrambled siRNA-transfectants; SMS1, SMS1 siRNA -transfectants.
We have shown that PDT triggers inhibition of SMS without affecting SPT activity in Jurkat parental cells [16]. The activity of SMS was determined after PDT in SMS1 siRNA-transfectants and their control counterparts. The calculated FCD value of 0.53 shows an overall significant 90% decrease in the enzyme activity per 100 units of light fluence in both cell types (not shown). However, no significant difference between the two cell types was detected after photodamage (Figure 5A).
Figure 5.
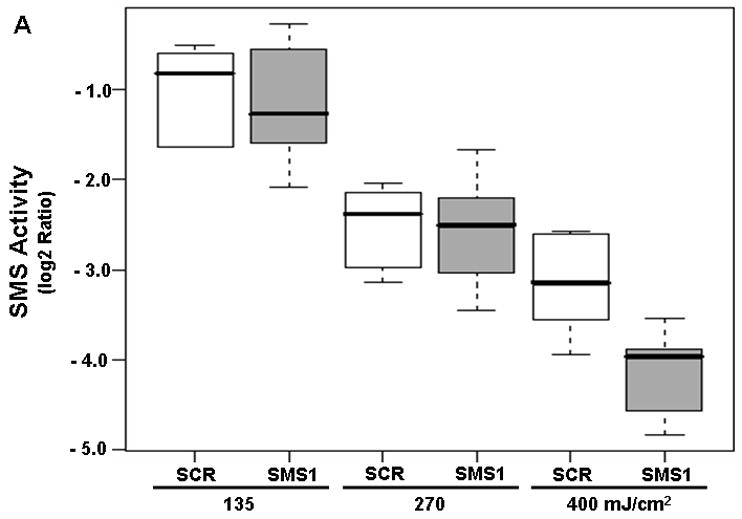
The effects of PDT on the activities of SMS (A) and DEVDase (B) in scrambled siRNA- and SMS1 siRNA-transfected Jurkat cells. Forty eight hours after transfection, cells were treated overnight with Pc 4 (200 nM), irradiated at the indicated light fluences, and incubated for 2 h. After the cells were harvested, (A) cell lysates were prepared and the activity of SMS was assayed using C6-NBD-ceramide as the substrate; (B) DEVDase activity was measured in cell lysates spectrofluorimetrically using DEVD-AMC as the substrate. Three-five independent determinations of the enzymes were performed. The Y-axis shows log2 ratios for each enzyme as a function of both group and dose variable. SCR, scrambled siRNA-transfectants; SMS1, SMS1 siRNA -transfectants.
We have already shown that Jurkat cells undergo apoptosis post-PDT [15,23], and that overexpression of SMS1 leads to resistance to PDT [17]. In this study we tested whether Jurkat cells can be sensitized to PDT by downregulation of SMS1. Apoptosis was assessed by measuring DEVDase (caspase-3-like) activity. Activation of caspase-3 is involved in the execution of apoptosis [24]. The calculated FCD value of 1.94 shows a 94% increase in the enzyme activity per 100 units of light fluence in both cell types (Table 3). Notably, DEVDase activity was potentiated by 65% post-PDT in SMS1 siRNA-transfectants compared to their control counterparts (Table 3; Fig. 5B). The data demonstrate that PDT initiates a dose-dependent DEVDase activation in both cell types, and that compared to scrambled siRNA-transfectants the responses were substantially enhanced in SMS1 siRNA-transfectants.
Table 3.
Statistical analysis of the response of DEVDase to PDT in SMS1 siRNA- and SMS2 siRNA-transfectants compared to scrambled (control) siRNA-transfectants.
| FCG | FCD | pGroupFDR | pDoseFDR | |
|---|---|---|---|---|
| SMS1 siRNA | 1.65 | 1.94 | 1.48E-05 | 1.03E-11 |
| SMS2 siRNA | 1.53 | 1.61 | 1.08E-04 | 2.76E-06 |
The FCG is the estimated fold-change between SMS1 siRNA-transfectants and their corresponding controls, or between SMS2 siRNA-transfectants and their corresponding controls regarding the DEVDase response, assuming a constant PDT dose. The FCD is the estimated fold-change in response to each 100 units of dose (light fluence), regardless of the group (cell type). The pGroupFDR and the pDoseFDR are corresponding adjusted p-values using false discovery rate algorithm. Bold type indicates statistical significance.
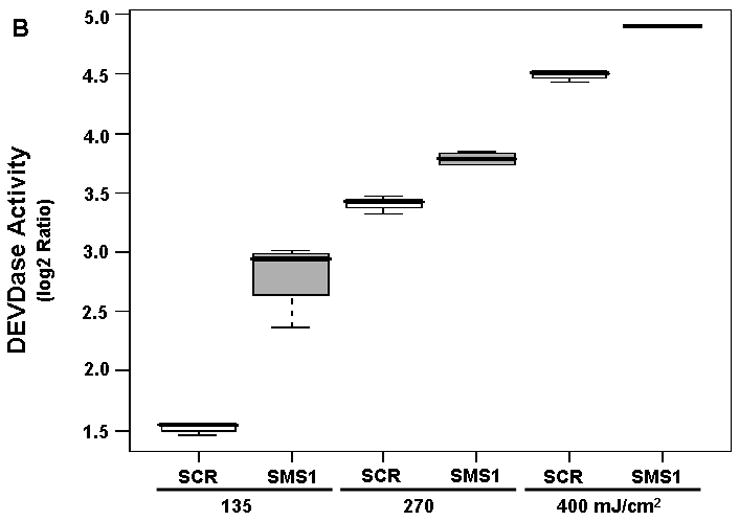
Similar experiments were performed in SMS2 siRNA-transfectants. As shown in Figure 6A, the enzyme activity was downregulated in SMS2 siRNA-transfectants. Based on the calculated FCG value of 0.67 (not shown), the enzyme activity was reduced by 49% in SMS2 siRNA-transfectants. For DEVDase, there was an overall 61% increase in the enzyme activity per 100 units of light fluence in both cell types (Table 3). Importantly, DEVDase activity was enhanced by 53% post-PDT in SMS2 siRNA-transfectants compared to their controls (Table 3; Fig. 6B). The data show that, PDT triggered a dose-dependent DEVDase activation in both cell types, and that compared to scrambled siRNA-transfectants the response was promoted in SMS2 siRNA-transfectants.
Figure 6.
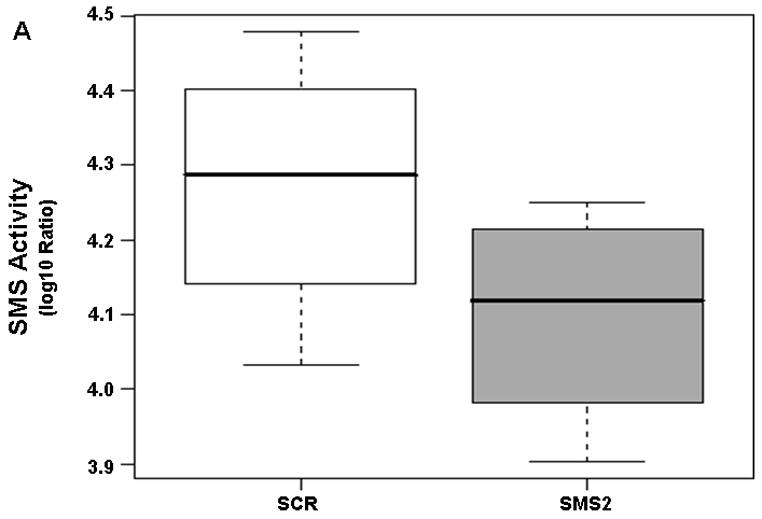

(A) SMS is downregulated in SMS2 siRNA-transfectants. Cells were transfected with SMS2- or scrambled siRNA as described in “Material and Methods”. Two days after transfection, cells were collected and seeded in fresh growth medium with or without Pc 4 (200 nM). Following overnight exposure to Pc 4, cells were harvested, and the enzyme activity was determined in cell lysates as described in “Material and Methods”. (B) PDT-triggered activation of DEVDase is promoted in SMS2 siRNA-transfected Jurkat cells. Forty-eight hours after transfection, the cells were treated overnight with Pc 4 (200 nM), irradiated at the indicated light fluences and then incubated for 2 h. After the cells were harvested, DEVDase activity was measured in cell lysates spectrofluorimetrically using DEVD-AMC as the substrate. Three-five independent determinations of the enzyme were performed. The Y-axis shows log2 ratios for the enzyme as a function of both group and dose variable. SCR, scrambled siRNA-transfectants; SMS2, SMS2 siRNA -transfectants.
Discussion
The present study shows for the first time that downregulation of SMS1 is associated with enhanced accumulation of proapoptotic sphingolipids and promotion of apoptosis after PDT. The correlation between PDT, proapoptotic sphingolipids, and apoptosis is further supported by the evidence that all twelve dihydroceramides, ten out of twelve ceramides, and sphingosine showed a dose-dependent increase to PDT. Moreover, the present study indicates that the sphingolipid balance is reset by SMS1 downregulation in favor of the enhanced accumulation of proapoptotic ceramide, dihydroceramide and sphingosine, and the decrease in the antiapoptotic sphingosine-1-phosphate, with concomitant promotion of apoptosis post-PDT. The cellular balance between proapoptotic ceramide and antiapoptotic sphingosine-1-phosphate has been proposed to be critical for the life or death of the cell [25].
Three long-chain dihydroceramides (i.e., C22-, C24-, and C24:1-dihydroceramide) and five long-fatty acyl chain ceramides (i.e., C22-, C24-, C24:1-, C26-, and C26:1-ceramide) show enhanced increase to PDT in cells with downregulated SMS1, suggesting potential selectivity. Similarly, C24-ceramide has been associated with apoptosis [26]. The biological significance of specific fatty acyl chains in ceramides remains to be established.
Besides dihydroceramides, PDT also induced a dose-dependent increase in dihydrosphingosine, another precursor from the de novo sphingolipid biosynthesis. The data are consistent with the notion that the de novo sphingolipid pathway is a PDT target. The idea is supported by our previously published evidence [14–16,23].
A dose-dependent increase of sphingosine-1-phosphate, a product of sphingosine kinase, was triggered by PDT. It is unlikely that sphingosine kinase is a target of the primary photodamage since the enzyme is primarily found in the cytosol [27], where Pc 4 is not found. Pc 4 localizes to intracellular membranes, e.g., mitochondria, the ER and Golgi, but not the plasma membrane or nuclear membrane [28]. The primary photodamage, most likely via singlet oxygen, occurs where Pc 4 is localized. This is so because singlet oxygen has a short lifetime (<0.04 μs) and, consequently, a short radius of action (0.02 μm) [29], and it will remain at the site of origin, e.g., in the Golgi. If there is an effect of PDT on sphingosine kinase, it could be a secondary effect, e.g., from the oxidative damage to mitochondria with subsequent inhibition of electron transport [30–32] and generation of superoxide. Although there is evidence to the contrary [33], superoxide can diffuse from mitochondria to cytosol [34], and presumably affect sphingosine kinase. Incidentally, we have shown that manganese superoxide dismutase, the scavenger of superoxide produced by mitochondrial electron transport, affects sensitivity of cells to PDT, suggesting the involvement of superoxide [23].
Previously we proposed that, in the absence of SPT activation, inhibition of SMS is associated with increased accumulation of de novo ceramide [16]. In this study we show that SMS1 downregulation was accompanied by increased accumulation of ceramides and dihydroceramides without a change in the extent of inhibition of SMS by PDT. In addition, there was a lack of correlation between SMS activity and sphingomyelins in both cell types. Besides SMS, sphingomyelinase [1] and ethanolamine phosphorylceramide synthase [35] can be involved in regulation of sphingomyelin levels. Overall, the data suggest that following photodamage in the cells with downregulated SMS1, the activities of enzymes other than SMS are affected.
We have shown that SMS1-overexpressing cells are resistant to apoptosis after PDT [17]. Here we demonstrate that downregulation of SMS1, as well as SMS2, correlates with apoptotic sensitization to PDT. In agreement with our findings, others have shown a correlation between apoptotic resistance and increased SMS activity [36,37]. However, there is evidence to the contrary, i.e., siRNA interference-dependent downregulation of SMS1 is accompanied by apoptotic resistance [8–10]. The discrepancy regarding the role of SMS in apoptosis could be due to different stimuli and/or different cell types used in these studies, with potentially different underlying mechanisms. Similarly, we have shown that the effects of PDT on de novo ceramide metabolism could not be completely reproduced either by another proapoptotic agent in the same cell type [38] or by PDT itself in two different cell types [16]. Regardless, our findings imply that both SMS1 and SMS2 are PDT molecular targets with a potential of regulating apoptosis.
Acknowledgments
This work was supported by U.S. Public Health Service Grant R01 CA77475 from the National Cancer Institute, National Institutes of Health. The mass spectroscopy-related work was done at the Lipidomics Core (Department of Biochemistry and Molecular Biology, Medical University of South Carolina, Charleston), a facility supported by the U.S. Public Health Service Grant C06 RR018823 from the Extramural Research Facilities Program, National Center for Research Resources.
Footnotes
Publisher's Disclaimer: This is a PDF file of an unedited manuscript that has been accepted for publication. As a service to our customers we are providing this early version of the manuscript. The manuscript will undergo copyediting, typesetting, and review of the resulting proof before it is published in its final citable form. Please note that during the production process errors may be discovered which could affect the content, and all legal disclaimers that apply to the journal pertain.
References
- 1.Hannun YA, Luberto C, Argraves KM. Enzymes of sphingolipid metabolism: from modular to integrative signaling. Biochemistry. 2001;40:4893–4903. doi: 10.1021/bi002836k. [DOI] [PubMed] [Google Scholar]
- 2.Hanada K. Serine palmitoyltransferase, a key enzyme of sphingolipid metabolism. Biochim Biophys Acta. 2003;1632:16–30. doi: 10.1016/s1388-1981(03)00059-3. [DOI] [PubMed] [Google Scholar]
- 3.Kester M, Kolesnick R. Sphingolipids as therapeutics. Pharmacol Res. 2003;47:365–371. doi: 10.1016/s1043-6618(03)00048-3. [DOI] [PubMed] [Google Scholar]
- 4.Zheng W, Kollmeyer J, Symolon H, Momin A, Munter E, Wang E, Kelly S, Allegood JC, Liu Y, Peng Q, Ramaraju H, Sullards MC, Cabot M, Merrill AH., Jr Ceramides and other bioactive sphingolipid backbones in health and disease: lipidomic analysis, metabolism and roles in membrane structure, dynamics, signaling and autophagy. Biochim Biophys Acta. 2006;1758:1864–1884. doi: 10.1016/j.bbamem.2006.08.009. [DOI] [PubMed] [Google Scholar]
- 5.Huitema K, Van Den Dikkenberg J, Brouwers JF, Holthuis JC. Identification of a family of animal sphingomyelin synthases. Embo J. 2004;23:33–44. doi: 10.1038/sj.emboj.7600034. [DOI] [PMC free article] [PubMed] [Google Scholar]
- 6.Li Z, Hailemariam TK, Zhou H, Li Y, Duckworth DC, Peake DA, Zhang Y, Kuo MS, Cao G, Jiang XC. Inhibition of sphingomyelin synthase (SMS) affects intracellular sphingomyelin accumulation and plasma membrane lipid organization. Biochim Biophys Acta. 2007;1771:1186–1194. doi: 10.1016/j.bbalip.2007.05.007. [DOI] [PMC free article] [PubMed] [Google Scholar]
- 7.Tafesse FG, Huitema K, Hermansson M, van der Poel S, van den Dikkenberg J, Uphoff A, Somerharju P, Holthuis JC. Both sphingomyelin synthases SMS1 and SMS2 are required for sphingomyelin homeostasis and growth in human HeLa cells. J Biol Chem. 2007;282:17537–17547. doi: 10.1074/jbc.M702423200. [DOI] [PubMed] [Google Scholar]
- 8.Ding T, Li Z, Hailemariam T, Mukherjee S, Maxfield FR, Wu MP, Jiang XC. SMS overexpression and knockdown: impact on cellular sphingomyelin and diacylglycerol metabolism, and cell apoptosis. J Lipid Res. 2008;49:376–385. doi: 10.1194/jlr.M700401-JLR200. [DOI] [PubMed] [Google Scholar]
- 9.Van der Luit AH, Budde M, Zerp S, Caan W, Klarenbeek JB, Verheij M, Van Blitterswijk WJ. Resistance to alkyl-lysophospholipid-induced apoptosis due to downregulated sphingomyelin synthase 1 expression with consequent sphingomyelin-and cholesterol-deficiency in lipid rafts. Biochem J. 2007;401:541–549. doi: 10.1042/BJ20061178. [DOI] [PMC free article] [PubMed] [Google Scholar]
- 10.van der Luit AH, Vink SR, Klarenbeek JB, Perrissoud D, Solary E, Verheij M, van Blitterswijk WJ. A new class of anticancer alkylphospholipids uses lipid rafts as membrane gateways to induce apoptosis in lymphoma cells. Mol Cancer Ther. 2007;6:2337–2345. doi: 10.1158/1535-7163.MCT-07-0202. [DOI] [PubMed] [Google Scholar]
- 11.Carracedo A, Geelen MJ, Diez M, Hanada K, Guzman M, Velasco G. Ceramide sensitizes astrocytes to oxidative stress: protective role of cannabinoids. Biochem J. 2004;380:435–440. doi: 10.1042/BJ20031714. [DOI] [PMC free article] [PubMed] [Google Scholar]
- 12.Castano AP, Mroz P, Hamblin MR. Photodynamic therapy and anti-tumour immunity. Nat Rev Cancer. 2006;6:535–545. doi: 10.1038/nrc1894. [DOI] [PMC free article] [PubMed] [Google Scholar]
- 13.Miller JD, Baron ED, Scull H, Hsia A, Berlin JC, McCormick T, Colussi V, Kenney ME, Cooper KD, Oleinick NL. Photodynamic therapy with the phthalocyanine photosensitizer Pc 4: the case experience with preclinical mechanistic and early clinical-translational studies. Toxicol Appl Pharmacol. 2007;224:290–299. doi: 10.1016/j.taap.2007.01.025. [DOI] [PMC free article] [PubMed] [Google Scholar]
- 14.Wispriyono B, Schmelz E, Pelayo H, Hanada K, Separovic D. A role for the de novo sphingolipids in apoptosis of photosensitized cells. Exp Cell Res. 2002;279:153–165. doi: 10.1006/excr.2002.5599. [DOI] [PubMed] [Google Scholar]
- 15.Dolgachev V, Nagy B, Taffe B, Hanada K, Separovic D. Reactive oxygen species generation is independent of de novo sphingolipids in apoptotic photosensitized cells. Exp Cell Res. 2003;288:425–436. doi: 10.1016/s0014-4827(03)00235-0. [DOI] [PubMed] [Google Scholar]
- 16.Dolgachev V, Farooqui MS, Kulaeva OI, Tainsky MA, Nagy B, Hanada K, Separovic D. De novo ceramide accumulation due to inhibition of its conversion to complex sphingolipids in apoptotic photosensitized cells. J Biol Chem. 2004;279:23238–23249. doi: 10.1074/jbc.M311974200. [DOI] [PubMed] [Google Scholar]
- 17.Separovic D, Hanada K, Maitah MY, Nagy B, Hang I, Tainsky MA, Kraniak JM, Bielawski J. Sphingomyelin synthase 1 suppresses ceramide production and apoptosis post-photodamage. Biochem Biophys Res Commun. 2007;358:196–202. doi: 10.1016/j.bbrc.2007.04.095. [DOI] [PMC free article] [PubMed] [Google Scholar]
- 18.Bielawski J, Szulc ZM, Hannun YA, Bielawska A. Simultaneous quantitative analysis of bioactive sphingolipids by high-performance liquid chromatography-tandem mass spectrometry. Methods. 2006;39:82–91. doi: 10.1016/j.ymeth.2006.05.004. [DOI] [PubMed] [Google Scholar]
- 19.Futerman AH, Stieger B, Hubbard AL, Pagano RE. Sphingomyelin synthesis in rat liver occurs predominantly at the cis and medial cisternae of the Golgi apparatus. J Biol Chem. 1990;265:8650–8657. [PubMed] [Google Scholar]
- 20.Luberto C, Toffaletti DL, Wills EA, Tucker SC, Casadevall A, Perfect JR, Hannun YA, Del Poeta M. Roles for inositol-phosphoryl ceramide synthase 1 (IPC1) in pathogenesis of C. neoformans. Genes Dev. 2001;15:201–212. doi: 10.1101/gad.856001. [DOI] [PMC free article] [PubMed] [Google Scholar]
- 21.Chambers JM, Hastie TJ. Statistical Models. S, Wadsworth & Brooks/Cole; Pacific Grove: 1992. [Google Scholar]
- 22.Benjamini Y, Hochberg Y. Controlling the false discovery rate: a practical and powerful approach to multiple testing. J Royal Stat Soc B. 1995;57:289–300. [Google Scholar]
- 23.Dolgachev V, Oberley LW, Huang TT, Kraniak JM, Tainsky MA, Hanada K, Separovic D. A role for manganese superoxide dismutase in apoptosis after photosensitization. Biochem Biophys Res Commun. 2005;332:411–417. doi: 10.1016/j.bbrc.2005.04.141. [DOI] [PubMed] [Google Scholar]
- 24.Hengartner MO. The biochemistry of apoptosis. Nature. 2000;407:770–776. doi: 10.1038/35037710. [DOI] [PubMed] [Google Scholar]
- 25.Spiegel S, Milstien S. Sphingosine-1-phosphate: signaling inside and out. FEBS Lett. 2000;476:55–57. doi: 10.1016/s0014-5793(00)01670-7. [DOI] [PubMed] [Google Scholar]
- 26.Kroesen BJ, Jacobs S, Pettus BJ, Sietsma H, Kok JW, Hannun YA, de Leij LF. BcR-induced apoptosis involves differential regulation of C16 and C24-ceramide formation and sphingolipid-dependent activation of the proteasome. J Biol Chem. 2003;278:14723–14731. doi: 10.1074/jbc.M210756200. [DOI] [PubMed] [Google Scholar]
- 27.Pyne S, Pyne NJ. Sphingosine 1-phosphate signalling in mammalian cells. Biochem J. 2000;349:385–402. doi: 10.1042/0264-6021:3490385. [DOI] [PMC free article] [PubMed] [Google Scholar]
- 28.Lam M, Oleinick NL, Nieminen AL. Photodynamic therapy-induced apoptosis in epidermoid carcinoma cells. Reactive oxygen species and mitochondrial inner membrane permeabilization. J Biol Chem. 2001;276:47379–47386. doi: 10.1074/jbc.M107678200. [DOI] [PubMed] [Google Scholar]
- 29.Moan J, Berg K. The photodegradation of porphyrins in cells can be used to estimate the lifetime of singlet oxygen. Photochem Photobiol. 1991;53:549–553. doi: 10.1111/j.1751-1097.1991.tb03669.x. [DOI] [PubMed] [Google Scholar]
- 30.Gibson SL, Hilf R. Interdependence of fluence, drug dose and oxygen on hematoporphyrin derivative induced photosensitization of tumor mitochondria. Photochem Photobiol. 1985;42:367–373. doi: 10.1111/j.1751-1097.1985.tb01583.x. [DOI] [PubMed] [Google Scholar]
- 31.Musser DA, Oseroff AR. The use of tetrazolium salts to determine sites of damage to the mitochondrial electron transport chain in intact cells following in vitro photodynamic therapy with Photofrin II. Photochem Photobiol. 1994;59:621–626. doi: 10.1111/j.1751-1097.1994.tb09666.x. [DOI] [PubMed] [Google Scholar]
- 32.Varnes ME, Chiu SM, Xue LY, Oleinick NL. Photodynamic therapy-induced apoptosis in lymphoma cells: translocation of cytochrome c causes inhibition of respiration as well as caspase activation. Biochem Biophys Res Commun. 1999;255:673–679. doi: 10.1006/bbrc.1999.0261. [DOI] [PubMed] [Google Scholar]
- 33.Missirlis F, Hu J, Kirby K, Hilliker AJ, Rouault TA, Phillips JP. Compartment-specific protection of iron-sulfur proteins by superoxide dismutase. J Biol Chem. 2003;278:47365–47369. doi: 10.1074/jbc.M307700200. [DOI] [PubMed] [Google Scholar]
- 34.Han D, Antunes F, Canali R, Rettori D, Cadenas E. Voltage-dependent anion channels control the release of the superoxide anion from mitochondria to cytosol. J Biol Chem. 2003;278:5557–5563. doi: 10.1074/jbc.M210269200. [DOI] [PubMed] [Google Scholar]
- 35.Malgat M, Maurice A, Baraud J. Sidedness of ceramide-phosphoethanolamine synthesis on rat liver and brain microsomal membranes. J Lipid Res. 1987;28:138–143. [PubMed] [Google Scholar]
- 36.Itoh M, Kitano T, Watanabe M, Kondo T, Yabu T, Taguchi Y, Iwai K, Tashima M, Uchiyama T, Okazaki T. Possible role of ceramide as an indicator of chemoresistance: decrease of the ceramide content via activation of glucosylceramide synthase and sphingomyelin synthase in chemoresistant leukemia. Clin Cancer Res. 2003;9:415–423. [PubMed] [Google Scholar]
- 37.Yang Z, Khoury C, Jean-Baptiste G, Greenwood MT. Identification of mouse sphingomyelin synthase 1 as a suppressor of Bax-mediated cell death in yeast. FEMS Yeast Res. 2006;6:751–762. doi: 10.1111/j.1567-1364.2006.00052.x. [DOI] [PubMed] [Google Scholar]
- 38.Separovic D, Wang S, Awad Maitah MY, Hanada K, Kessel D. Ceramide response post-photodamage is absent after treatment with HA14-1. Biochem Biophys Res Commun. 2006;345:803–808. doi: 10.1016/j.bbrc.2006.04.131. [DOI] [PMC free article] [PubMed] [Google Scholar]