Abstract
An acoustic boundary element model is used to simulate sound propagation in the lung parenchyma and surrounding chest wall. It is validated theoretically and numerically and then compared with experimental studies on lung-chest phantom models that simulate the lung pathology of pneumothorax. Studies quantify the effect of the simulated lung pathology on the resulting acoustic field measured at the phantom chest surface. This work is relevant to the development of advanced auscultatory techniques for lung, vascular, and cardiac sounds within the torso that utilize multiple noninvasive sensors to create acoustic images of the sound generation and transmission to identify certain pathologies.
1 Introduction
1.1 Background
Passive listening (auscultation) has been used qualitatively by physicians for hundreds of years to aid in the monitoring and diagnosis of a wide range of medical conditions, including those involving the pulmonary system (breath sounds), the cardiovascular system (e.g., heart sounds and bruits caused by partially occluded arteries and arteriovenous grafts), and the gastrointestinal system. There may be unique and diagnostically important information in audible frequency sound since characteristic times for many physiological processes and anatomical structural resonances are in that range [1]. This approach offers several potential advantages including noninvasiveness, safety, availability, prompt results, and low cost, making it suitable for in-office checkups, outpatient home monitoring, the ER, and field operations following natural or man-made catastrophes. Simple stethoscopic use is skill dependent, provides qualitative rather than quantitative information at only a single location, and suffers from inherent limitations of human ability to discern certain acoustic differences. In recent years, many researchers have applied more quantitative measurement and analysis techniques to increase the diagnostic utility of this approach, utilizing electronic sensors and applying computational signal processing and statistical analyses to the measured signals to discern trends or biases correlated with pathologies [2–14].
To reap the full potential of the inherently rich source of diagnostic information within the audible frequency regime will require a better fundamental understanding of (1) the acoustic source and its relation to pathology, (2) the acoustic path from the source to the sensor, which can be far more complex at sonic than ultrasonic (US) frequencies due to the potential for multiple reflections, multiple propagating wave types, and multipath behavior, and (3) the use of more accurate and multiple measurement sensors. (4) It could also require more sophisticated and spatially resolved computational processing of the measured signals that considers multipath propagation of the acoustic event from its source to the sensor location to reconstruct a sonic image ingrained with quantitative information.
Alterations in the structure and function of the pulmonary system that occur in disease or injury often give rise to measurable changes in lung sound production and transmission. Lung sounds are known to contain spatial information that can be accessed using simultaneous acoustic measurements at multiple locations. It has been shown that lung consolidation, pneumothorax, and airway obstruction, to name a few conditions, alter the production and/or transmission of sound with spectrally and regionally differing effects that, if properly quantified, might provide additional information about the severity and location of the trauma or pathology [7–10]. Indeed, simultaneous, multisensor auscultation methods have been developed to “map” sounds on the thoracic surface by several groups [9,11–14], and in some cases to then attempt to triangulate upon the interior location(s) of the sound sources by assuming that the sounds propagate away from the source with spherical symmetry in speed and attenuation [10]. This “ray acoustics” approach neglects multiple reflections, multiple path, and standing wave behavior.
In modeling the transmission of sound throughout the pulmonary system and chest region, the system may be viewed as having two main components: (1) transmission in air through the tracheobronchial tree and (2) coupling to and transmission through the surrounding biological tissues to reach the chest surface, namely, the parenchyma, free air, or water/blood region (in the case of a pneumothorax or hydro/hemothorax), surrounding muscle and rib cage regions, and outer soft tissues. Many studies have focused on the transmission of sound in the respiratory tract, the tracheobronchial airway tree, with some also considering coupling to modes of wave propagation in the parenchyma. See Ref. [15] for a review of this literature. The focus of the present study is related to the second component, transmission through the surrounding biological tissues to reach the chest surface. Previous studies of this part of the problem have assumed simplified geometries and homogenized material properties [15–17]. Wodicka et al. [16] assumed an axisymmetric cylindrical geometry, with the outer tissue regions of the chest treated simply as a mass load on the parenchyma. In Ref. [17], an axisymmetric layered model for the torso region is used that includes annular regions for the parenchyma, rib cage region, soft outer tissue, and skin. In previous work of the authors [15], simplifications of both airway and tissue structures were imposed that resulted in an axisymmetric assumption or two-dimensional planar model assumption that could be easily handled with finite element analysis.
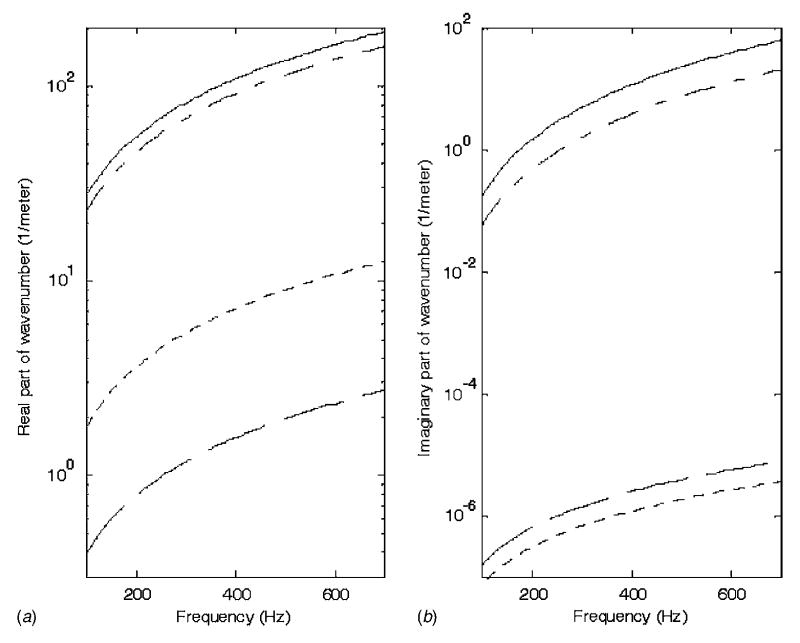
For frequencies above 100 Hz and neglecting the larger segments of the bronchial airway tree, it has been proposed that parenchymal tissue can be modeled as a homogenous isotropic material supporting acoustic compression waves only, i.e., a lossy fluid [16,18]. The parenchymal region is defined by its density ρp and a complex wave number kp, whose real part is linked to phase speed and whose imaginary part defines attenuation. Typical property values provided in the literature are given in Table 1 and used to generate Fig. 1. Theoretical values of Wodicka et al. [16] are based on calculating effective elasticity, viscosity, and density by assuming that the parenchyma can be approximated as a closed cell porous material, and by knowing the individual properties of the solid tissue and air that comprise it. Compression wave numbers for the parenchymal material are quite different from those of the two components of which it is comprised, soft tissue and air; correspondingly, in the lung parenchyma, sound travels much slower and attenuates rapidly.
Table 1.
Acoustic properties of foam phantom and human lung tissue
| Density ρ (kg/m3) | Phase Speed cph (m/s) | Attenuation in 10 cm (dB) (100–700Hz) | |
|---|---|---|---|
| Foama | 160 | 27.5 | 0.053–18 |
| Lungb | 250 | 23 | 0.16–54 |
Experimentally determined by authors.
Theory [16].
Fig. 1.
Real and imaginary parts of complex wave number for (—) lung parenchyma [16], (– –) soft tissue [15], (- - -) air, and (– - –) polyurethane foam (Flex Foam-IT X)
To model acoustic compression wave propagation in the surrounding tissues of the torso, the soft tissue regions composed of fat, muscle and connective/visceral material, can be defined by a density ρt and a complex wave number kt, with ρt ≈ 1 g/cm3, and the real and imaginary parts of the wave number shown in Fig. 1 [15,16]. In these nonparenchymal soft tissue regions, shear waves may also be present. Their behavior is primarily governed by the density and the shear viscoelastic moduli. Shear wave lengths and propagation speeds at a given frequency are typically three orders of magnitude smaller than that of compression waves in the same soft tissue medium [19].
Boundary element (BE) or coupled finite element/BE methods have been used by researchers to simulate the inverse problem of magnetocardiography and electrocardiography to aid in diagnosis [20–25]. In other words, given an array of noninvasively recorded torso surface potentials or extracorporal magnetic field measurements, we reconstruct epicardial potentials or myocardial activation times. In these and other studies, the theory behind the application of a BE method involves first expressing the governing field equations including source terms, here having to do with electromagnetics, i.e., Maxwell’s equations, in terms of boundary integral equations by using Green’s theorems. Then, the boundary integral equations are approximated as a summation of coupled linear algebraic equations by replacing the integral over the boundary surfaces with a finite summation of simplified expressions over a discretized version of the surface (BE). By beginning with the governing acoustic field equations, Helmholtz equations, including source terms, the BE method can be applied to the solution of comparable acoustic problems.
A BE model for lung acoustics is preferred over a finite element model due to the computational burden of meshing the entire parenchyma region. The speed of sound in parenchymal tissue is estimated to be ~23 m/s in the frequency range of interest. This translates into wavelengths that are roughly ten times shorter than the acoustic waves in air for the same frequency. If the nominal element dimension needs to be ~1/6 of the wavelength for accuracy, the number of nodes and elements in a three-dimensional finite element solution would be enormous. For example, at 220 Hz, one would need ~270,000 degrees of freedom in a finite element model for just the left lung of the visible human male (VHM) [26]. Unlike the finite element method, a BE analysis requires only the surface of the parenchymal region to be meshed (with comparable demands on nominal element dimension), which drastically reduces the number of elements and degrees of freedom in the analysis. (Only ~4000 degrees of freedom are needed for 220 Hz for the left lung of the VHM.)
1.2 Objectives
The first objective of this study is to adapt an acoustic BE model to simulate sound propagation in the lung parenchyma. This BE model is first validated theoretically and numerically and then compared with experimental studies on a lung phantom model with simple geometry. The type of BE formulation that is used is based on the Burton–Miller integral equations [27]. The discretization and the solution of the integral equations are performed as presented in the literature on direct acoustic BE modeling [28–30].
The second objective of this study is to simulate the specific lung pathology of pneumothorax (PTX) in both numerical BE and mechanical phantom models. The phantoms are designed to evaluate the effect that PTX has on sound transmission from within the lung to its measurement on the outer chest wall.
2 Computational Modeling
2.1 Basic Theory
The BE formulation that was developed and used to generate the numerical results presented in this article is primarily based on the formulation provided by Kirkup [28,29]. Using Green’s first and second theorems, the Helmholtz equation, which governs compression wave propagation throughout the volume of a finite acoustic domain, can be expressed as a boundary integral equation
| (1) |
where
| (2) |
| (3) |
| (4) |
Here, S denotes the surface or boundary of the domain and the integrals are confined to this surface. Also, p and q are points on the boundary and G[p,q] is the Green’s function that relates how the acoustic response at Point p is affected by an acoustic point source (monopole) located at q; nq is a unit vector outward normal to the surface at Point q. The velocity potential field at Point p is denoted by ϕ[p]. The term ϕ[p]inc denotes the incident field that would exist at Point p due to a distribution of sources within the domain if no boundary were present; i.e., it is the free field solution at Point p. v[q] is the normal velocity component on the surface at Point q directed outward. The Green’s function for the linear acoustic problem assuming harmonic motion of circular frequency ω is
| (5) |
| (6) |
where R is the distance between the point of observation and the source location and k denotes the complex wave number for the acoustic medium. Boundary conditions on the domain surface S may be specified as either ϕ[p] or ∂ϕ/∂np[p] or a linear combination of these.
The surface S is approximated with a finite set of planar triangles (BE) ΔSj, j = 1, …, N, and it is assumed that ϕ and v do not change within each triangle; this is referred to as C0 collocation. Errors due to this approximation of the boundary and property values on the boundary become smaller as the number of elements used is increased. Thus,
| (7) |
| (8) |
and
| (9) |
Then, Eq. (1) can be approximated as follows:
| (10) |
The above expression is for a single location Point p. For the complete solution of the problem, one should calculate this for a point on each of the BEs, i=1,2, …, N. This leads to
| (11) |
| (12) |
| (13) |
The subscript k is added to emphasize that the k value in the Green’s function is nonzero. It will be shown that the case where k is zero will be used to evaluate certain singular conditions. The above integrals have Green’s function or its derivative in the integrand. From Eq. (5), one can see that the R value in the Green’s function will tend to zero as the observation element and source get close to each other. The integrand value will increase and the variations of the integrand within integration limits will be considerable. Therefore, high order quadrature rules should be used for integration on these elements. Since the integrand values are big, these elements would affect the result much more than the elements where the source and the observation elements are far away from each other. Considerable attention should be paid in using sufficient numbers of quadrature points in BE codes.
Furthermore, the R value is exactly zero while evaluating the diagonal elements (source and the observation point are on the same element). The integrals of the diagonal elements become singular and cannot be evaluated using regular quadrature methods. A common approach to this problem is to subtract out the singularity (reducing the strength of the singularity) by subtracting out and adding another integrand. The below equation shows how one can evaluate the diagonal elements in the [L] matrix:
| (14) |
Here, G0 denotes that the k value in the Green’s function is zero. Therefore, G0 can be expressed as
| (15) |
This expression will tend to infinity as R gets smaller. But, when two large numbers are subtracted from each other, a smaller value will be obtained and the first integral in Eq. (14) becomes regularly integrable. The second integral though is still singular and is hard to evaluate numerically; but, it has an analytical solution (28). Therefore, it is possible to evaluate the integrals corresponding to diagonal elements through a combination of numerical and analytical methods.
In the present application, a sound generated within the parenchyma region, such as due to breathing, is approximated via a finite number of fundamental acoustic sources. The incident field that would be created by these sources at the locations pi of the i=1, …, N centroids of the BEs that approximate the actual boundary is denoted by ϕinc, a vector of length N. This vector contains the analytically predicted values of the incident field caused by these sources assuming they radiated into an infinite medium. That is the ith element of this vector represents the incident field on the ith element due to sources in the medium.
In Eq., (11), ϕ and v are vectors of length N. For the problem to be solvable, one needs N boundary conditions relating ϕ and v. This can be mathematically stated as follows, where αi, βi, and fi are constants that define the boundary conditions:
| (16) |
Once the boundary condition assignments and the calculations of [M] and [L] matrices are completed, the problem can be solved using Gauss elimination or any other linear system solving method. Once the velocity potential and normal velocity components are calculated, one can also find the acoustic pressure at the surface elements using the relationship p=iρωϕ, where ρ denotes the density of the acoustic medium.
Although there is tremendous advantage in not needing the mesh inside of the domain, there is still a computational burden, the majority of it coming from the need to use higher order quadrature methods and fully populated system matrices. For elements that are far from each other, single point Gauss quadrature is sufficient; but, for elements that are close to each other, as much as 171 Gauss quadrature points have been used for accurate evaluation (asymptotic convergence) of surface integrals in some of the example cases described below.
2.2 Coupled Boundary Conditions for Surrounding Shell-Like Structure
A viscoelastic shell-like structure surrounding the BE domain can be approximated in a discretized form using, for example, a finite element (FE) approach. If the FE degrees of freedom (or master DOFs) are coincident with the BE DOFs (motion normal to each BE at its centroid), then we can write in place of Eq. (16) that
| (17) |
Here, K, M, and C are structural stiffness, mass, and damping matrices, respectively, for the surrounding shell. The N × N matrix A is diagonal, with [A]ii being the area of the ith BE. The length N vector F represents forces applied externally to the shell, such as percussive excitation at the skin surface.
Generally, K, M, and C can be nondiagonal matrices that couple the N DOFs. Simplifying assumptions though can lead to decoupled boundary conditions. For example, consider the case of an inertia load only on the elements. Suppose a layer of material of density ρs and thickness hi resided on the ith element. Then, M is diagonal with [M]ii = [A]iihiρs and K and C are neglected. If F=0, Eq. (17) reduces to
| (18) |
2.3 Simulating a Pneumothorax
PTXs typically involve a retraction of the parenchyma from the inner chest wall as free air fills the pleural space. Within the free air pocket, sound will travel at nominally 340 m/s and wavelengths of sound below 1000 Hz will exceed 34 cm. Thus, it is reasonable to approximate the trapped pocket of air as having a uniform acoustic pressure. At ~1.14 gm/cm3, its inertia effect is negligible, as compared to the parenchyma or chest wall. Consider a spherical air pocket of volume V. Then, its volumetric stiffness Kυ, which is the ratio of an external force applied to it and the resulting volume change in it, is given by Kυ = 3Bair/rυ, where Bair is the bulk modulus of air and rυ is the radius of the spherical air pocket [31]. Note that this stiffness value remains a reasonable approximation for the gas pocket even if it is not spherical. Consider that this pocket spreads over an area Aυ of the chest wall. The spring constant for the air pocket and the mass of the overlying chest wall are essentially in series. By making the crude approximation that the volumetric dilation or compression of the gas pocket does not alter Aυ, then the gas pocket and overlying chest wall mass MAυ can be represented as a spring and mass in series with spring stiffness KAυ =KυAυ. This is discretized as springs in parallel in that for each BE of area Aii that is within the region of Aυ, as its boundary condition a spring is placed of stiffness Kii_air= KυAii that on top of it has the chest wall mass for that element of Mii. Note that generally there is also the stiffness and damping of the chest wall to consider, which will couple the BE DOFs as described in the previous section. The coupling terms are ignored in the present approximate analysis, and the PTX is incorporated by altering only the diagonal terms in the mass matrix [M]ii, damping matrix [C]ii, and stiffness matrix [K]ii that overlie the PTX pocket from Mii, Cii, and Kii to
| (19) |
| (20) |
| (21) |
| (22) |
| (23) |
The response that the BE model then calculates is the normal velocity and pressure at the BE that is “beneath” the air pocket, not the normal velocity at the outer surface of the surrounding shell (chest wall). Given the velocity beneath the air pocket to be υi for the ith element, the response at the outer skin surface above the ith element υsi is calculated as follows:
| (24) |
3 Theoretical and Numerical Validation
3.1 Theoretical Validation
Results obtained using the developed BE model implemented in MATLAB® 7.0 are compared with exact theoretical solutions for an acoustic medium with lung tissue material properties (Table 1), a spherical geometry with radius r0, and a monopole source located at the center of the sphere of radius <r0 (see Fig. 1). Different boundary conditions are considered. The velocity potential at any location within the sphere is
| (25) |
where r is the distance between the monopole and the response location, and A and B are unknown coefficients that depend on the boundary conditions. The radial particle velocity in this spherically symmetric problem is
| (26) |
The boundary conditions considered are as follows: (1) fixed: υ[r=r0] =0; (2) free: ϕ[r = r0] = 0; and (3) and (4) mass loaded with hi = 4 mm, and ρs = 1 g/cm3, with shell Young’s moduli of E = 7.5 kPa and 750 kPa, respectively, with linear viscous damping proportional to stiffness with a coefficient of ζ=0.001 and Poisson’s ratio ν=0.495. Given spherical symmetry and assuming thin shell theory, for cases (3) and (4), the boundary conditions are decoupled from one another and Eq. (17) becomes
| (27) |
The BE model for this case study had 2662 elements. A wave number expression for parenchymal material follows from the references and was given in Table 1 and Fig. 1 [15,16]. Results obtained over a frequency range from 100 Hz to 700 Hz are shown in Fig. 2 for r0 = 80 mm and a = 0.1 mm with the monopole source strength set to 0.001 m3/s. There is very close agreement between the theoretical predictions and the numerical BE results for all four spherically symmetric boundary conditions that were considered.
Fig. 2.
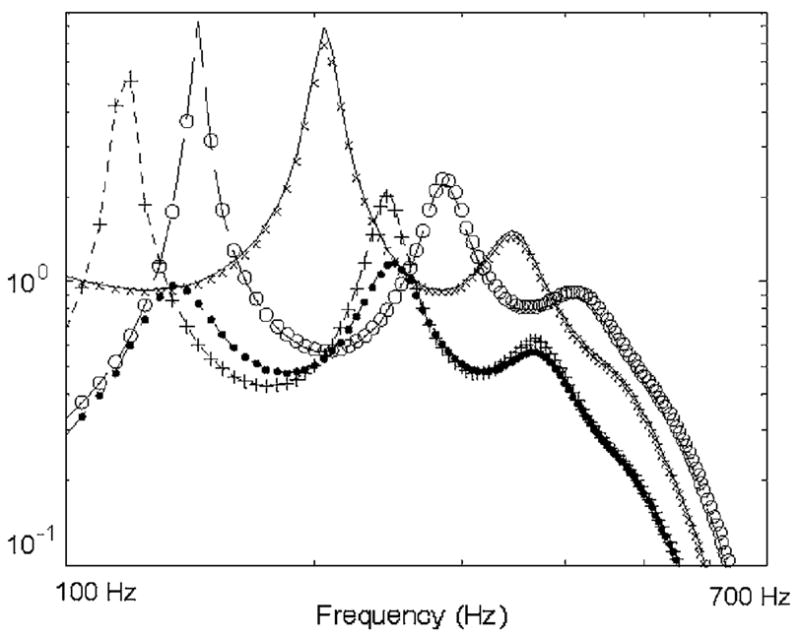
Comparison of theoretical solution with BE results for a finite monopole centered in a spherical volume. Key: (—) theory and (× × ×) BE results for velocity potential at sphere surface with fixed boundary (m2/s); (– – –) theory and (○ ○ ○) BE results for radial velocity at sphere surface with free boundary (m/s); (- - -) theory and (+ + +) BE results for radial velocity at sphere surface with “soft” tissue boundary condition (m/s); (– - –) theory and (● ● ●) BE results for radial velocity at sphere surface with “stiff” tissue boundary condition (m/s).
3.2 Numerical Validation for Pneumothorax Case
The same spherical parenchymal geometry was next used to study how a PTX alters the vibroacoustic response measured at the skin surface. In this study, a small air pocket is introduced over a small region of BEs beneath the outer “soft tissue” shell. This destroys the spherical symmetry and thus, theoretical solutions are no longer tractable. Alternatively, an axisymmetric FE model is constructed in ANSYS 9.0 that can be used to simulate the PTX pocket. This is shown in Fig. 3. A monopole source of radius 11.3 mm was located at the sphere center. A PTX was introduced in the FE model in the indicated region (top three rows of elements) by changing the material properties of the Fluid79 elements from those representing parenchymal tissue to that of free air, see Fig. 1 and Table 1.
Fig. 3.
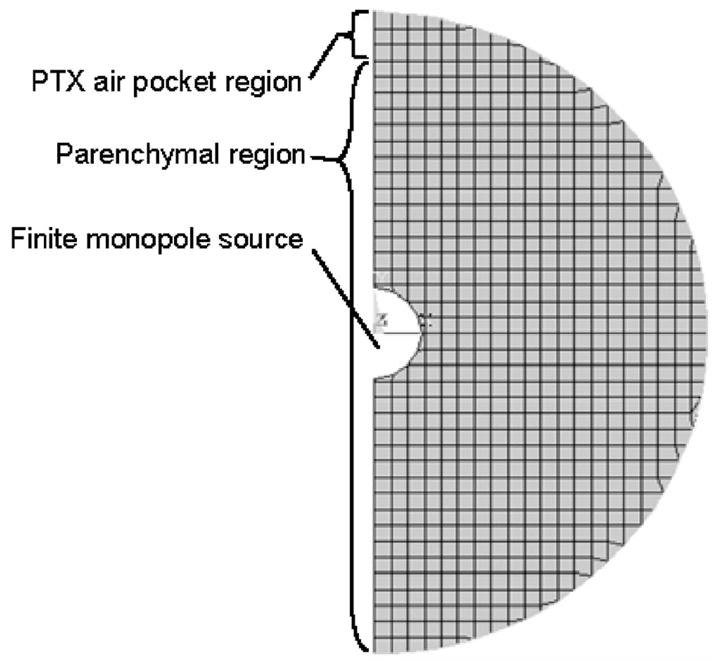
Axisymmetric FE model of spherical parenchymal region with centered monopole source, PTX air pocket, and outer (shell not shown)
The same PTX case was simulated in the BE model per the approach described in Sec. 2.3. In Fig. 4, FE and BE model predictions are compared. (Monopole source strength is adjusted to be equivalent for BE and FE cases despite different size monopoles and to be equivalent to the cases depicted in Fig. 2.) While BE and FE predictions are not as close to one another as the BE predictions and theory in the spherically symmetric cases above, the predictions are qualitatively in agreement in that, for a portion of the presented frequency range, chest motion over the PTX pocket increases in amplitude relative to the normal (no PTX) case. This increase may be surprising in that clinical experience typically has indicated a decrease in breath sounds over a PTX region. The PTX, as modeled above, essentially results in a more complex boundary condition with aspects of stiffness and inertia. Depending on their relative contributions and the frequency of interest, it is possible to have either amplification or attenuation occur. In the next section, a PTX phantom model with dimensions more comparable to the clinical condition is considered. Another observation is that the outer shell response is altered even when one is not directly over the PTX region. This is evident in both the FE and BE results and would not be predicted if a simple ray acoustics approach were used.
Fig. 4.
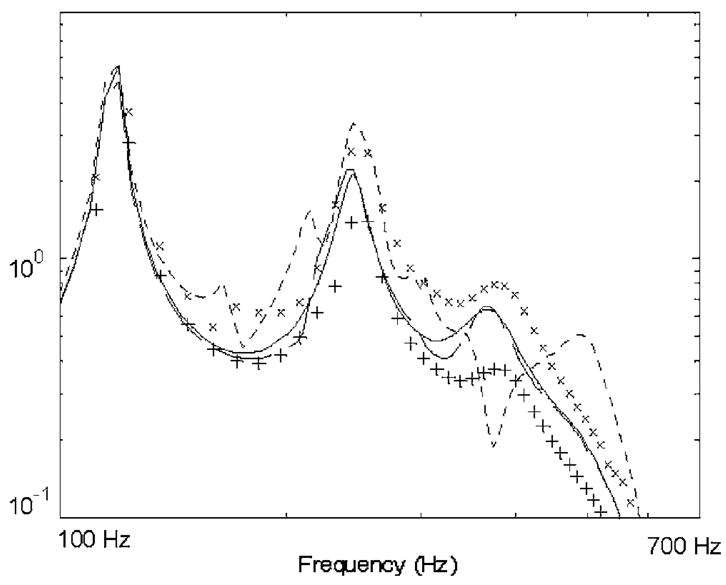
Comparison of FE and BE results for a finite monopole centered in a spherical volume of parenchymal tissue encased in a “chest wall” with a PTX air pocket as depicted in Fig. 3. Key: (—) theory for radial velocity at sphere surface with “soft” tissue boundary condition and no PTX (m/s); (- - -) BE and (× × ×) FE results for radial velocity at outer shell surface directly over PTX location; (— —) BE and (+ + +) FE results for radial velocity at outer shell surface 90 deg away from PTX location.
4 Experimental Phantom Studies
4.1 Setup
4.1.1 Model
The acoustic response to an internal source in a mechanical model with acoustic properties similar to the lung parenchyma surrounded by a soft tissue wall with integrated riblike components was investigated. The experimental phantom setup is shown in Figs. 5 and 6. The foam material is Flex Foam-IT X (Smooth-On Inc., Easton, PA). In terms of phase speed and density, the foam material is comparable to lung tissue [15,16]. A theoretical estimate of the phase speed cph, which is nondispersive over the frequency range of interest, is based on , where ρ is the effective density of the porous foam and K is the volumetric compliance given by K=(1 − fυ)Kg + fυKs, where Kg is the entrapped gas compliance, Ks is the solid material compliance, and fυ is the volume fraction of solid material. The compliance Ks is unknown, but it is reasonably assumed that, like in the lungs, this term can be neglected relative to the gas compliance Kg ≈ 1/P κ, where P is the atmospheric pressure and κ is the polytropic constant (a value of 1.0 is assumed within the frequency range of interest [16]). The content of the entrapped gas is unknown; it is a by-product of the exothermic process of forming the foam by mixing two components. But, given atmospheric pressure and based on a measured foam density of 160 kg/m3 and volume fraction of solid material of fυ =1/6, we have cph=27.5 m/s. This value was consistent with experimental measurements of phase speed conducted using a 1.5 m length, 10 cm inner diameter rigid tube filled with the foam material with embedded acoustic sensors along its length at 15 cm intervals and driven by a piston actuator at one end. The resulting real part of the wave number kR for this material is given by kR =2πf/cph=0.2285f m−1, where f is the frequency in hertz. A typical value used for lung parenchyma is cph=23 m/s, see Fig. 1 for a comparison.
Fig. 5.
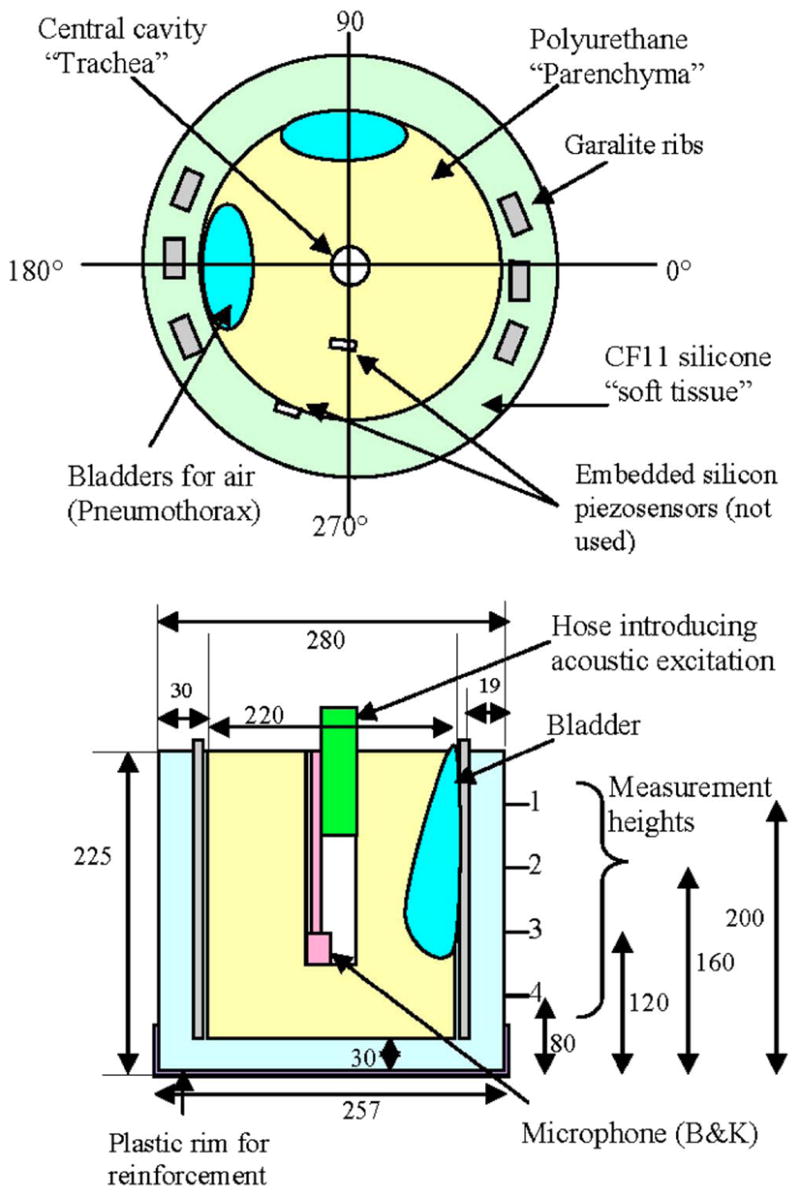
Schematic of lung and chest wall mechanical phantom. Top and side views. All dimensions in millimeters. Garalite “ribs” are 6×12×250 mm3.
Fig. 6.
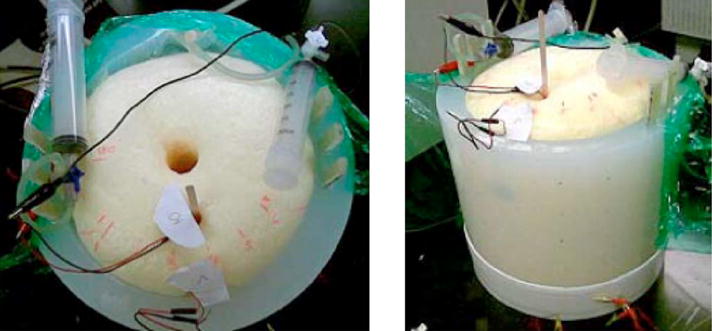
Photograph of lung and chest wall mechanical phantom. Top and side views. Images show syringes that are used for inputting air into the bladders.
Regarding attenuation, below the resonant frequencies of the entrapped gas bubbles, dissipative losses are expected to roughly be a function of the frequency f cubed and to be dependent on the foam material properties as well as the dimensions and spacing of the entrapped gas bubbles; this is difficult to measure. Consequently, experimental measurements of attenuation as a function of frequency within the same foam-filled tube were used to approximately fit an attenuation curve, yielding an imaginary component to the wave number of ki =6 × 10⁻⁸f3. For the lung parenchyma, Wodicka et al. [16] and Royston et al. [15] have used ki ≈ 18.1×10⁻⁸f3. Thus, the foam damping is about one-third that of parenchymal tissue, see Fig. 1 for a comparison. Relevant material properties for the other model components are as follows. CF-11: Young’s modulus=72 kPa, Poisson’s ratio=0.496, density=1046 kg/m3, and critical damping=0.001. Garolite: Young’s modulus=4 GPa, Poisson’s ratio=0.3, density =1900 kg/m3, and critical damping=0.002.
4.1.2 Input Excitation
A 4 in. full-range speaker was placed inside a sound proof chamber and a funnel was placed such that it covered the whole speaker. A flexible hose was connected to this funnel and it exited the sound proof chamber through a hole in the wall and entered the trachea of the phantom model, as indicated in Fig. 6, located outside of the soundproof room. The speaker was driven with random noise over the frequency range of interest. A microphone was placed at the end of the hose inside the trachea to serve as the acoustic pressure input measurement so that the dynamics introduced by the hose were eliminated from the frequency response function.
4.1.3 Surface Vibratory Motion Measurements
The measurements are made at 72 points that form a grid around the cylindrical surface of the model. There are 18 equally spaced angular positions and 4 axial positions located at the heights indicated in Fig. 5. There is a plastic rim up to 50 mm from the bottom of the model for reinforcement. The ribs centered at ~0 deg and ~180 deg are continuous throughout the height of the model. The arc of each three rib set is almost 25 deg, whereas the bladders occupy a wider arc. The bladder behind the ribs is 50 deg wide starting just above 160 and ending at almost 210 deg. The second bladder starts at 60 deg and ends at 110 deg. Both bladders extend down to the third axial measurement point from the top. All of the fourth axial level points are clear of obstructions other than the ribs. The embedded sensors also create obstructions. Both are at second level in height. The sensor embedded in the foam is at 270 deg and the sensor embedded at the CF11-foam interface is at 260 deg.
Normal velocity at the outer surface of the CF-11 was measured at the 72 discrete points using a laser Doppler vibrometer (LDV) (CLV 800/1000, Polytec, Tustin, CA) with data acquisition and spectral analysis performed using a two channel spectrum analyzer (35670A, Agilent, Palo Alto, CA). Small retroreflective pieces of tape were placed on the CF-11 at the measurement points to ensure sufficient reflected laser signal strength, as seen in Fig. 6.
4.1.4 Boundary Element Model
The BE model, including the PTX air pocket, was constructed in the same way as the spherical case described in the previous section. For this simulation, a truncated conical cylindrical mesh of 2352 BEs was used and the acoustic source was approximated via four in-phase monopole sources located along the central axis of the cylindrical region spaced 25 mm apart at heights of 37.5–112.5 mm from the foam bottom. These monopole sources had a combined source strength that could be matched to 1 Pa acoustic pressure within the finite length phantom trachea cavity, considering that it was truncated ~25 mm from the bottom and the top ~50 mm was muffled by the hose placement. Specifically, the incident field is given as [32]
| (28) |
where am =14.3 mm is the radius of each monopole and Rn is the distance from the center of the nth monopole to p. Also, μ=1 kPa is the estimated shear modulus of the lung phantom material, based on its similarity to actual lung tissue and its reported values of Young’s modulus [33]. For the given system and frequency range, the terms involving μ have an almost negligible effect.
Boundary conditions were taken to be free on the top surface and with a mass and stiffness load representing 30 mm of CF-11 on the sides and bottom. The Garalite rib density and stiffness were incorporated into the mass and stiffness matrices for the shell, and damping proportional to stiffness by a factor of 0.001 was used [34].
4.2 Results and Discussion
Selected experimental measurements on the phantom are shown in Fig. 7 with corresponding BE simulation predictions in Fig. 8. While experiment and BE predictions do not match precisely, similar trends are evident. The response amplitude of the chest wall is attenuated in a frequency-dependent fashion over the regions of the air pockets. Unlike in the spherical study above, the BE model predicts a reduction in vibroacoustic transmission, which matches the experimental measurements. The mass effect of the thicker surrounding chest wall is more dominant in this case. Also, the BE model prediction captures a resonant response around 300 Hz that is somewhat evident at all three levels shown in the experimental images of Fig. 7. But, in general, the BE model prediction seems to overpredict the lower frequency amplitude and the rate of attenuation with respect to frequency as compared to the experiment. Note also that in the experimental study, it seems that the attenuation is greater behind the bladder and ribs, as compared to behind the bladder (~180 deg versus ~80 deg). This is not supported in the numerical study. Additionally, in both the experimental and numerical studies, there appears to be no effect from these ribs by themselves located at ~0 deg. So, perhaps the differences between ~80 deg and ~180 deg are not because of the ribs, but rather are due to possible differences between the bladders or their adhesion to the foam or CF-11.
Fig. 7.
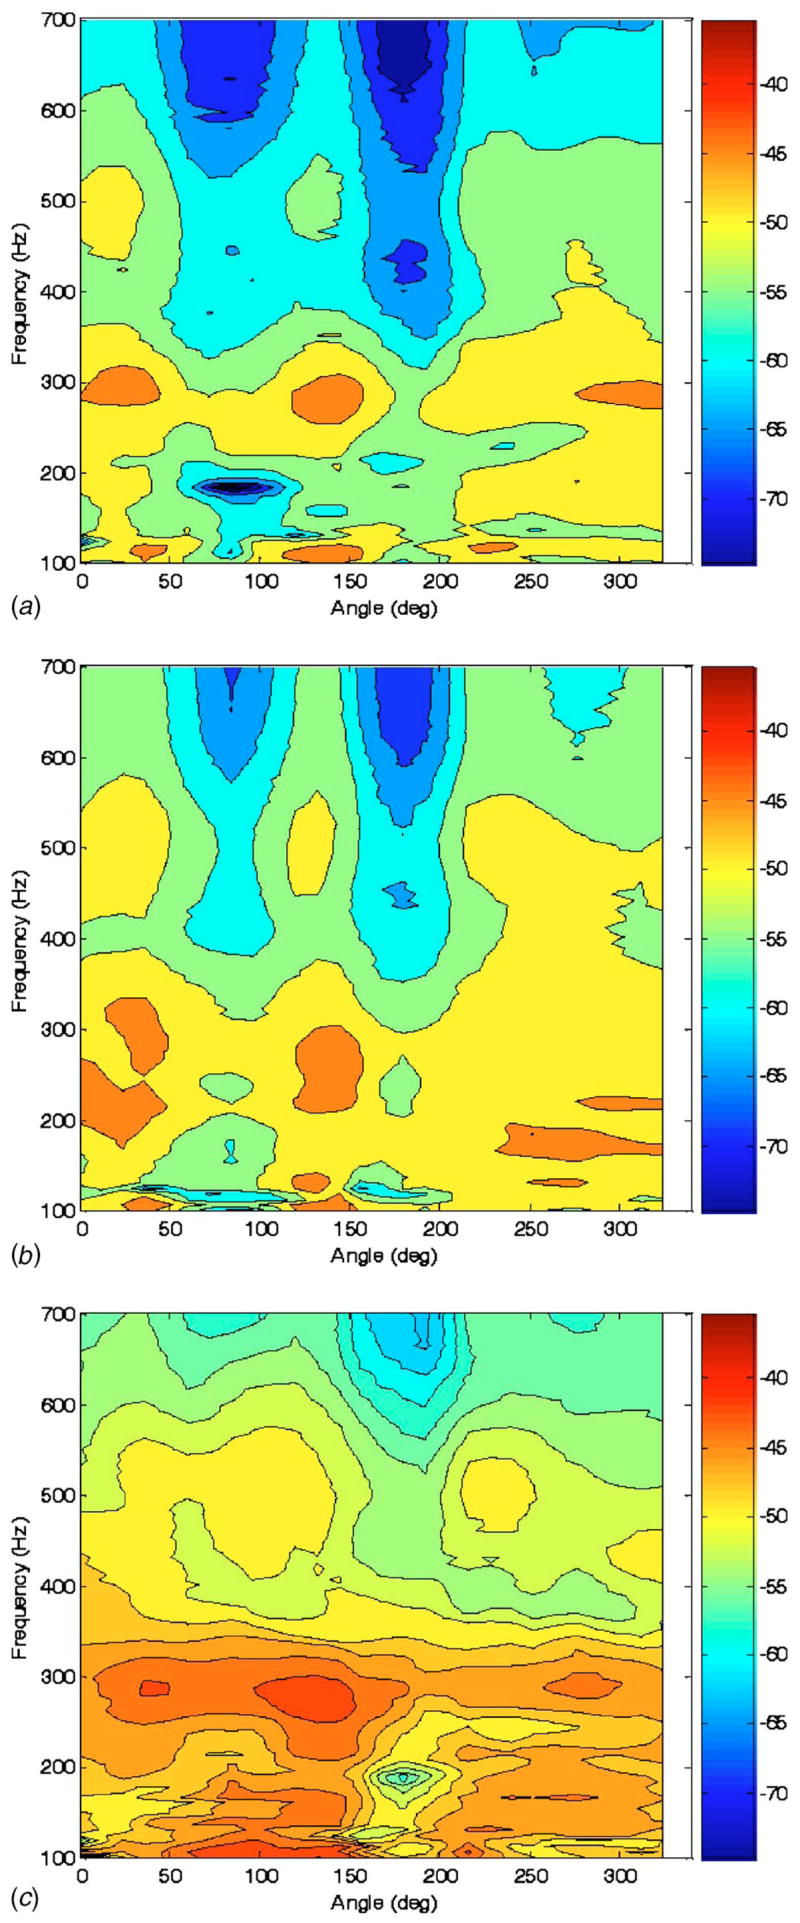
Experimental measurement of frequency response of conical surface normal velocity (color scale dB ref: 1 mm/s Pa) to “trachea” acoustic pressure excitation at three vertical heights indicated in Fig. 5 of (a) 160 mm, (b) 120 mm, and (c) 80 mm measured from the bottom of the phantom model
Fig. 8.
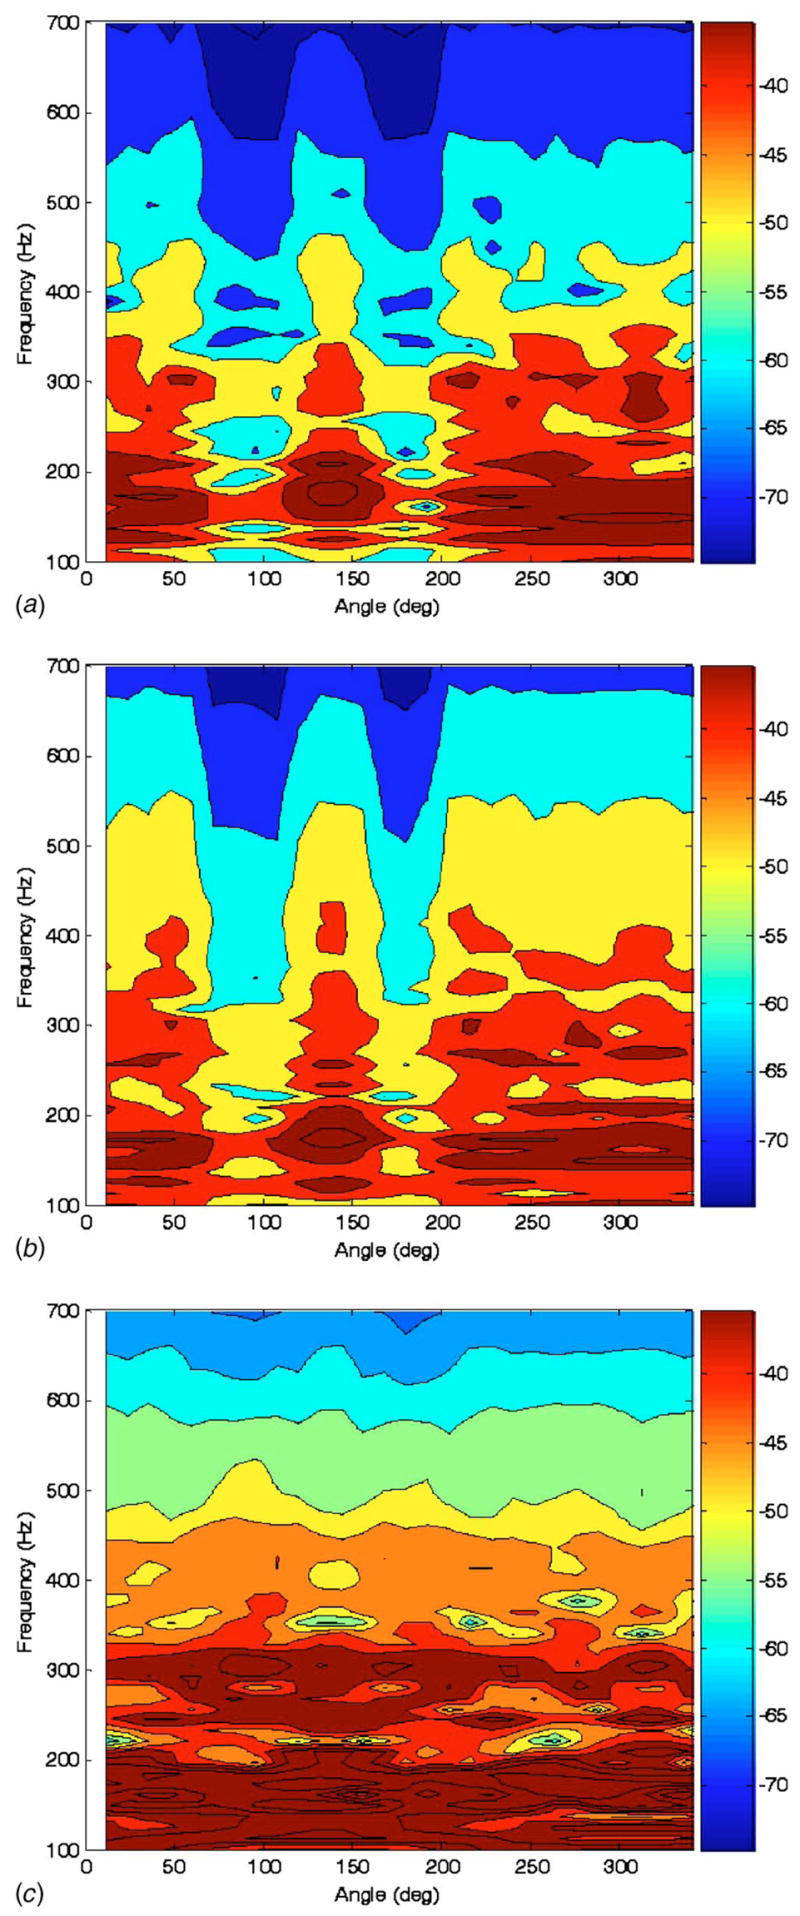
Calculated frequency response of conical surface normal velocity (color scale dB ref: 1 mm/s Pa) to “trachea” acoustic pressure excitation at three vertical heights indicated in Fig. 5 of (a) 160 mm, (b) 120 mm, and (c) 80 mm measured from the bottom of the phantom model
For further comparison, an alternative simpler prediction of the conical surface response was made by taking the incident field prediction of Eq. (28) evaluated at the foam surface and then attenuating it based on the impedance mismatch or mismatches present at a given surface location. If no PTX is present at a lung surface location, the incident velocity or velocity potential at that location is multiplied by the square root of the power transmission coefficient TLT, that is based on the acoustic impedances of the phantom lung and tissue materials. Specifically, we have [35]
| (29) |
where Zn is the characteristic impedance of the n medium equaling its density multiplied by phase speed. Here and below, n is L, P, or T for lung, air, or tissue, respectively. If a PTX is present, an additional impedance mismatch is introduced such that the incident velocity or velocity potential at that location is multiplied by the square root of the power transmission coefficient TLPT, that is,
| (30) |
Predictions based on this approach are shown in Fig. 9 in the same format as those presented in Figs. 7 and 8. (Note that where ribs were located, a modified density and phase speed was used for the tissue component based on the averaged density and phase speed through the composite soft tissue/bone/soft tissue region.) This simpler prediction method does qualitatively capture the effect of the PTX regions and shows a fairly limited effect from the ribs, similar to the experiment. But, there is far less complexity in the predicted field, as compared to experiment or the BE-based prediction. Also, this ray acoustics approach seems to overpredict the effect of the PTX at the lower frequencies of interest and does not capture any apparent standing wave phenomena, such as the apparent resonance near 300 Hz.
Fig. 9.
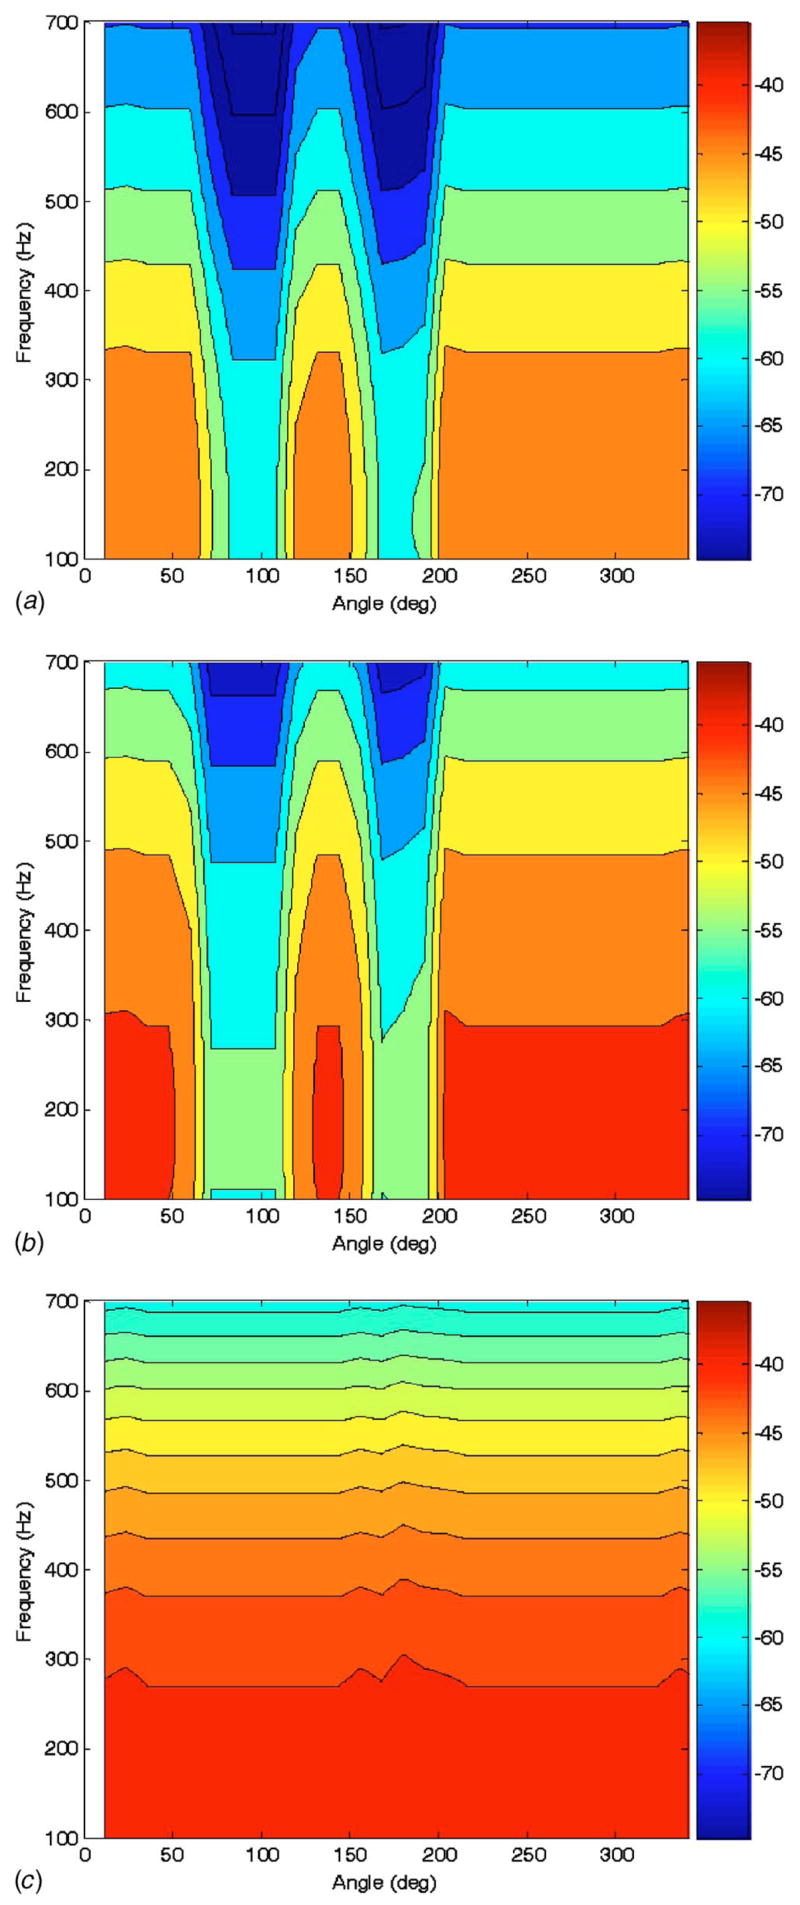
Calculated frequency response of conical surface normal velocity (color scale dB ref: 1 mm/s Pa) to “trachea” acoustic pressure excitation at three vertical heights indicated in Fig. 5 of (a) 160 mm,(b) 120 mm, and (c) 80 mm measured from the bottom of the phantom model using a simplified “ray acoustics” assumption.
There are a number of explanations for the discrepancies between experiment and the BE simulation including (1) the approximation of the acoustic pressure input to the tracheal walls as the sum of four simple monopole sources; (2) approximating the 30 mm thick CF-11 shell via “thin” shell theory within the FE environment and using only the radial DOFs of the FEs; (3) inhomogeneities in the phantom material components, particularly the polyurethane parenchyma (Flex Foam-IT X), which typically will be slightly more dense at its base due to the curing process and gravity; (4) the presence of possible “shunting” of the acoustic source to the outer phantom surface, such as via vibration of the flexible hose that delivered sound to the phantom trachea and was in “press fit” contact with the foam material at the top of the “tracheal cavity;” and (5) assuming perfect interfaces between the foam, latex bags which contained air to simulate PTXs, and/or the CF-11 outer shell material. In the experiment, these interfaces were not always perfect, which could introduce additional acoustic mismatches and scattering.
Additionally, it is surprising that the “ribs” seemed to have no effect. It is suspected that this phantom did not accurately simulate the effect of ribs in vivo because the phantom ribs were not connected to each other and did not encircle the entire torso circumference. A numerical study by Ozer et al. [36] that validated the BE model against a FE model showed that, if the ribs did completely encircle a cylindrical phantom, they significantly attenuated vibratory motion in their vicinity at the outer surface.
5 Conclusion
An acoustic BE model was used to simulate sound propagation in the lung parenchyma and surrounding chest wall. It was validated theoretically and numerically and then compared with experimental studies on a lung-chest phantom model that simulates PTX. While the numerical BE model still needs improvement to more accurately match experimental measurements, the reported studies helped to quantify the frequency-dependent effect of the simulated lung pathology on the resulting acoustic field measured at the phantom chest surface.
Acknowledgments
Support for this research from the National Institutes of Health is acknowledged (Grant Nos. EB003286 and EB008373).
Footnotes
Contributed by the Technical Committee on Vibration and Sound of ASME for publication in the Journal of Vibration and Acoustics.
Review conducted by Kon-Well Wang. Paper presented at the 2006 ASME International Mechanical Engineering Congress (IMECE2006), Chicago, IL, November 5–10, 2006.
References
- 1.Sarvazyan A. Audible-Frequency Medical Diagnostic Methods: Past, Present and Future. J Acoust Soc Am. 2005;117:2586. [Google Scholar]
- 2.Akay M, Akay Y, Welowitz W, Semmlow JL, Kostis JB. Application of Adaptive Filters to Noninvasive Acoustical Detection of Coronary Occlusions Before and After Angioplasty. IEEE Trans Biomed Eng. 1992;39:176–183. doi: 10.1109/10.121649. [DOI] [PubMed] [Google Scholar]
- 3.Pasterkamp H, Consunji-Araneta R, Oh Y, Holbrow J. Chest Surface Mapping of Lung Sounds During Methacholine Challenge. Pediatr Pulmonol. 1997;23:21–30. doi: 10.1002/(sici)1099-0496(199701)23:1<21::aid-ppul3>3.0.co;2-s. [DOI] [PubMed] [Google Scholar]
- 4.Mansy HA, Royston TJ, Sandler RH. Acoustic Characteristics of Air Cavities at Low Audible Frequencies With Application To Pneumoperitoneum Diagnosis. Med Biol Eng Comput. 2001;39:159–167. doi: 10.1007/BF02344798. [DOI] [PubMed] [Google Scholar]
- 5.Mansy HA, Royston TJ, Sandler RH. Use of Abdominal Percussion for Pneumoperitoneum Detection. Med Biol Eng Comput. 2002;40:439–446. doi: 10.1007/BF02345077. [DOI] [PubMed] [Google Scholar]
- 6.Mansy HA, Hoxie SJ, Patel NH, Sandler RH. Computerised Analysis of Auscultatory Sounds Associated With Vascular Patency of Haemodialysis Access. Med Biol Eng Comput. 2005;43:56–62. doi: 10.1007/BF02345123. [DOI] [PubMed] [Google Scholar]
- 7.Mansy HA, Balk R, Royston TJ, Sandler RH. Pneumothorax Detection Using Pulmonary Acoustic Transmission Measurements. Med Biol Eng Comput. 2002;40:520–525. doi: 10.1007/BF02345449. [DOI] [PubMed] [Google Scholar]
- 8.Mansy HA, Balk R, Royston TJ, Sandler RH. Pneumothorax Detection Using Computerized Analysis of Breath Sounds. Med Biol Eng Comput. 2002;40:526–532. doi: 10.1007/BF02345450. [DOI] [PubMed] [Google Scholar]
- 9.Pasterkamp H, Consunji-Araneta R, Oh Y, Holbrow J. Chest Surface Mapping of Lung Sounds During Methacholine Challenge. Pediatr Pulmonol. 1997;23:21–30. doi: 10.1002/(sici)1099-0496(199701)23:1<21::aid-ppul3>3.0.co;2-s. [DOI] [PubMed] [Google Scholar]
- 10.Kompis M, Pasterkamp H, Wodicka GR. Acoustic Imaging of the Human Chest. Chest. 2001;120:1309–1321. doi: 10.1378/chest.120.4.1309. [DOI] [PubMed] [Google Scholar]
- 11.Benedetto G, Dalmasso F, Spagnolo R. Surface Distribution of Crackling Sounds. IEEE Trans Biomed Eng. 1988;35:406–412. doi: 10.1109/10.1403. [DOI] [PubMed] [Google Scholar]
- 12.Bergstresser T, Ofengeim D, Vyshedskiy A, Shane J, Murphy R. Sound Transmission in the Lung as a Function of Lung Volume. J Appl Physiol. 2002;93:667–674. doi: 10.1152/japplphysiol.00050.2002. [DOI] [PubMed] [Google Scholar]
- 13.Charleston-Villalobos S, Cortes-Rubiano S, Gonzalez-Camarena R, Chi-Lem G, Aljama-Corrales T. Respiratory Acoustic Thoracic Imaging (RATHI): Assessing Deterministic Interpolation Techniques. Med Biol Eng Comput. 2004;42:618–626. doi: 10.1007/BF02347543. [DOI] [PubMed] [Google Scholar]
- 14.Paciej R, Vyshedskiy A, Shane J, Murphy R. Transpulmonary Speed of Sound Input Into the Supraclavicular Space. J Appl Physiol. 2003;94:604–611. doi: 10.1152/japplphysiol.00568.2002. [DOI] [PubMed] [Google Scholar]
- 15.Royston TJ, Zhang X, Mansy HA, Sandler RH. Modeling Sound Transmission Through the Pulmonary System and Chest With Application to Diagnosis of a Collapsed Lung. J Acoust Soc Am. 2002;111:1931–1946. doi: 10.1121/1.1452742. [DOI] [PubMed] [Google Scholar]
- 16.Wodicka GR, Stevens KN, Golub HL, Cravalho EG, Shannon DC. A Model of Acoustic Transmission in the Respiratory System. IEEE Trans Biomed Eng. 1989;36:925–934. doi: 10.1109/10.35301. [DOI] [PubMed] [Google Scholar]
- 17.Vovk IV, Grinchenko VT, Oleinik VN. Modeling the Acoustic Properties of the Chest and Measuring Breath Sounds. Acoust Phys. 1995;41:667–676. [Google Scholar]
- 18.Dunn F, Fry W. Ultrasonic Absorption and Reflection by Lung Tissue. Phys Med Biol. 1961;5:401–410. doi: 10.1088/0031-9155/5/4/302. [DOI] [PubMed] [Google Scholar]
- 19.Royston TJ, Yazicioglu Y, Loth F. Surface Response of a Viscoelastic Medium to Subsurface Acoustic Sources With Application to Medical Diagnosis. J Acoust Soc Am. 2003;113:1109–1121. doi: 10.1121/1.1536153. [DOI] [PubMed] [Google Scholar]
- 20.Bradley CP, Harris GM, Pullan AJ. The Computational Performance of a High-Order Coupled FEM/BEM Procedure in Electropotential Problems. IEEE Trans Biomed Eng. 2001;48:1238–1250. doi: 10.1109/10.959319. [DOI] [PubMed] [Google Scholar]
- 21.Cheng LK, Bodley JM, Pullan AJ. Comparison of Potential- and Activation-Based Formulations for the Inverse Problem of Electrocardiology. IEEE Trans Biomed Eng. 2003;50:11–22. doi: 10.1109/TBME.2002.807326. [DOI] [PubMed] [Google Scholar]
- 22.Fischer G, Tilg B, Modre R, Huiskamp GJM, Fetzer J, Rucker W, Wach P. A Bidomain Model Based Bem-fem Coupling Formulation for Anisotropic Cardiac Tissue. Ann Biomed Eng. 2000;28:1229–1243. doi: 10.1114/1.1318927. [DOI] [PubMed] [Google Scholar]
- 23.Lotjonen J, Magnin IE, Nenonen J, Katila T. Reconstruction of 3-D Geometry Using 2-D Profiles and a Geometric Prior Model. IEEE Trans Med Imaging. 1999;18:992–1002. doi: 10.1109/42.811311. [DOI] [PubMed] [Google Scholar]
- 24.de Munck JC, Faes TLC, Heethaar RM. The Boundary Element Method in the Forward and Inverse Problem of Electrical Impedance Tomography. IEEE Trans Biomed Eng. 2000;47:792–800. doi: 10.1109/10.844230. [DOI] [PubMed] [Google Scholar]
- 25.Pesola K, Lotjonen J, Nenonen J, Magnin IE, Lauerma K, Fenici R, Katila T. The Effect of Geometric and Topologic Differences in Boundary Element Models on Magnetocardiographic Localization Accuracy. IEEE Trans Biomed Eng. 2000;47:1237–1247. doi: 10.1109/10.867958. [DOI] [PubMed] [Google Scholar]
- 26.Visible Human Project, http://www.nlm.nih.gov/research/visible/visible_human.html.
- 27.Burton AJ, Miller GF. The Application of Integral Equation Methods to the Numerical Solution of Some Exterior Boundary Value Problems. Proc R Soc London, Ser A. 1971;323:201–210. [Google Scholar]
- 28.Kirkup S. The Boundary Element Method in Acoustics. Integrated Sound Software; West Yorkshire: 1998. [Google Scholar]
- 29.Kirkup SM. Fortran Codes for Computing Discrete Helmholtz Integral Operators. Adv Comput Math. 1998;9:391–409. [Google Scholar]
- 30.Amini S, Harris PJ, Wilton DT. Lecture Notes In Engineering. Springer-Verlag; Berlin: 1992. Coupled Boundary and Finite Element Methods for the Solution of the Dynamic Fluid-Structure Interaction Problem. [Google Scholar]
- 31.Junger MC, Feit D. Sound, Structures, and Their Interaction. Acoustical Society of America; Melville, NY: 1993. [Google Scholar]
- 32.Graff KF. Wave Motion in Elastic Solids. Oxford University Press; London: 1975. [Google Scholar]
- 33.Lai-Fook SJ, Hyatt RE. Effects of Age on Elastic Moduli of Human Lungs. J Appl Physiol. 2000;89:163–168. doi: 10.1152/jappl.2000.89.1.163. [DOI] [PubMed] [Google Scholar]
- 34.Acikgoz S, Royston TJ, Mansy HA, Sandler RH. Experimental and Numerical Simulations of Percussive Diagnosis of Lung Pathologies. ASME Design Engineering Technical Conferences, Paper No. DETC2007–34578.2007. [Google Scholar]
- 35.Finch RD. Introduction to Acoustics. Prentice-Hall; Upper Saddle River, NJ: 2005. [Google Scholar]
- 36.Ozer MB, Acikgoz S, Royston TJ, Mansy HA, Sandler RH. Boundary Element Model for Simulating Sound Propagation and Source Localization Within The Lungs. J Acoust Soc Am. 2007;122:657–671. doi: 10.1121/1.2715453. [DOI] [PubMed] [Google Scholar]


