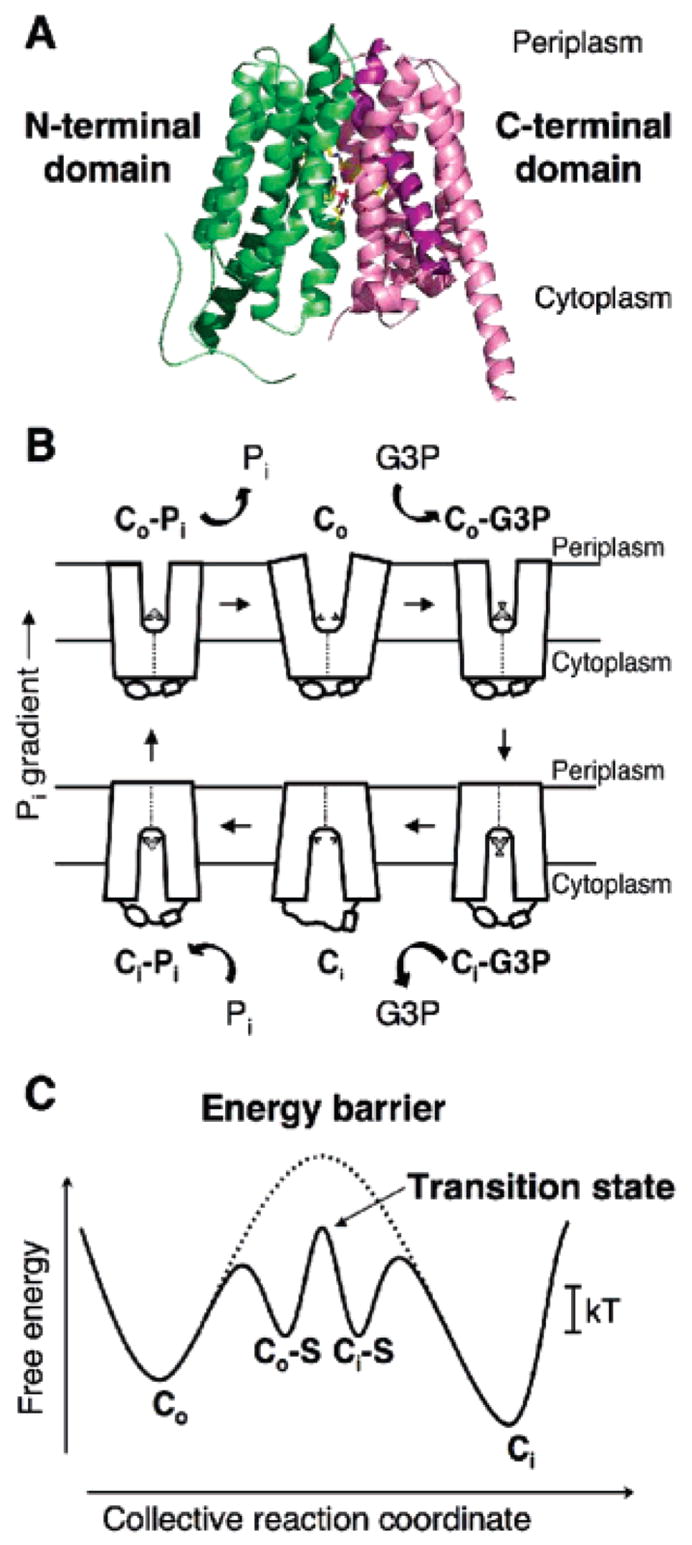
Figure 1.

Crystal structure of GlpT and the rocker-switch mechanism. (A) Ribbon diagram of GlpT viewed parallel to the membrane. The molecule consists of 12 transmembrane α-helices. The N-terminal domain is colored green, and the C-terminal domain is colored pink. (B) Schematic diagram of the single-binding site, alternating the access mechanism with a rocker-switch type of movement for the GlpT-mediated G3P–Pi exchange reaction. The diagram describes the proposed conformational changes that the transporter undergoes during the reaction cycle. Co represents the protein in the outward-facing conformation, and Ci represents the inward-facing one. The G3P substrate is represented by a small disk and triangle, and Pi is represented by a small disk. (C) Schematic free-energy diagram illustrating the energy levels of the different conformations of GlpT that occur during the transport reaction cycle under physiological conditions. In the absence of substrate binding, the energy barrier (represented by a dotted line) prevents the conformational interconversion between the Co and Ci states of the transporter. Substrate binding lowers the energy barrier sufficiently to allow Brownian motion (kT) to drive the conformational interconversion. S denotes the substrate.
