

Abstract
Amplification of the 8p11−12 region occurs in 15−20% of breast cancers, but the driving oncogene at this locus has yet to be definitively identified. We mapped the 8p11−12 amplicon in breast cancer cell lines and primary human breast cancers and identified the candidate oncogene LSM1 based on increases in copy number and expression level relative to human mammary epithelial cells. To examine the oncogenic role of LSM1, we overexpressed this gene in MCF10A mammary epithelial cells and inhibited its production in the SUM44 breast cancer cell line, which has a natural amplification and overexpression of LSM1. Our data confirmed that LSM1 is an oncogene from the 8p11−12 amplicon by showing that human Sm-like protein (hLsm1) overexpression induced growth factor-independent proliferation and soft agar colony formation in MCF10A cells, and hLsm1 inhibition in SUM44 cells dramatically reduced soft agar growth. Little is known about hLsm1 function other than its involvement in mRNA degradation; therefore, we used expression microarray analysis to investigate how hLsm1 affects cell transformation in MCF10A and SUM44 cells. We identified numerous genes altered following hLsm1 overexpression common to SUM44 breast cancer cells that play important roles in cell cycle regulation, cell proliferation and other cancer-promoting processes. Future work will continue to characterize these important changes in the hope of achieving a more complete understanding of the mechanism of hLsm1's effect on cancer progression.
Keywords: LSM1, breast cancer, chromosome 8p11−12
Introduction
An important mechanism of oncogene activation and breast cancer progression is gene amplification and overexpression. Amplification of the chromosome 8p11−12 region has been identified in 10−15% of human breast cancers and correlated with histologic grade, Ki-67 proliferation index, 5-year metastasis-free survival and poor prognosis in primary breast tumors and breast cell lines (Ray et al., 2004; Gelsi-Boyer et al., 2005). Identifying and characterizing dominant oncogenes from this region could potentially improve treatment of breast cancers with 8p11−12 amplifications, but the critical oncogenes involved in cancer progression have yet to be identified. Originally, fibroblast growth factor receptor-1 (FGFR-1) was considered the primary oncogene from this amplicon; however, a lack of correlation between FGFR-1 overexpression and amplification has suggested otherwise (Ray et al., 2004). Several recent studies improved the definition of the 8p11−12 amplicon to guide researchers in determining the essential oncogenes present in this amplicon (Ray et al., 2004; Garcia et al., 2005; Gelsi-Boyer et al., 2005; Prentice et al., 2005). Extensive mapping of the 8p11−12 amplicon by array comparative genomic hybridization, fluorescence in situ hybridization, quantitative PCR and complementary DNA (cDNA) expression microarray has generated a list of candidate genes that may play causal roles in breast cancer progression based on statistically robust correlations between amplification and overexpression (Ray et al., 2004; Yang et al., 2004; Garcia et al., 2005; Gelsi-Boyer et al., 2005; Prentice et al., 2005).
One candidate gene identified owing to a significant correlation between gene amplification and overexpression was human Sm-like protein (hLsm1) or cancer-associated Sm-like protein (CaSm). hLsm1 is a member of the Sm/Lsm family of proteins, which are involved in mRNA decapping and degradation (Zaric et al., 2005). hLsm1 forms a ring-shaped complex with other family members and targets the complex to cytoplasmic foci called P bodies, which are active sites of mRNA degradation (Zaric et al., 2005). hLsm1 overexpression has been observed in pancreatic and prostate cancers, where it is required for maintaining the transformed phenotype (Kelley et al., 2003; Fraser et al., 2005). Furthermore, our laboratory has observed hLsm1 amplification and overexpression in primary breast cancer samples and breast cancer cell lines as part of an amplified chromosome 8p11−12 region (Ray et al., 2004; Yang et al., 2004). Given the potential for hLsm1 to influence the transcriptome of cancer cells through its function in mRNA degradation, it may be critically involved in the progression of cancers with a chromosome 8p11−12 amplicon.
The potential relevance of LSM1 within this amplicon and in the context of breast cancer has yet to be evaluated; therefore, we hypothesized that hLsm1 is a critical oncogene driving the development and progression of breast cancers with this focal copy number increase. Our results show that overexpression of hLsm1 transforms mammary epithelial cells and inhibition of its expression in breast cancer cells reduces anchorage-independent proliferation. Additionally, a comparison of gene expression changes in breast cancer cells and epithelial cells with hLsm1 overexpression revealed remarkable similarities and provided insight into the mechanism of hLsm1's function. Collectively, these results support the role of LSM1 as a breast cancer oncogene and may identify critical biological interactions that lead to the development of new therapeutic targets.
Results
hLsm1 transforms mammary epithelial cells
MCF10A mammary epithelial cells were infected with an hLsm1 lentiviral expression vector and stable clones were generated from three separate infections by applying two selection pressures: antibiotic resistance and growth factor deletion. MCF10A cells depend on exogenous insulin-like growth factor (IGF) and epidermal growth factor (EGF) for activation of the IGF-I and EGF pathways required for cell growth and survival (Ethier and Moorthy, 1991; Ethier et al., 1991; Ethier, 1996). Figure 1 shows that hLsm1-transduced MCF10A cells (MCF10Lsm1) maintained their dependence on exogenous EGF, but acquired IGF-independent proliferation, indicating a transforming role for hLsm1. As shown by Western blot, hLsm1 protein was overexpressed in multiple MCF10Lsm1 clones, relative to MCF10A and vector-infected cells (MCF10LacZ), to levels similar to those in the SUM44 and SUM52 breast cancer cell lines with LSM1 amplification and over-expression (Figure 2). Furthermore, MCF10Lsm1 cells formed colonies in soft agar, unlike control MCF10LacZ cells, although less robustly than SUM44 breast cancer cells (Figure 3). These results indicate that LSM1 transforms human mammary epithelial cells both by enabling growth factor independence and soft agar colony formation.
Figure 1.
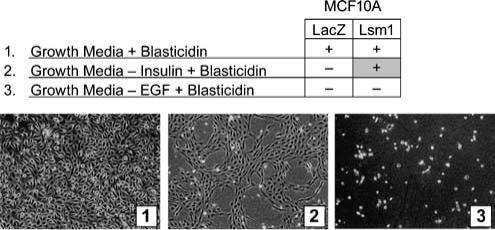
MCF10Lsm1 Cells are IGF-independent. MCF10A mammary epithelial cells were infected with hLsm1 or LacZ lentivirus and cells were selected with 10 μg/ml blasticidin. Cells infected with hLsm1 were further selected in media without the required growth factors insulin or EGF. (−−) indicates no colony growth whereas (+) indicates colony growth under the given conditions. Images 1−3 show MCF10Lsm1 clones with different selection conditions. Infections were repeated three times and at least three clones resulted from each infection with hLsm1 or LacZ.
Figure 2.

MCF10Lsm1 cells overexpress hLsm1. Protein levels of hLsm1 in MCF10Lsm1 and MCF10LacZ cell lysates were measured by Western blot and compared to hLsm1 protein levels in the breast cancer cell lines SUM225, SUM52 and SUM44. A representative blot is shown (a). Quantification of hLsm1 protein levels (b) was performed with Quantity-One software and compared to the protein expression of β-actin. All MCF10Lsm1 and MCF10LacZ clones were examined and showed similar results.
Figure 3.

hLsm1 overexpression induces growth in soft agar. MCF10Lsm1 – insulin cells, MCF10LacZ cells and SUM44 cells were plated in soft agar and given appropriate medium. After 3 weeks, medium was removed and 1 mg/ml of p-iodonitrotetrazolium violet was added overnight to stain viable cells. All MCF10Lsm1 and MCF10LacZ clones were evaluated and representative photographs of colony formation are shown.
hLsm1 siRNA functionally alters breast cancer cells
The effect of hLsm1 inhibition on breast cancer transformation was examined in the SUM44 cell line (Ethier et al., 1991; Ethier, 1996; Forozan et al., 1999) because LSM1 amplification, as well as mRNA and protein overexpression, is greater in SUM44 cells than in SUM225 and SUM52 cells (Ray et al., 2004; Figure 2). Fluorescently labeled hLsm1 short interfering RNA (siRNA) oligonucleotides were transiently transfected into SUM44 cells and the mRNA expression and protein levels of hLsm1 were evaluated. Quantitative real-time PCR (Q-RT-PCR) showed that control siRNA in SUM44 cells did not alter hLsm1 mRNA expression; however, hLsm1 siRNA reduced hLsm1 mRNA expression to levels similar to MCF10A control (Figure 4a). Western blot confirmed similar changes in hLsm1 protein levels following hLsm1 siRNA transfection as observed for mRNA expression (Figure 4b and c). Reduced hLsm1 affected SUM44 cell function by significantly decreasing growth in soft agar compared to control-transfected cells or non-transfected cells (Figure 5), which is consistent with its role as an oncogene from the 8p11−12 region.
Figure 4.

hLsm1 siRNA reduces hLsm1 mRNA and protein expression in SUM44cells. hLsm1 or control siRNA oligonucleotides (100 nmol/l) were transfected into the SUM44 cells using RNAifect. RNA or whole-cell lysates were collected 1, 2 and 3 days post transfection. (a) hLsm1 mRNA levels were measured by Q-RT-PCR in two separate reactions, each in triplicate. Cycles to threshold values for hLsm1 were normalized to values for GAPDH, then compared to MCF10A hLsm1 expression to determine fold change. (b) Protein levels of hLsm1 were measured by Western blot, quantified with Quantity-One software and compared to the protein expression of β-actin (c). Experiments were repeated at least twice and data are shown as means±standard error.
Figure 5.

hLsm1 siRNA reduces soft agar colony formation in SUM44 cells. (a) SUM44, SUM44+ control siRNA or SUM44+ hLsm1 siRNA cells were plated into soft agar 24 h after transfection. After 3 weeks, medium was removed and p-iodonitrotetrazolium violet (1 mg/ml) was added overnight to stain viable cells. (b) Colonies were counted in triplicate wells of each cell type using Quantity-One software. Experiments were repeated at least twice and data are shown as means±standard error.
Increased growth and conditioned media activity of MCF10Lsm1 cells is independent of the IGF-I pathway
Previous work suggested that hLsm1 influences the cell cycle progression of prostate cancer cells (Fraser et al., 2005); therefore, we investigated changes in growth owing to hLsm1 overexpression. Figure 6a shows that MCF10Lsm1 cells growing without insulin expand as a population more rapidly than MCF10LacZ cells. The IGF-I pathway may be constitutively activated in MCF10Lsm1 cells and contribute to the observed increases in MCF10Lsm1 cell growth. To evaluate IGF-I pathway activity, we measured the activation of insulin receptor substrate-1 (IRS-1), which is phosphorylated following ligand binding and IGF-I receptor activation (Surmacz, 2000). MCF10Lsm1 cells have comparable IRS-1 protein expression to control-infected cells; however, IRS-1 phosphorylation is undetectable in MCF10Lsm1 insulin cells, suggesting that the growth of MCF10Lsm1 cells is independent of IGF activation.
Figure 6.

MCF10Lsm1 cells exhibit increased proliferation and CM exhibits moderate IGF-like growth factor activity in the absence of IGF-I activation. (a) MCF10LacZ and MCF10Lsm1 cells were seeded at the same concentration in triplicate wells. Cell counts were determined on days 1, 3 and 7. Experiments were repeated at least twice and data are shown as means±standard error. (b) An IRS-1 immunoprecipitation followed by Western blots for phosphotyrosine or IRS-1 was performed. A representative blot is shown. Experiments were repeated for all MCF10Lsm1 and MCF10LacZ clones. (c) MCF10A cells were seeded at the same concentration in triplicate wells and grown in SFHE medium or SFHE supplemented 1:1 with CM from subconfluent MCF10Lsm1 cells. Cell counts were determined using a Coulter counter on days 1 and 7. Experiments were repeated at least twice and data are shown as means±standard error.
Growth of MCF10Lsm1 – insulin cells may be due to the increased production and secretion of an autocrine growth factor. To assess the presence of IGF-like activity in the MCF10Lsm1 cells, we used MCF10Lsm1 conditioned medium (CM) to stimulate MCF10A cell growth in the absence of insulin. Figure 6c shows that MCF10Lsm1 CM had a slight but significant stimula-tory effect on the growth of MCF10A cells in insulin-free medium, suggesting the presence of a secreted insulin-replacing growth factor from MCF10Lsm1 cells. As MCF10Lsm1 cells have undetectable IRS-1 phosphorylation, it is likely that this secreted factor in MCF10Lsm1 CM functions through an IGF-I-independent pathway. As will be seen in the next section, MCF10Lsm1 cells have altered mRNA expression of a number of growth factors that could account for the modest insulin-replacing activity in their CM.
Gene expression profile of MCF10Lsm1 cells is similar to the profile of SUM44 breast cancer cells
Expression profiling experiments using Affymetrix GeneChip arrays were performed to evaluate common alterations in the transcriptome of breast cancer cells with amplification and overexpression of hLsm1 and hLsm1-overexpressing MCF10A cells, relative to MCF10LacZ. No significant variations were detected between MCF10LacZ and MCF10A expression profiles, confirming that lentiviral infection had little effect on MCF10A gene expression. Analysis of genes altered by overexpression of hLsm1 in MCF10A and SUM44 cells yielded 400 genes with altered expression at least twofold in the same direction, relative to control. Figure 7 illustrates the remarkable effect of hLsm1 overexpression on the expression profile of MCF10LacZ cells, as well as the striking similarity of the profiles of MCF10Lsm1 and SUM44 cells. All subsequent bioinformatics analyses were performed using this subset of genes with the Onto-Express (OE) and Pathway-Express (PE) programs (Khatri et al., 2002, 2004, 2005; Draghici et al., 2003a, b, 2006).
Figure 7.

Comparison of gene expression profiles of MCF10Lsm1 and SUM44 cells yielded a subset of 400 common genes. RNA was isolated and cDNA was synthesized for hybridization on the Affymetrix human genomic chip HGU133A. Each cell line was run in triplicate (using multiple clones for MCF10Lsm1 and MCF10LacZ) and the resulting CEL files were analysed with D-CHIP software to generate normalized gene expression values. Genes with present calls (P<0.05) in less than four out of eight slides were not considered for analysis. Remaining genes are shown with green indicating >2-fold decrease, red indicating >2-fold increase and yellow indicating no change relative to MCF10LacZ control. Statistical determination of significant expression changes was carried out using analysis of variance with Tukey's post hoc test and the resulting P-values were adjusted using the Benjamin and Hochberg FDR method. Genes with FDR<0.05 were used for subsequent annotation analyses.
OE uses annotation data to construct functional profiles for different biological conditions and provides P-values to distinguish between significant biological effects and random events (Khatri et al., 2005; Draghici et al., 2006). Figure 8a shows the molecular functions of genes altered in both MCF10Lsm1 and SUM44 cells compared to MCF10LacZ cells, with the most common function being transcription factor activity. Influencing the expression of a variety of genes that regulate transcription is consistent with the functional role of hLsm1 in mRNA processing and degradation (Bouveret et al., 2000; He and Parker, 2000; Ingelfinger et al., 2002; Sheth and Parker, 2003). A list of genes associated with a functional change in transcription factor activity, as well as the cancer-promoting cellular processes associated with these genes, is shown in Figure 8b.
Figure 8.
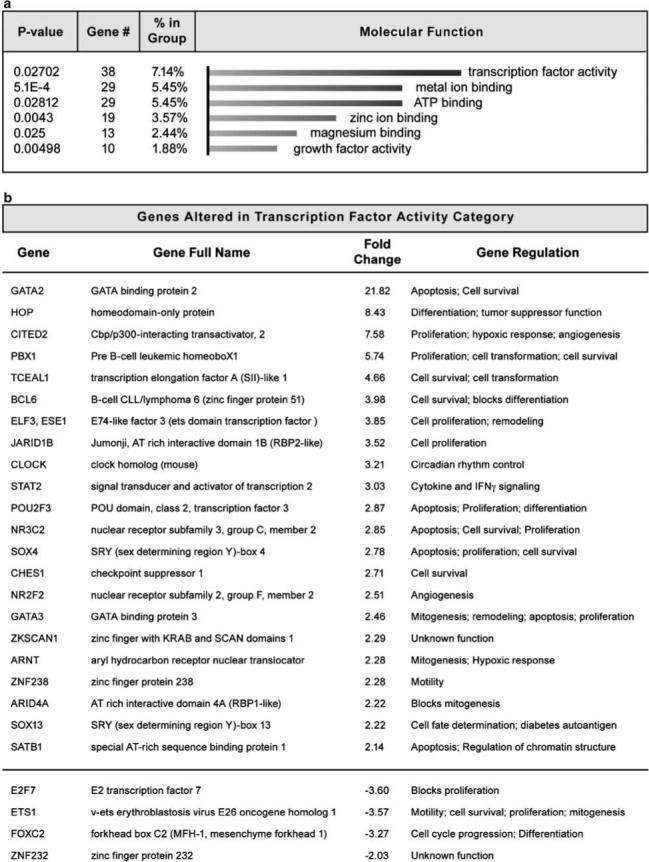
Transcription factor activity is significantly altered in SUM44 and MCF10Lsm1 cells. Genes significantly altered in both SUM44 and MCF10Lsm1 cells relative to MCF10LacZ control cells were analysed using OE software to find functional gene annotation data. Results from the molecular function analysis on this subset of genes were sorted by P-value and significant groups were ranked according to the total number of genes. (a) The molecular function most affected by hLsm1 overexpression was transcription factor activity. (b) Genes associated with a functional change in transcription factor activity and the cellular processes associated with these factors.
We used the PE algorithm to assess the impact of hLsm1 overexpression in both MCF10Lsm1 and SUM44 cells on various functional pathways that may be important for cancer progression and transformation (Khatri et al., 2005; Draghici et al., 2006). The impact factor measures, in a statistically robust fashion, the pathways most affected by changes in gene expression by considering the proportion of differentially regulated genes, perturbation factors of all pathway genes, as well as the propagation of these perturbations throughout the pathway. Figure 9 shows the pathways generated from this analysis ranked by their respective impact factors, as well as how the genes were altered within these pathways relative to MCF10LacZ control cells. The phosphatidylinositol signaling system, along with pathways that regulate actin cytoskeleton, the mitogen-activated protein kinase pathway and the TGF-β pathway are most affected by hLsm1 overexpression in SUM44 and MCF10Lsm1 cells. Of particular interest are the expression changes of platelet-derived growth factor-beta and TGF-β, which could play important roles in the IGF-I independence acquired by MCF10Lsm1 cells. Taken together, our results show that LSM1 is an oncogene capable of transforming epithelial cells and altering numerous cellular processes involved in cancer progression.
Figure 9.

Pathways and associated input genes altered in SUM44 and MCF10Lsm1 cells. PE identified the functional pathways altered as a result of hLsm1 overexpression in both MCF10Lsm1 and SUM44 cells by analysing the impact of differentially expressed genes on known gene signaling pathways. Resulting pathways are ranked by their respective impact factors and the genes altered within these pathways as a result of hLsm1 overexpression are shown. Arrows indicate an increase or decrease relative to MCF10LacZ control cells.
Discussion
Current studies showed that LSM1 is a transforming oncogene that is amplified and overexpressed in breast cancers with copy number gain in the chromosome 8p11−12 region. hLsm1 overexpression in MCF10A cells led to IGF-independent proliferation and anchorage-independent growth in vitro. Transient expression of hLsm1 siRNA inhibited soft agar colony formation in SUM44 breast cancer cells. MCF10Lsm1 cells proliferated more rapidly than control cells, and induced the production of a soluble factor that substitutes for the effects of insulin without activating the IGF-I pathway. Comparison of the gene expression changes induced by hLsm1 overexpression in MCF10A cells and SUM44 cells revealed significant similarities and illustrated the ability of hLsm1 to alter a broad range of genes that contribute to cancer progression.
hLsm1 is overexpressed in approximately 90% of pancreatic cancer samples and 40% of prostate cancer specimens, and is required for maintaining the transformed phenotype in both cancer models (Kelley et al., 2003; Fraser et al., 2005). However, evidence for an alteration of LSM1 at the DNA level causing cancer cell transformation has not been demonstrated. Therefore, this is the first report that LSM1 is a bona fide breast cancer oncogene activated by a gene amplification in the chromosome 8p11−12 region. IGF-independent growth induced by hLsm1 overexpression illustrates the transforming ability of hLsm1, as a key event in the progression of mammary epithelial cells toward malignancy is the acquisition of growth factor independence. The ability of hLsm1 to induce IGF-independent growth has not been shown previously and may provide insight into how hLsm1 functionally affects breast cancer progression.
Previous research showed that antisense hLsm1 decreased the G0/G1 fraction and increased the G2–M phase, leading to growth arrest of prostate and pancreatic cancer cell lines (Kelley et al., 2003; Fraser et al., 2005). Furthermore, caspase-3 activity also was increased, indicating that some apoptosis may be occurring; however, the dominant effect of hLsm1 inhibition was shown to be cytostatic (Kelley et al., 2003). Our observation of increased proliferation following hLsm1 overexpression suggests that hLsm1 may affect either cell cycle progression or apoptosis or both, which is consistent with previous data in other cancer models (Kelley et al., 2003; Fraser et al., 2005). Annotation analysis of the altered genes common to MCF10Lsm1 and SUM44 cells further suggested that cell proliferation and cell cycle regulation were the processes most affected by hLsm1 overexpression; therefore, investigating specific genes within these pathways will be critical to understanding hLsm1's effect on cancer progression.
MCF10Lsm1 cells had undetectable levels of IRS-1 tyrosine phosphorylation; however, growth factor activity was observed in CM obtained from these cells. Together, these data suggest that hLsm1 overexpression resulted in the production of a soluble factor that partially substituted for the effects of insulin without activating the IGF pathway. The ability of hLsm1 overexpression to alter soluble factor secretion has been suggested previously in work showing that CM from pancreatic cancer cells exposed to antisense hLsm1 caused a dose-dependent decrease in viable cells and induced apoptosis (Yan et al., 2006). These observations are consistent with a model where hLsm1 affects the production of soluble factors that may mediate the proliferative capacity of cancer cells.
Comparing gene expression changes in MCF10Lsm1 cells to changes in SUM44 cells revealed a subset of 400 differentially expressed genes influenced by hLsm1 overexpression. A significant portion of these genes are known to facilitate cancer development, which is not unexpected because they resulted from our selectable phenotype of growth factor independence with subsequent comparison to cancer cells. However, our comparative analysis was conducted in a statistically robust manner and utilized multiple hLsm1-overexpressing clones, suggesting that the observed effects of hLsm1 overexpression are biologically relevant. We cannot completely discount the contribution of other chromosome 8oncogenes to changes seen in SUM44 cells, but comparison to cells with only hLsm1 overexpression provided a more detailed picture of hLsm1's role in cancer progression to be pursued in future experiments.
The profound effect of LSM1 on the transcriptome of cancer cells may be due to the regulation of mRNA degradation by directly interacting with and destroying deadenylated mRNAs (Zaric et al., 2005). Fraser et al. (2005) showed that the destabilization and decapping of mRNA of the cyclin-dependent kinase inhibitor p21 is an hLsm1-associated process. The ability of hLsm1 to alter mRNA degradation and regulate numerous cellular pathways was further suggested by the diverse group of molecular functions, cellular processes and biological pathways altered in both MCF10Lsm1 and SUM44 cells. The impact of LSM1 on overall cellular message stability is not well-understood, nor is the mechanism behind its influence on the observed biological pathways; however, hLsm1's involvement in regulating such diverse genes and pathways may explain the potent effects on SUM44 cancer cell growth seen following transient hLsm1 inhibition and may be a critical part of its role as a transforming oncogene.
Together, these data are the first to show that LSM1 is an oncogene activated by gene amplification and overexpression in breast cancers with a focal copy number increase in the chromosome 8p11−12 region. These data also identified genes altered as a result of hLsm1 overexpression, which may provide insight into the effect of hLsm1 on breast cancer development and progression. Understanding the contribution of hLsm1 to breast cancer progression could identify new treatment targets for a subset of breast cancers that have yet to be characterized fully.
Materials and methods
Cell culture conditions
The MCF10A human mammary epithelial cell line and SUM44 breast cancer cell line were cultured as described previously (Forozan et al., 1999; Woods Ignatoski et al., 2005). MCF10Lsm1 cells were cultured in MCF10A medium with the antibiotic blasticidin (10 μg/ml) and without insulin. MCF10LacZ control cells were grown in MCF10A medium plus blasticidin (10 μg/ml). All cells were cultured at 37°C in a humidified incubator containing 10% CO2.
Production of lentivirus and cell infection
293FT producer cells were transfected with 3 μg pLenti hLsm1 expression plasmid DNA and 9 μg of ViraPower packaging mix per 6 × 10⁶ cells using the Lipofectamine 2000 reagent (Invitrogen). Lentivirus-containing supernatants were collected and filtered after 48h, then used to infect MCF10A cells at a 1:5 ratio of virus to media in the presence of 6 μ/ml polybrene. Control infections with MCF10LacZ virus were performed in parallel. Selection began 48h after infection in growth medium with 10 μg/ml blasticidin and without either insulin or EGF. Upon confluence, selected cells were passaged and serially cultured in these conditions for all subsequent experiments.
Growth in soft agar
A layer of 1% agarose in Ham's F-12 was poured and allowed to solidify. 1 × 10⁵ cells in a 0.3% agarose solution were plated into six-well plates and appropriate medium was added. For experiments using hLsm1 siRNA, SUM44 cells were transfected with hLsm1 or control siRNA oligonucleotides (100 nmol/l) 24 h before seeding in agar. After 3 weeks, excess medium was removed, and 1 mg/ml solution of p-iodonitrotetrazolium violet (Sigma) was added overnight to stain viable cells. Colonies were photographed and counted after staining.
Q-RT-PCR reactions
RNA was extracted using the Qiagen (Valencia, CA, USA) RNeasy kit and converted into cDNA using random hexamer primers. hLsm1 and glyceraldehyde-3-phosphate dehydrogenase (GAPDH) probes were ordered from Applied Biosystems Assays-by-Design service. Q-RT-PCR was performed three times, in replicates of three, with the Taqman Universal PCR Master Mix (Applied Biosystems) on the Bio-Rad iQ5 real-time PCR machine (Bio-Rad Laboratories, Hercules, CA, USA). Relative expression data were calculated as described by Livak and Schmittgen (2001). Briefly, cycles to threshold values for hLsm1 were normalized to values for GAPDH and then compared to hLsm1 expression in MCF10A cells to determine fold change. Control wells without sample cDNA emitted no fluorescence after 40 cycles.
Immunoprecipitation and Western blots
Cell lysis and protein quantification were performed as described previously (Woods Ignatoski et al., 2005). For IRS-1 immunoprecipitation, cell lysate (1 mg) was incubated with 2 mg/mg of IRS-1 antibody for 2 h at 4°C followed by incubation with protein A/G agarose beads (Sigma) for 1 h at 4°C. Proteins from immunoprecipitations or whole-cell lysates (100 μg) were resolved on 10% polyacrylamide gels, transferred to polyvinylidene difluoride membranes (Millipore Corp., Bedford, MA, USA) and probed for 1 h at room temperature with one of the following antibodies at a concentration of 2 μg/ml: IRS-1 (Upstate, Lake Placid, NY, USA), β-actin (Santa Cruz), p-Tyr(PY20) (Santa Cruz) or hLsm1. hLsm1 antibody was generously provided by Dennis Watson at the Medical University of South Carolina and was made as described previously (Schweinfest et al., 1997). After washing, membranes were incubated for 1 h at room temperature in the appropriate horseradish peroxidase-labeled secondary antibody. Membranes were developed in enhanced chemiluminescence (Pierce, Rockford, IL, USA) for 5 min and exposed to film.
Assessment of monolayer growth
MCF10LacZ and MCF10Lsm1 cells were seeded in six-well plates at 3.5 × 10⁴ cells/well in appropriate growth media. Cell number was determined by counting isolated nuclei with a Coulter counter on days 1, 3 and 7 after seeding. All experiments were performed in triplicate and repeated at least twice.
Assay for IGF-like growth factor activity in CM
MCF10A cells were seeded in six-well plates at 3.5 × 10⁴ cells/ well and grown in normal growth medium, medium without insulin (SFHE) or SFHE medium supplemented 1:1 with CM collected from subconfluent MCF10Lsm1 cells. Media were changed every other day and after 7 days, cell counts were determined using a Coulter counter.
hLsm1 siRNA
hLsm1 siRNA oligonucleotides were generated from a target DNA sequence (GTGGTCCTACTAGGAG) unique to hLsm1 using the criteria of Paddison et al. (2002) and Paddison and Hannon (2003). Double-stranded RNA was synthesized and annealed at Qiagen Inc. with a fluorescent modification (Alexa Fluor 488) added to both hLsm1 and control siRNA oligonucleotides in order to visualize transfection efficiency (75%). Transfection into the SUM44 breast cancer cell line was carried out using RNAifect (Invitrogen) with double-stranded RNA at a final concentration of 100 nmol/l.
cDNA microarray and bioinformatics analyses
RNA from MCF10A, MCF10LacZ, MCF10Lsm1 and SUM44 cells was isolated using the Qiagen RNeasy kit. The Applied Genomics Technology Center at Wayne State University synthesized cDNA for hybridization on the Affymetrix human genomic chip HGU133A with 20 000 genes per chip. Each sample was run in triplicate and the resulting CEL files were analysed with D-CHIP software to generate normalized gene expression values, as described previously (Li and Wong, 2001). Genes with present calls (P<0.05) in less than four out of eight slides were not considered for analysis. Statistical analysis was carried out using analysis of variance (Genespring 7.0) with Tukey's post hoc test to calculate P-values for all comparisons. P-values were adjusted using the Benjamin and Hochberg FDR method and genes with FDR<0.05 were used for subsequent bioinformatics analyses.
The ontological profiling of differentially expressed genes was performed with OE (Khatri et al., 2002, 2004; Draghici et al., 2003a, b), which calculates the probability that a given ontological category appears in the group of differentially expressed genes due to random chance. P-values were calculated using a hypergeometric model and corrected with the FDR procedure (Draghici et al., 2003a, b). The null hypothesis corresponds to the situation in which a random set of N differentially expressed genes is selected from the set of genes on a given microarray.
A pathway level analysis was performed using PE (Khatri et al., 2005), which incorporates a classical probabilistic component that considers the number of differentially expressed genes occurring on any given pathway in relationship with what is expected by chance alone. The impact analysis includes important biological parameters, such as the magnitude and type of gene expression changes, the position and signaling interactions of all pathway genes, and the overall pathway topology. The analysis yields an impact factor that indicates the relative importance of each pathway identified.
Acknowledgements
This work was supported by a grant from the National Cancer Institute (RO1 CA100724). Microarray experiments and analysis were performed by the Applied Genomics Technology Center at Wayne State University, which is funded by the Cancer Center Support Grant (P30 CA022453-25). Funding for Dr Sorin Draghici was provided by the following grants: NSF DBI-0234806, NIH R01 HG003491, NIH(NCRR) 1S10 RR01785701, NIH R21 CA10074001, 1R21 EB0099001 and 1R01NS04520701.
References
- Bouveret E, Rigaut G, et al. A Sm-like protein complex that participates in mRNA degradation. EMBO J. 2000;19:1661–1671. doi: 10.1093/emboj/19.7.1661. [DOI] [PMC free article] [PubMed] [Google Scholar]
- Draghici S, Khatri P, et al. Onto-Tools, the toolkit of the modern biologist: Onto-Express, Onto-Compare, Onto-Design and Onto-Translate. Nucleic Acids Res. 2003a;31:3775–3781. doi: 10.1093/nar/gkg624. [DOI] [PMC free article] [PubMed] [Google Scholar]
- Draghici S, Khatri P, et al. Global functional profiling of gene expression. Genomics. 2003b;81:98–104. doi: 10.1016/s0888-7543(02)00021-6. [DOI] [PubMed] [Google Scholar]
- Draghici S, Khatri P, et al. Reliability and reproducibility issues in DNA microarray measurements. Trends Genet. 2006;22:101–109. doi: 10.1016/j.tig.2005.12.005. [DOI] [PMC free article] [PubMed] [Google Scholar]
- Ethier SP. Human breast cancer cell lines as models of growth regulation and disease progression. J Mammary Gland Biol Neoplasia. 1996;1:111–121. doi: 10.1007/BF02096306. [DOI] [PubMed] [Google Scholar]
- Ethier SP, Moorthy R. Multiple growth factor independence in rat mammary carcinoma cells. Breast Cancer Res Treat. 1991;18:73–81. doi: 10.1007/BF01980969. [DOI] [PubMed] [Google Scholar]
- Ethier SP, Summerfelt RM, et al. The influence of growth factors on the proliferative potential of normal and primary breast cancer-derived human breast epithelial cells. Breast Cancer Res Treat. 1991;17:221–230. doi: 10.1007/BF01806371. [DOI] [PubMed] [Google Scholar]
- Forozan F, Veldman R, et al. Molecular cytogenetic analysis of 11 new breast cancer cell lines. Br J Cancer. 1999;81:1328–1334. doi: 10.1038/sj.bjc.6695007. [DOI] [PMC free article] [PubMed] [Google Scholar]
- Fraser MM, Watson PM, et al. CaSm-mediated cellular transformation is associated with altered gene expression and messenger RNA stability. Cancer Res. 2005;65:6228–6236. doi: 10.1158/0008-5472.CAN-05-0650. [DOI] [PubMed] [Google Scholar]
- Garcia MJ, Pole JC, et al. A 1 Mb minimal amplicon at 8p11–12 in breast cancer identifies new candidate oncogenes. Oncogene. 2005;24:5235–5245. doi: 10.1038/sj.onc.1208741. [DOI] [PubMed] [Google Scholar]
- Gelsi-Boyer V, Orsetti B, et al. Comprehensive profiling of 8p11−12 amplification in breast cancer. Mol Cancer Res. 2005;3:655–667. doi: 10.1158/1541-7786.MCR-05-0128. [DOI] [PubMed] [Google Scholar]
- He W, Parker R. Functions of Lsm proteins in mRNA degradation and splicing. Curr Opin Cell Biol. 2000;12:346–350. doi: 10.1016/s0955-0674(00)00098-3. [DOI] [PubMed] [Google Scholar]
- Ingelfinger D, Arndt-Jovin DJ, et al. The human LSm1−7 proteins colocalize with the mRNA-degrading enzymes Dcp1/2 and Xrnl in distinct cytoplasmic foci. RNA. 2002;8:1489–1501. [PMC free article] [PubMed] [Google Scholar]
- Kelley JR, Fraser MM, et al. CaSm antisense gene therapy: a novel approach for the treatment of pancreatic cancer. Anticancer Res. 2003;23:2007–2013. [PubMed] [Google Scholar]
- Khatri P, Bhavsar P, et al. Onto-Tools: an ensemble of web-accessible, ontology-based tools for the functional design and interpretation of high-throughput gene expression experiments. Nucleic Acids Res. 2004;32(Web Server issue):W449–W456. doi: 10.1093/nar/gkh409. [DOI] [PMC free article] [PubMed] [Google Scholar]
- Khatri P, Draghici S, et al. Profiling gene expression using onto-express. Genomics. 2002;79:266–270. doi: 10.1006/geno.2002.6698. [DOI] [PubMed] [Google Scholar]
- Khatri P, Sellamuthu S, et al. Recent additions and improvements to the Onto-Tools. Nucleic Acids Res. 2005;33(Web Server issue):W762–W765. doi: 10.1093/nar/gki472. [DOI] [PMC free article] [PubMed] [Google Scholar]
- Li C, Wong WH. Model-based analysis of oligonucleo-tide arrays: expression index computation and outlier detection. Proc Natl Acad Sci USA. 2001;98:31–36. doi: 10.1073/pnas.011404098. [DOI] [PMC free article] [PubMed] [Google Scholar]
- Livak KJ, Schmittgen TD. Analysis of relative gene expression data using real-time quantitative PCR and the 2(–Delta Delta C(T)) method. Methods. 2001;25:402–408. doi: 10.1006/meth.2001.1262. [DOI] [PubMed] [Google Scholar]
- Paddison PJ, Caudy AA, et al. Stable suppression of gene expression by RNAi in mammalian cells. Proc Natl Acad Sci USA. 2002;99:1443–1448. doi: 10.1073/pnas.032652399. [DOI] [PMC free article] [PubMed] [Google Scholar]
- Paddison PJ, Hannon GJ. siRNAs and shRNAs: skeleton keys to the human genome. Curr Opin Mol Ther. 2003;5:217–224. [PubMed] [Google Scholar]
- Prentice LM, Shadeo A, et al. NRG1 gene rearrangements in clinical breast cancer: identification of an adjacent novel amplicon associated with poor prognosis. Oncogene. 2005;24:7281–7289. doi: 10.1038/sj.onc.1208892. [DOI] [PubMed] [Google Scholar]
- Ray ME, Yang ZQ, et al. Genomic and expression analysis of the 8p11−12 amplicon in human breast cancer cell lines. Cancer Res. 2004;64:40–47. doi: 10.1158/0008-5472.can-03-1022. [DOI] [PubMed] [Google Scholar]
- Schweinfest CW, Graber MW, et al. CaSm: an Sm-like protein that contributes to the transformed state in cancer cells. Cancer Res. 1997;57:2961–2965. [PubMed] [Google Scholar]
- Sheth U, Parker R. Decapping and decay of messenger RNA occur in cytoplasmic processing bodies. Science. 2003;300:805–808. doi: 10.1126/science.1082320. [DOI] [PMC free article] [PubMed] [Google Scholar]
- Surmacz E. Function of the IGF-I receptor in breast cancer. J Mammary Gland Biol Neoplasia. 2000;5:95–105. doi: 10.1023/a:1009523501499. [DOI] [PubMed] [Google Scholar]
- Woods Ignatoski KM, Dziubinski ML, et al. Cooperative interactions of HER-2 and HPV-16 oncoproteins in the malignant transformation of human mammary epithelial cells. Neoplasia. 2005;7:788–798. doi: 10.1593/neo.05106. [DOI] [PMC free article] [PubMed] [Google Scholar]
- Yan Y, Rubinchik S, et al. Bystander effect contributes to the antitumor efficacy of CaSm antisense gene therapy in a preclinical model of advanced pancreatic cancer. Mol Ther. 2006;13:357–365. doi: 10.1016/j.ymthe.2005.06.485. [DOI] [PubMed] [Google Scholar]
- Yang ZQ, Albertson D, et al. Genomic organization of the 8p11−p12 amplicon in three breast cancer cell lines. Cancer Genet Cytogenet. 2004;155:57–62. doi: 10.1016/j.cancergencyto.2004.03.013. [DOI] [PubMed] [Google Scholar]
- Zaric B, Chami M, et al. Reconstitution of two recombinant LSm protein complexes reveals aspects of their architecture, assembly, and function. J Biol Chem. 2005;280:16066–16075. doi: 10.1074/jbc.M414481200. [DOI] [PubMed] [Google Scholar]