

Abstract
The correct interpretation of any biological experiment depends in an essential way on the accuracy and consistency of the existing annotation databases. Such databases are ubiquitous and used by all life scientists in most experiments. However, it is well known that such databases are incomplete and many annotations may also be incorrect. In this paper we describe a technique that can be used to analyze the semantic content of such annotation databases. Our approach is able to extract implicit semantic relationships between genes and functions. This ability allows us to discover novel functions for known genes. This approach is able to identify missing and inaccurate annotations in existing annotation databases, and thus help improve their accuracy. We used our technique to analyze the current annotations of the human genome. From this body of annotations, we were able to predict 212 additional gene–function assignments. A subsequent literature search found that 138 of these gene–functions assignments are supported by existing peer-reviewed papers. An additional 23 assignments have been confirmed in the meantime by the addition of the respective annotations in later releases of the Gene Ontology database. Overall, the 161 confirmed assignments represent 75.95% of the proposed gene–function assignments. Only one of our predictions (0.4%) was contradicted by the existing literature. We could not find any relevant articles for 50 of our predictions (23.58%). The method is independent of the organism and can be used to analyze and improve the quality of the data of any public or private annotation database.
Availability
http://vortex.cs.wayne.edu/papers/semantic_analysis_bioinfo.pdf
Contact
sod@cs.wayne.edu
1 INTRODUCTION
Gene annotation databases are widely used as public repositories of biological knowledge. Understanding almost any genetic experiment involves consulting such annotation databases at some point. The content of such annotation databases is meant to constantly capture the scientific community's progress in understanding the way genes function and they should represent the compounded state-of-the-art knowledge about the genes of various organisms. In spite of their undoubted importance, it is generally acknowledged that annotation databases have important problems (Karp, 1998).
Firstly, the existing annotations databases are incomplete. For virtually all sequenced organisms only a subset of genes are known, and even a smaller subset of genes are functionally annotated (King et al., 2003). As more knowledge is accumulated, genes and annotations are gradually added to such databases. This means that at any moment in time, it is likely that an annotation database will contain only a subset of all the genes of the given organism, and even for those genes that are included, possibly only a subset of their functions. Furthermore, most annotation databases are built by curators who manually review the existing literature. It is possible that certain published facts might get lost in this process. For instance, we found references in literature published in the early 1990s for 65 functional annotations that are yet not included in certain annotation databases. As an example, the gene HMOX2 was shown to be involved in the process of pigment biosynthesis in 1992 (McCoubrey et al., 1992) and was still not annotated as such in the Gene Ontology (GO) database as of May 2004.
Also, many pieces of information in such databases may also be incorrect. In UniProt annotations at EBI using the (GO), out of the 20 257 total biological process annotations available for Homo sapiens, 12 239 associations are inferred exclusively from electronic annotations (i.e. without any expert human involvement) (http:// www.geneontology.org/GO.current.annotations.shtml). Some of these inferences may be incorrect (King et al., 2003; Wang et al., 2004). Even though in some cases the error is very conspicuous to a human expert, currently, there are no automated techniques that could analyze, discover and correct such erroneous assignments.
Finally, another problem of current annotation databases is related to how these annotations are entered and stored. For example, the gene SLC13A2 [solute carrier family 13 (sodium-dependent dicarboxylate transporter), member 2 (H.sapiens)] encodes the human Na(+)-coupled citrate transporter and is annotated in GO for the molecular function organic anion transporter activity. However, this gene is not annotated for the corresponding biological process, which is organic anion transport. For the curator, and for the human expert who queries GO for this specific gene, this is not a problem. For them, it is obvious that a gene that has organic anion transporter activity will be involved in the organic anion transport. The problem is that such gene specific query is neither the typical, nor the most informative query performed in annotation databases. Recently, an automatic functional profiling approach has been proposed to help researchers interpret the results of high throughput experiments (Drăghici et al., 2003a,b; Khatri et al., 2004, 2002). This approach queries an annotation database in each of the GO categories and performs a statistical significance analysis that generally pinpoints the biological mechanisms involved in the condition under study. Many other tools that use the same approach have been developed since (Al-Shahrour et al., 2004; Beissbarth and Speed, 2004; Hosack et al., 2003; Joel Richardson, http://www.informatics.jax.org/∼jer/vlad/; Zeeberg et al., 2003; Zhang et al., 2004). Any ontological analysis software that tries to find out what underlying biological processes are represented by a given list of genes containing the SLC13A2 gene illustrated above, will either fail to consider the organic anion transport if no other genes are involved in it, or will calculate its statistical significance incorrectly by ignoring this gene. Also, any query that tries to find all genes involved in the process of organic anion transport will fail to retrieve this gene.
In this paper, we describe a new technique that is able to (i) discover potential inconsistencies in existing annotations and (ii) discover implicit gene–function relationships and propose them to the curators as novel annotations. Our approach applies latent semantic indexing (LSI) to the existing genome annotations databases to discover the missing functional annotations. LSI uses singular value decomposition (SVD) to find semantic relationships in the data that are not explicitly expressed (i.e. hidden) in the initial data. We demonstrate our technique using the annotations of the human genome stored in the Onto-Tools database (Drăghici et al., 2003b; Khatri et al., 2004), which includes all known annotations from the GO Consortium.
LSI has been previously used in the analysis of genome-wide expression data (Alter et al., 2000). Other approaches able to predict functional annotations for a given gene do exist. The most commonly used approach for function prediction uses sequence similarity. This approach is based on the hypothesis that a function can be transferred between similar sequences in different organisms since such similarity has been conserved over long periods of evolution (Devos and Valencia, 2000). This method of annotation transfer can result in incorrect function predictions due to reasons such as divergence of function within homologous proteins. Furthermore, this type of inference can also be incorrect because the annotations are only transferred from the closest homolog (Karp, 1998). In order to overcome these problems, approaches combining sequence similarity data with structural information have been proposed (Fetrow et al., 2001; Skolnick and Fetrow, 2000). The guilt by association (GBA) approach (Quackenbush, 2003; Walker et al., 1999; Zhou et al., 2004), based on the observation that functionally related genes tend to share similar mRNA expression profiles, has also been widely applied to predict gene functions (Brown et al., 2000; Eisen et al., 1998; Hvidsten et al., 2001; Roch et al., 2003; Wu et al., 2002). This approach clusters the genes based on their expression profiles in order to predict the gene functions. The GBA approaches are affected by issues such as data transformation (Geller et al., 2003; Pan et al., 2002) and filtering intended to boost the signal-to-noise ratio (Herrero et al., 2003). An alternative approach uses sequence similarity and protein domain data in order to predict functional annotations (Schug et al., 2002). Raychaudhuri et al. (2002) proposed a natural language processing approach for automatically extracting gene–function associations from the literature abstracts. The technique we are proposing is a novel, organism-independent approach that analyzes the entire body of annotations for a given organism. The same technique can be applied on annotation databases constructed for any organism. Unlike previous techniques that focus on specific genes, our technique is intended for the curation and maintenance of existing annotation databases.
2 METHODS
The complete functional annotations of a given organism can be represented using a matrix GF, with g rows and f columns. The rows of this matrix correspond to genes, while its columns correspond to functions. The element gfij of the GF matrix is 1 if a gene gi is known to be involved in a function fj , and 0 otherwise:.
| (1) |
Our approach uses a functional annotation database using the structure proposed by the GO Consortium (Ashburner et al., 2000). GO provides an organism-independent ontology described as a directed acyclic graph (DAG) of functional categories. When a gene is annotated using GO, the efforts are made to annotate the gene with the most specific functional category available. For instance, if a gene is known to induce apoptosis in a cell through extracellular signals, it is annotated with the specific category ‘induction of apoptosis by extracellular signals’, instead of a higher level, more general category such as ‘induction of apoptosis’ or ‘apoptosis’. However, a gene involved in induction of apoptosis by extracellular signals is actually involved in induction of apoptosis, which is indeed part of the apoptosis phenomenon. For this reason, we will consider that a gene annotated with a specific GO function f is also involved in all the functions described by the more general categories, represented by f's parents. In order to represent this in our data, we modify the GF matrix as follows:
| (2) |
Note that owing to the hierarchical structure of GO, the root of the ontology will have 1 for all genes. For instance, the node associated with ‘biological process’ will have 1 for all genes that have any biological process annotation at all. The i-th row of the matrix GF will represent all functional categories directly or indirectly associated with gene gi (e.g. through its parents). Similarly, the j-th column of the matrix GF will represent all genes known to be directly or indirectly involved in the function fj .
We then decompose the matrix GF as follows:
| (3) |
Here, Gm and Fm are matrices of the left and the right singular vectors and Sm is an m × m diagonal matrix (Golub and van Loan, 1983). The elements of Sm are the singular values of GF and m is the rank of GF (i.e. the number of linearly independent rows or columns). The rows and columns in Sm will be called eigengenes and eigenfunctions, respectively. This decomposition of the matrix GF is represented in Figure 1. The square matrix Sm has m rows and m columns. This matrix also has the property that each eigengene is decoupled from all the other eigengenes. In other words, the m-th eigengene is only annotated by the corresponding m-th eigenfunction.
Fig. 1.
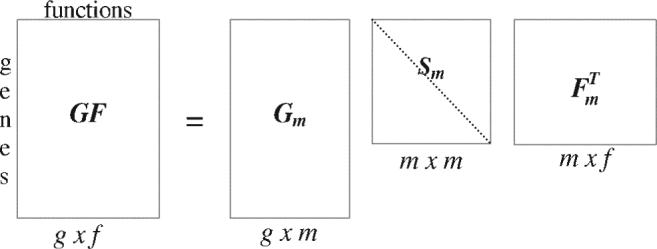
Singular value decomposition of the gene–function association matrix GF. There are g genes and f functions. Sm is a diagonal matrix such that Sij = 0, if i ≠ j and Sij ≥ 0, if i = j. The rows and columns in Sm are GF's eigengenes and eigenfunctions, respectively.
The matrices G and are the basis sets of size g × m and m × f , respectively. The vector in the i-th column of matrix Gm lists all known genes involved in the i-th eigenfunction. Similarly, the vector in the i-th row of matrix lists all functional categories the i-th eigengene is known to be involved in. In addition, both matrices Gm and Fm are orthonormal i.e.
| (4) |
where I is the identity matrix. Hence, each eigengene (or eigenfunction) is not only decoupled, but it is also decorrelated from all other eigengenes (or eigenfunctions).
Next, we reduce the dimensionality of the system by selecting only the first k largest singular values of Sm and their corresponding columns in the Gm and Fm matrices, creating the matrices Sk, Gk and Fk. The product of these, , is a unique matrix, which is the closest rank k approximation of GF in the least squares sense (Fig. 2):
| (5) |
Fig. 2.
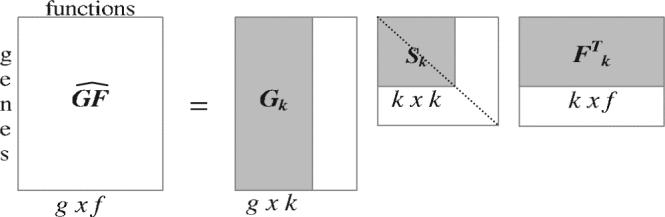
The dimensionality reduction from m to k produces an approximation matrix of the original matrix GF. By reducing the dimensionality we force the new matrix to capture the latent semantics and filter out the noise. This essentially will capture those interactions that are strongly represented in the data.
When we reduce the dimensionality by selecting the largest k singular values (i.e. the k largest independent linear components) from Sm, we are essentially constructing a model of the relationships between the genes and the functions by eliminating much of the noise. This model will allow us to extract implicit gene–function relationships from the data. Note that the new matrix has not lost any genes or functions as a result of dimension reduction and has the same dimensions as the original matrix GF. The matrix only contains the gene–function relationships that are strongly represented in the data. The remarkable fact is that such strong relationships will be present in , even if they were never explicitly present in the original data.
We can now use the matrix to study the semantic relationships of the gene–function associations. This is done by choosing a threshold T . If the value of is >T , our analysis suggests that gene i has function j. Those gene–function associations that had gfij = 1 in the original GF matrix and now have > T in our projection space correspond to known annotations confirmed by our analysis. The gene–function associations that had gfij = 0 in the original GF matrix and now have > T in our projection space correspond to newly discovered associations between genes and functions. Finally, gene–function associations that had gfij = 1 in the original GF matrix and now have ≤ T in our projection space correspond to known annotations that seem semantically inconsistent with the other data. Discretion needs to be exercised before concluding that an inconsistency exists because truly novel phenomena may appear inconsistent with the rest of the annotations just because not enough data exists at that particular time.
3 RESULTS AND DISCUSSION
We used our proposed technique to analyze the existing body of annotation of the human genome as captured by the GO database. Our aim was to analyze the semantic consistency of this body of data. In particular, we wanted to find incomplete and/or incorrect annotations: implicit gene–function relationships that can be semantically inferred from the data and annotations that are potentially inconsistent, respectively.
We constructed a gene–function matrix GF using all known human annotations contained in the Onto-Tools database (Drăghici et al., 2003b; Khatri et al., 2004). The relevant information originated in UniGene built #168, released on March 26, 2004 and GO, released in March 2004. This initial matrix contained 11 203 genes, 5201 ontological categories (molecular functions, biological processes and cellular components) and 58 266 803 gene–function associations. Note that the unused GO terms are not included in the initial matrix. This is because these terms are not associated with any genes from the given set and hence, they do not contain any implicit semantic information. We decomposed this matrix as in Figure 1 and we reduced the dimensionality to the largest k = 500 eigenvalues that preserved 59.6% of the variance of the data. We then constructed the new matrix as in Figure 2.
In order to calculate an appropriate value for the threshold T above, we proceeded as follows. We assume that the annotation database studied contains mostly correct but also some incorrect gene–function associations. For the purpose of defining a threshold, we assume that the true gene–function associations are those revealed by the LSI, i.e. those captured by . In this hypothesis, the gene–function associations for which gfij = 1 in the original GF matrix and > T are true positives (TP). The gene–function associations for which gfij = 0 in the original GF matrix and > T are false negatives (FN). In other words, FN are the relationships that were not present in the original annotation database although they are true. In the same hypothesis, gene–function associations for which gfij = 1 in the original GF matrix and ≤ T are FP. These correspond to relationships that were initially present in the database but that are not supported by the rest of the data. Finally, the associations that were not in the database initially (gfij = 0), and are also not revealed by the LSI ( ≤ T ) are TN.
Figure 3 shows the number of FP, the number of FN, and the total presumed existing error (FP+FN) plotted against various values of threshold T. The graph shows that a threshold close to one will fail to assign many gene–function relationships, which would imply that the existing database has very many FP relations. Clearly, this cannot be true since most relationships are verified experimentally and known to be true. Similarly, for a threshold close to zero, the algorithm associates many genes with many functions, which would imply that the original dataset had many FNs. Using a criterion analogous to Occam's razor, we chose the value of the threshold T that corresponds to the assumption that the initial dataset has the minimum amount of errors. For the human annotations in the GO database as of March 2004, this value is T 0.37.
Fig. 3.
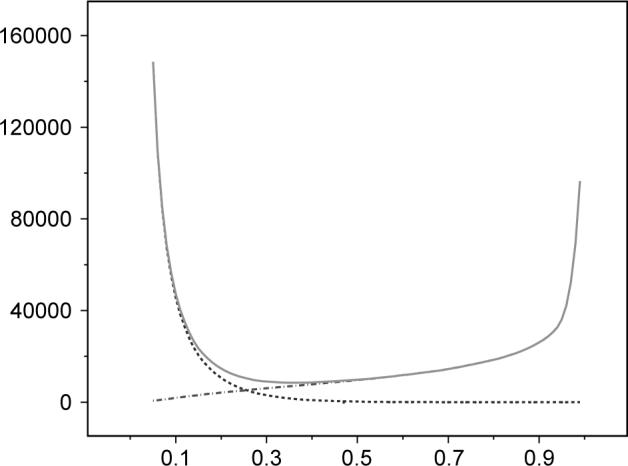
The number of FPs (dot-dash blue line), the number of FNs (dashed magenta line) and the total error FP+FN (green continuous line) as functions of the threshold. The optimal threshold value is the one that yields a minimum total error. This corresponds to the assumption that the initial dataset had a minimum number of errors. For the human annotations in the Gene Ontology database as of March 2004, the optimal threshold is 0.37.
Other approaches that can be used to select the threshold include an expectation maximization (EM) algorithm and a fuzzy logic approach. The EM (Dempster et al., 1977) can be used to find the maximum-likelihood estimates of the parameters of the underlying distributions of the values of the matrix for each given gene. Subsequently, the optimal threshold can be calculated as the value for which the two probability density functions intersect. The disadvantage of this approach is that EM is unstable when the two distributions are substantially overlapping. The fuzzy logic approach would use a gradual transition in which the [0, 1] interval is divided into [0, T1] representing gene and functions that are not associated in a meaningful way, (T1, T2117:606) representing an uncertainty interval and [T2, 1] representing strong associations.
At T = 0.37, our analysis preserved most known relationships: most zero elements in the original matrix were close to zero in the new matrix, as well, and most one elements in the original matrix were also close to one in our results. However, several values which were initially zero became larger than our threshold, indicating novel associations between genes and functions. We found 1196 such putative novel associations between several genes and various ontological categories. In order to make a validation process feasible, we focused on the predicted associations with a > 0.5. There were 212 such novel gene–function assignments.
The most convincing category of predictions involved annotations that were not included in GO at the time we downloaded the data for our analysis (March 2004), but have been added since. Examples of predictions from this category include the genes RNF14 [ring finger protein 14 (H.sapiens)] and NDUFS7 [NADH dehydrogenase (ubiquinone) Fe-S protein 7, 20 kDa (NADH-coenzyme Q reductase) (H.sapiens)]. RNF14 was predicted to exhibit ubiquitin–protein ligase activity whereas NDUFS7 was predicted to have NADH dehydrogenase activity. In both cases, our method associated these genes with the exact same molecular function that was later officially assigned to them by the GO Consortium. Overall, 23 gene–function relations predicted by our technique were later officially added to the GO annotations.
Many of the relationships we predicted were validated by both existing literature and other annotations present in GO. For instance, our analysis predicted that RFC1 [replication factor C (activator 1), 145 kDa (H.sapiens)] should be associated with the chromosome, telomeric region of the cell. Our prediction is confirmed by papers such as the one by Uchiumi et al. (1996), which showed that RFC recognizes preferentially 5′-phosphoryl groups at the ends of double-stranded telomere repeats and suggested its involvement in telomere stability or turnover. In spite of the fact that this gene has been annotated for the biological process telomerase-dependent telomere maintenance, there was no annotation associating this gene with a specific cellular location.
Our analysis also predicted the involvement of SLC13A2 [solute carrier family 13 (sodium-dependent dicarboxylate transporter), member 2 (H.sapiens)] in the biological process of organic anion transport. This gene is annotated for the molecular function organic anion transporter activity, but there was no annotation for its involvement in any biological processes.
These are excellent examples in which curators might have annotated a particular gene for one of the GO category, but not for the others, even if such inferences were obvious. This type of missing annotations represent an unsurmountable obstacle for the classical ontological analysis used by all existing functional profiling tools that performs a simple lookup on one ontological category at a time. This shows that our proposed approach is able to perform automatic quality checks in annotation databases and bring to the attention of the curators obvious, yet missing, pieces of information.
Even more interestingly, our analysis was also able to link genes to specific functions even in those cases in which no other annotation available explicitly in GO would suggest such a very specific association. For example, our analysis predicted that SQLE [squalene epoxidase (H.sapiens)] is involved in cholesterol metabolism. It is known that squalene epoxidase is a key enzyme in cholesterol biosynthesis. This enzyme catalyzes the conversion of squalene to (S)-squalene-2,3-epoxide, the first reaction in a chain of reactions that will lead to the formation of cholesterol. A subsequent literature search showed that this gene is also highly regulated by cholesterol (Nagai et al., 2002). Thus, this involvement of SQLE in the cholesterol metabolism is strongly supported by both well-known biochemical pathways and by recent literature.
Another very accurate and extremely specific prediction was obtained for HMOX2 [heme oxygenase (decycling) 2 (H.sapiens)]. The existing GO annotations only link HMOX to the process of heme oxidation. In contrast, our analysis was able to predict that HMOX2 is involved in pigment biosynthesis. This prediction is supported by McCoubrey et al. (1992) who characterized the human heme oxygenase 2 and showed that it has a significant heme oxigenase activity. It is known that heme oxygenase catalyzes the conversion of heme to biliverdin, a green pigment that is subsequently converted to bilirubin, a reddish-yellow pigment.
Another example is the prediction of the relationship POP4 [processing of precursor 4, ribonuclease P/MRP subunit (Saccharomyces cerevisiae) (H.sapiens)] with the ribonuclease P complex cellular component. This gene has been previously annotated for ribonuc-lease P activity. However, a protein can be involved in ribonuclease P activity without being necessarily included in the ribonuclease P complex. The literature search revealed that our prediction is strongly supported by van Eenennaam et al. (1999) who suggested that hPOP4, the protein encoded by this gene, is a subunit of the human RNase MRP and RNase P ribonucleoprotein complexes. Even if hPOP4 is probably not directly bound to the RNase MRP and RNase PRNA components, it is suggested that hPop4 binds to the respective complexes through protein–protein interactions.
Several other interesting predictions are shown in Table 1. All predictions shown here are supported by peer-reviewed articles as well as other existing annotations. Figure 4 shows a small part of the matrix representing the semantic associations between the genes and the functions. In this figure, the height represents the strength of the predicted association between gene and a function. The colors represent various height ranges (red is > 0.9).
Table 1.
Other predicted associations between genes and several ontological categories
| Gene | Predicted association |
|---|---|
| DGKD [diacylglycerol kinase, delta 130 kDa (Homo sapiens)] | Triacylglycerol metabolism (BP) |
| SLC1A7 [solute carrier family 1 (glutamate transporter), member 7 (Homo sapiens)] | Amino acid transport (BP) |
| OXT [oxytocin, prepro- (neurophysin I) (Homo sapiens)] | Pregnancy (BP) |
| OXCT1 [3-oxoacid CoA transferase 1 (Homo sapiens)] | Ricarboxylic acid cycle (BP) |
| GRM6 [glutamate receptor, metabotropic 6 (Homo sapiens)] | Phototransduction (BP) |
| CHRNB3 [cholinergic receptor, nicotinic, beta polypeptide 3 (Homo sapiens)] | Acetylcholine binding (MF) |
| CD47 [CD47 antigen (Rh-related antigen, integrin-associated signal transducer) (Homo sapiens)] | Integrin complex (CC) |
| GRIN2D (glutamate receptor, ionotropic, N-methyl D-aspartate 2D) | Glutamate signaling pathway (BP) |
| SLC1A4 [solute carrier family 1 (glutamate/neutral amino acid transporter), member 4 (Homo sapiens)] | Acidic amino acid transporter activity (MF) |
BP stands for biological process, MF stands for molecular function and CC stands for cellular component. These are shown in yellow in Fig. 4.
Fig. 4.
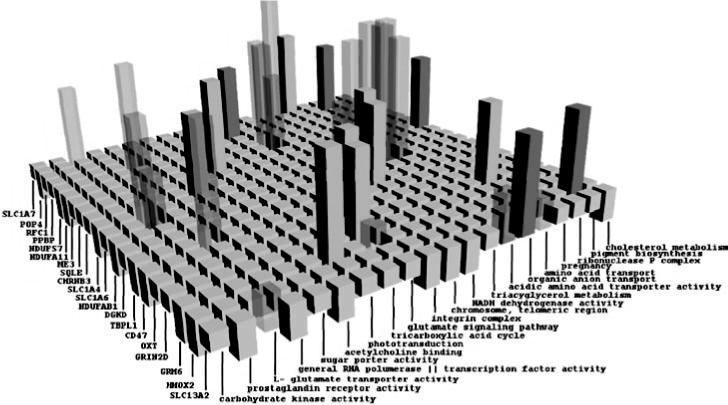
Novel gene–function relationships discovered by our analysis. Each bar represents the relationships between the corresponding gene and function. The height shows the predicted strength of the relationship. The relationships in red are discussed in details in the text. The ones in yellow are detailed in Table 1.
The receiver operating characteristic (ROC) curve is a method often used to evaluate the quality of diagnostic tests and prediction algorithms. The ROC curve is defined as a plot of sensitivity versus 1-specificity (the TP rate versus the FP rate). Figure 5 shows the ROC curve for our method using the definitions of the FP and TP above. The area under the curve (AUC) represents the average value of sensitivity for all possible values of specificity. As illustrated in Figure 5, the AUC for our algorithm is 0.99, which reflects the fact that most of our gene–function assignments are in concordance with the original GO annotations.
Fig. 5.
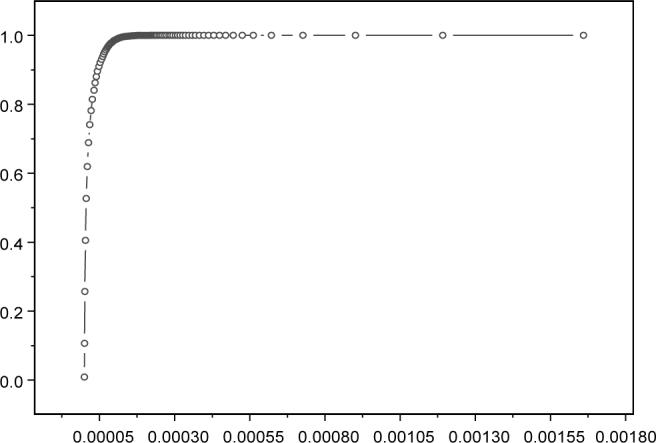
The ROC curve (sensitivity versus 1-specificity). The AUC is 0.99. Note the graph is enlarged and only shows the region up to 0.0018 on the horizontal axis. The graph shows that most of our gene-function assignments are in concordance with the original GO annotations.
Out of the 212 predicted associations, we were able to find evidence supporting 161 of them. This represents 75.95% of the putative gene–function assignments proposed by our method. Only one of our predictions (0.4%) was contradicted by the existing literature. We could not find any relevant articles for 23.58% of our predictions. These predictions are truly novel and remain to be verified by future research. Our analysis did not find any clear semantic inconsistencies in the current human annotation data analyzed.
4 CONCLUSIONS
Gene annotation databases represent an essential resource for modern research in genetics. Such databases are used on a daily basis by thousands of researchers worldwide. However, it is well known that these annotations are incomplete and it is likely that some annotations are also incorrect. In this paper, we have proposed a method that can be used to perform a global semantic analysis of the content of such databases using a latent semantic indexing approach. The technique proposed is able to predict novel functional annotations for known genes as well as find the weak semantic links. The method is independent of the organism and can be used to analyze and improve the quality of the data of any public or private annotation database.
ACKNOWLEDGEMENTS
This work has been supported by the following grants: NSF DBI-0234806, DOD DAMD 17-03-02-0035, NIH(NCRR) 1S10 RR017857-01, MLSC MEDC-538 and MEDC GR-352, NIH 1R21 CA10074001, 1R21 EB00990-01 and 1R01 NS045207-01. Fig. 4 was obtained with sv3D. The help of Adrian Marcus and Andrey Sergheyev in producing this figure is gratefully acknowledged.
Footnotes
Conflict of Interest: none declared.
REFERENCES
- Al-Shahrour F, et al. FatiGO: a web tool for finding significant associations of Gene Ontology terms with groups of genes. Bioinformatics. 2004;20:578–580. doi: 10.1093/bioinformatics/btg455. [DOI] [PubMed] [Google Scholar]
- Alter O, et al. Singular value decomposition for genome-wide expression data processing and modeling. Proc. Natl Acad. Sci. USA. 2000;97:10101–10106. doi: 10.1073/pnas.97.18.10101. [DOI] [PMC free article] [PubMed] [Google Scholar]
- Ashburner M, et al. Gene ontology: tool for the unification of biology. Nat. Genet. 2000;25:25–29. doi: 10.1038/75556. [DOI] [PMC free article] [PubMed] [Google Scholar]
- Beissbarth T, Speed TP. GOstat: find statistically overrepresented gene ontologies within a group of genes. Bioinformatics. 2004;20:1464–1465. doi: 10.1093/bioinformatics/bth088. [DOI] [PubMed] [Google Scholar]
- Brown MPS, et al. Knowledge-based analysis of microarray gene expression data by using support vector machines. Proc. Natl Acad. Sci. USA. 2000;97:262–267. doi: 10.1073/pnas.97.1.262. [DOI] [PMC free article] [PubMed] [Google Scholar]
- Dempster AP, et al. Maximum-likelihood from incomplete data via the EM algorithm. Journal of Royal Statist. Soc. Ser. B. 1977;39:1–39. [Google Scholar]
- Devos D, Valencia A. Practical limits of function prediction. PROTEINS. 2000;41:98–107. [PubMed] [Google Scholar]
- Drăghici S, et al. Global functional profiling of gene expression. Genomics. 2003a;81:98–104. doi: 10.1016/s0888-7543(02)00021-6. [DOI] [PubMed] [Google Scholar]
- Drăghici S, et al. Onto-Tools, the toolkit of the modern biologist: Onto-Express, Onto-Compare, Onto-Design and Onto-Translate. Nucleic Acids Res. 2003b;31:3775–3781. doi: 10.1093/nar/gkg624. [DOI] [PMC free article] [PubMed] [Google Scholar]
- Eisen MB, et al. Cluster analysis and display of genome-wide expression patterns. Proc. Natl Acad. Sci. USA. 1998;95:14863–14868. doi: 10.1073/pnas.95.25.14863. [DOI] [PMC free article] [PubMed] [Google Scholar]
- Fetrow JS, et al. Genomic-scale comparison of sequence- and structure-baed methods of function prediction: Does structure provide additional insight? Prot. Sci. 2001;10:1005–1014. doi: 10.1110/ps.49201. [DOI] [PMC free article] [PubMed] [Google Scholar]
- Geller SC, et al. Transformation and normalization of oligonucleotide microarray data. Bioinformatics. 2003;19:1817–1823. doi: 10.1093/bioinformatics/btg245. [DOI] [PubMed] [Google Scholar]
- GO Consortium. Current Annotations. 2004.
- Golub G, van Loan CF. Matrix Computations. The Johns Hopkins University Press; Baltimore, MD: 1983. [Google Scholar]
- Herrero J, et al. Gene expression data processing. Bioinformatics. 2003;19:655–656. doi: 10.1093/bioinformatics/btg040. [DOI] [PubMed] [Google Scholar]
- Hosack DA, et al. Identifying biological themes within lists of genes with EASE. Genome Biol. 2003;4:R70. doi: 10.1186/gb-2003-4-10-r70. [DOI] [PMC free article] [PubMed] [Google Scholar]
- Hvidsten TR, Sandvik AK, Laegreid A, Komorowski J. Predictive gene function from gene expressions and ontologies. Pac. Symp. Biocomput. 2001:299–310. doi: 10.1142/9789814447362_0030. [DOI] [PubMed] [Google Scholar]
- Karp PD. What we do not know about sequence analysis and sequence databases. Bioinformatics. 1998;14:753–754. doi: 10.1093/bioinformatics/14.9.753. [DOI] [PubMed] [Google Scholar]
- Khatri P, et al. Onto-tools: an ensemble of web-accessible, ontology-based tools for the functional design and interpretation of high-throughput gene expression experiments. Nucleic Acids Res. 2004;32:W449–W456. doi: 10.1093/nar/gkh409. [DOI] [PMC free article] [PubMed] [Google Scholar]
- Khatri P, et al. Profiling gene expression with onto-express. Genomics. 2002;79:266–270. doi: 10.1006/geno.2002.6698. [DOI] [PubMed] [Google Scholar]
- King OD, et al. Predicting gene function from patterns of annotation. Genome Res. 2003;13:896–904. doi: 10.1101/gr.440803. [DOI] [PMC free article] [PubMed] [Google Scholar]
- Maletic JI, Marcus A, Feng L. Source Viewer 3D (sv3D)—A Framework for Software Visualisation. Formal Research Demonstration in Proceedings of the 25th IEEE/ACM International Conference on Software Engineering (ICSE 2003); Portland, OR. May 3−10.2003. pp. 812–813. [Google Scholar]
- McCoubrey WK, Jr, et al. Human heme oxygenase-2: characterization and expression of a full-length cDNA and evidence suggesting that the two HO-2 transcripts may differ by choice of polyadenylation signal. Arch. Biochem. Biophys. 1992;295:13–20. doi: 10.1016/0003-9861(92)90481-b. [DOI] [PubMed] [Google Scholar]
- Nagai M, et al. SREBP-2 and NF-Y are involved in the transcriptional regulation of sqalene epoxidase. Biochem. Biophys. Res. Commun. 2002;295:74–80. doi: 10.1016/s0006-291x(02)00623-x. [DOI] [PubMed] [Google Scholar]
- Pan W, et al. Model-based cluster analysis of microarray gene expression data. Genome Biol. 2002;3:research0009.1–research0009.8. doi: 10.1186/gb-2002-3-2-research0009. [DOI] [PMC free article] [PubMed] [Google Scholar]
- Quackenbush J. Microarrays–Guilt by Association. Science. 2003;302:240–241. doi: 10.1126/science.1090887. [DOI] [PubMed] [Google Scholar]
- Raychaudhuri S, et al. Associating genes with Gene Ontology codes using a maximum entropy analysis of biomedical literature. Genome Res. 2002;12:203–214. doi: 10.1101/gr.199701. [DOI] [PMC free article] [PubMed] [Google Scholar]
- Roch KGL, et al. Discovery of gene function by expression profiling of the malaria parasite life cycle. Science. 2003;301:1503–1508. doi: 10.1126/science.1087025. [DOI] [PubMed] [Google Scholar]
- Schug J, et al. Predicting gene ontology functions from promdom and CDD protein domains. Genome Res. 2002;12:648–655. doi: 10.1101/gr.222902. [DOI] [PMC free article] [PubMed] [Google Scholar]
- Skolnick J, Fetrow JS. From genes to protein structure and function: Novel applications of computational approaches in the genomic era. Trends Biotechnol. 2000;18:283–287. doi: 10.1016/s0167-7799(99)01398-0. [DOI] [PubMed] [Google Scholar]
- Uchiumi F, et al. Replication factor C recognizes 5′ -phosphate ends of telomeres. Biochem. Biophys. Res. Commun. 1996;229:310–315. doi: 10.1006/bbrc.1996.1798. [DOI] [PubMed] [Google Scholar]
- van Eenennaam H, et al. hPop4: a new protein subunit of the human RNase MRP and RNase P ribonucleoprotein complexes. Nucleic Acids Res. 1999;12:2465–2472. doi: 10.1093/nar/27.12.2465. [DOI] [PMC free article] [PubMed] [Google Scholar]
- Walker MG, et al. Prediction of gene function by genome-scale expression analysis: prostate cancer-associated genes. Genome Res. 1999;9:1198–1203. doi: 10.1101/gr.9.12.1198. [DOI] [PMC free article] [PubMed] [Google Scholar]
- Wang H, Azuaje F, Bodenreider O, Dopazo J. Proceedings of the 2004 IEEE Symposium on Computational Intelligence in Bioinformatics and Computational Biology. IEEE Press; La Jolla, CA: 2004. Gene expression correlation and gene ontology-based similarity: an assessment of quantitative relationships. pp. 25–31. [DOI] [PMC free article] [PubMed] [Google Scholar]
- Wu LF, et al. Large-scale prediction of saccharomyces cerevisiae gene function using overlapping transcriptional clusters. Nat. Genet. 2002;31:255–265. doi: 10.1038/ng906. [DOI] [PubMed] [Google Scholar]
- Zeeberg BR, et al. A resource for biological interpretation of genomic and proteomic data. Genome Biol. 2003;4:R28. doi: 10.1186/gb-2003-4-4-r28. [DOI] [PMC free article] [PubMed] [Google Scholar]
- Zhang B, et al. GOTree Machine (GOTM): a web-based platform for interpreting sets of interesting genes using Gene Ontology hierarchies. BMC Bioinformatics. 2004;5:16. doi: 10.1186/1471-2105-5-16. [DOI] [PMC free article] [PubMed] [Google Scholar]
- Zhou G, et al. B.E.A.R. GeneInfo: a tool for identifying gene-related biomedical publications through user modifiable queries. BMC Bioinformatics. 2004;5:46. doi: 10.1186/1471-2105-5-46. [DOI] [PMC free article] [PubMed] [Google Scholar]