

Abstract
Purpose
Individuals with knee osteoarthritis (OA) experience pain, frontal plane joint laxity and instability. Co-contraction can control laxity and instability but may place constraints on the variability of the knee’s motion during gait. Slight variation among gait cycles is normal, but reduced variability of joint motions could be detrimental. The purpose of this study was to quantify knee motion variability during gait and assess the influence of muscle activity, frontal plane laxity, and pain on knee movement variability in patients with medial knee OA.
Methods
Fifteen subjects with unilateral medial knee OA and 15 age and gender matched uninjured subjects underwent gait analysis, with electromyography to compute co-contraction. Stress radiographs were obtained for measuring frontal plane laxity. Knee motion variability was assessed from the phase angle (knee angle vs. angular velocity) during early stance.
Results
Despite altered involved side knee kinematics and kinetics, individuals with knee OA showed involved side frontal plane variability which was not significantly different from the control group, but was significantly lower than the variability of the uninvolved knee’s motion. Laxity and medial co-contraction influenced the amount of joint motion variability in the involved knee of the OA subjects. Pain did not influence variability.
Conclusion
Patients with medial knee OA displayed altered involved knee kinematics and kinetics, although stride-to-stride variability of knee motion was unchanged. Evidence of excessive joint motion variability on the uninvolved side, however, may provide insight into the development of OA in the contralateral cognate joint.
Keywords: motor control, gait, muscle function, instability, varus
Introduction
Knee osteoarthritis (OA) is marked by the progressive erosion of articular cartilage, subchondral sclerosis, and osteophyte growth at the joint margins. Patients may also experience ligamentous laxity, muscle weakness, joint instability, and debilitating pain.1
Joint pain in patients with knee OA can provoke a stereotypical knee stiffening pattern during gait.2,3 The measurement of joint angles at discrete time points provides valuable information, yet may represent an incomplete analysis because it ignores the inherent variability involved in the completion of a movement task. Uninjured subjects perform successive cycles (e.g. steps, strides) of rhythmic movements, such as gait, in a similar, but not identical manner with each repetition.4 This is because the inherent redundancy of the motor components allows for multiple solutions to joint coordination in order to achieve the same control of the foot’s path. The variability of joint motions may therefore reflect flexibility of movement patterns used to achieve control of important performance variables. We are particularly concerned with the variability of the knee joint’s motion during gait, which we define as the stride-to-stride variability of the knee’s angular position and velocity with each step.
Individuals with knee OA could potentially experience knee joint damage or pain due to the presence of either too much or too little knee motion variability. An increase in knee joint motion variability could indicate inadequate control of the joint. Conversely, a substantial reduction in knee motion variability could lead to an inability to adequately adjust to perturbations and attenuate impact shocks.5 Additionally, joint surfaces would undergo similar stresses with each repetition, potentially leading to articular cartilage destruction. Therefore, the use of sufficient, but not excessively varied joint motions with each repetition may aid in the redistribution of stress across the joint.6
Individuals with knee OA may reduce the variability of the knee joint’s motion for several reasons. Pain could contribute to the overuse of similar, less painful knee joint motions6 which may further damage a joint that has already begun to undergo structural and biochemical alterations. Radin et al.7 speculated that progressive cartilage erosion was due to the continuous repetitive microtrauma that the joint undergoes on a daily basis. In vitro animal experiments have confirmed that cyclic loading of articular cartilage contributes to breakdown.8,9 A failure to use more varied joint motions could therefore theoretically accelerate the degeneration of the articular surface. Perhaps a better explanation, however, is that the development of frontal plane laxity may lead to joint instability, requiring increased muscular control to stabilize the joint.10,11 Individuals with medial knee OA attempt to stabilize the knee during gait with greater medial co-contraction, resulting in reduced joint excursions 12 and perhaps less varied knee joint motions.
The purpose of this study was to quantify the variability of knee motion in patients with medial knee OA. Our hypothesis was that patients with medial knee OA would demonstrate reduced variability of the knee’s frontal and sagittal plane motions during gait compared to their uninvolved knees or the knees of a matched control group. In addition, we expected that pain, frontal plane joint laxity, and muscular co-contraction during gait would provide insight into the mechanism underlying alterations in knee motion variability.
Methods
Subjects
Fifteen patients (6 females, 9 males; age: 48.7±7.4 years, height: 1.75±.09m, weight: 91.9±17.4kg) with unilateral symptomatic, medial compartment knee osteoarthritis and genu varum (OA group) scheduled for high tibial osteotomy were tested. The diagnosis of OA was made from the clinical history, a physical examination, and radiographic changes observed during standing with the knees flexed to 30°. These radiographs showed definite joint space narrowing in the medial compartment (medial compartment: 1.6±1.1mm; lateral compartment: 6.2±1.4mm). All subjects were asymptomatic on the uninvolved side with adequate articular cartilage (medial: 4.6±1.4mm; lateral: 5.0±1.6mm). Assessment of skeletal alignment was made from a weight-bearing radiograph that contained the entire lower extremity, from the hip joints to the feet.13 A “weight bearing line” is drawn from the center of the femoral head to the center of the ankle mortise. The perpendicular distance from this weight bearing line to the medial edge of the proximal tibia is divided by the width of the proximal tibia. A weight-bearing line of less than 50% therefore indicates varus alignment. The OA group had a weight-bearing line of 18.9±12.7% on the involved side. Subjects who had torn knee ligaments, lateral compartment or patellofemoral osteoarthritis, other orthopedic problems or neurological damage in either lower extremity or a Body Mass Index of ≥ 40 were excluded from the study.
A control group of fifteen age- and gender-matched healthy subjects (6 females, 9 males; age: 48.4±6.3 years, height: 1.71±.09m, weight: 83.8±17.3kg) with no evidence of knee OA underwent identical testing to the OA group on a randomly chosen limb. The control group had a weight bearing line of 45.1±8.1% and had 5.0±1.0mm of joint space in the medial compartment and 6.3±1.3mm in the lateral compartment. All subjects were informed of the purpose of the study and signed informed consent forms approved by the IRB prior to testing.
Pain
Pain was assessed using the response to the following question: “To what degree does pain affect your level of daily activity?” taken from the Knee Outcome Survey-Activities of Daily Living Scale.14 Responses are taken from a six point scale where five represents no effect of pain on activities of daily living and zero represents an inability to perform activities of daily living because of pain. Reliability and responsiveness of the questionnaire for assessing knee function has been assessed and reported by others.14,15
Frontal Plane Joint Laxity
Measurements of frontal plane joint laxity has been described previously.12 Briefly, frontal plane laxity was measured from stress radiographs obtained with subjects lying supine with the knee supported and flexed 20°. A TELOS stress device (Austin & Associates, Fallston, MD) was used to reliably apply a 15daN (33lbs) force to generate varus and valgus forces.16 Joint space was measured during both varus and valgus stresses. Medial joint laxity was calculated as the medial joint space during a valgus stress minus the medial joint space during a varus stress. Lateral laxity is the lateral joint space during a varus stress minus the lateral joint space during a valgus stress.17 Intraclass correlation coefficients (ICC) (3, 1) of repeated measurements on eight healthy subjects revealed reliability of 0.95 for lateral and 0.97 for medial laxity measurements.
Motion Analysis
All subjects underwent gait analysis with surface electromyography. The motions of the lower extremity segments were tracked with a six camera VICON 512 motion analysis system (Oxford Metrics, UK) collecting at 120Hz while subjects walked across a 6-component force plate (Bertec Corp, Worthington, OH). Limb segments were identified by 25mm, retro reflective markers placed over the greater trochanters, lateral femoral condyles, lateral malleolus, and the heads of the fifth metatarsals to identify appropriate joint centers. Rigid thermoplastic shells, each with four markers firmly affixed, were attached to the thigh and shank. The foot’s coordinate system was tracked by the marker placed over the fifth metatarsal head and two markers placed on the posterior heel counter of the shoe. Walking velocity is believed to influence pattern variability and therefore, walking trials were repeated until 10 trials were collected in which the self-selected velocity did not vary by more than five percent from the practice trials and only the test foot struck the force plate without targeting.
Electromyography (EMG) was recorded at 1920Hz using a 16-channel system (Motion Lab Systems, Baton Rouge, LA) interfaced with the VICON for simultaneous recording. Active surface electrodes were taped over the mid-muscle belly of the vastus lateralis, vastus medialis, medial and lateral hamstrings, and the medial and lateral heads of the gastrocnemius. Muscle testing was used for verification of electrode placement and for collection of a maximum signal for normalization.
Data Management and Processing
Marker trajectories were filtered with a six Hz low-pass Butterworth filter. A rigid body analysis (Move3D, NIH Biomechanics Laboratory, Bethesda, MD) was used to calculate knee joint angles in the sagittal and frontal plane using the joint coordinate system18, and were then time normalized to the stance phase. Internal joint moments were calculated using inverse dynamics and normalized to body mass and height. EMG data were bandpass filtered from 20-1000Hz in the hardware prior to sampling. Custom written software filtered the signals using a 350Hz low-pass Butterworth filter. The raw data were converted to a linear envelope through full wave rectification, followed by a phase corrected eight-order Butterworth filter with a low pass cutoff frequency of 20Hz. The linear envelope was normalized to the MVIC trials and was used for calculation of the co-contraction index. Co-contraction is defined as the simultaneous activation of antagonistic muscles and is calculated according to the following equation:19
| 1 |
This equation was calculated for the vastus lateralis-lateral hamstrings (VLLH), the vastus medialis-medial hamstrings (VMMH), vastus lateralis-lateral gastrocnemius (VLLG), and the vastus medialis-medial gastrocnemius (VMMG) for the time between 100msec prior to initial contact to the time of peak knee adduction moment. This interval was normalized to 100 data points to account for any potential differences in walking velocity.
Knee motion variability was calculated from a plot of the knee joint’s angle (θ) vs. angular velocity (ω) during stance.6 The horizontal axis (angle) was normalized according to the following equation:
| 2 |
where θ represents the joint angle, and i is each data point during stance. The vertical axis (velocity) was calculated as:
| 3 |
where ω is the first derivative of the joint’s angular position, at each data point i during stance. From this plot, the phase angle (ϕ) was calculated as the angle between the positive horizontal axis and a line connecting the origin (0,0) to each successive data point (Figure 1). The phase angle was obtained for each time point i, for all trials, and the standard deviation across trials was then calculated at each point i.20 To quantify variability for a subject, an average of these standard deviation values was calculated from initial contact to peak knee adduction moment to measure knee joint cycle-to-cycle variability. We termed this measure the “variability index”. We were particularly concerned with this time interval because of the potential for heel strike to contribute to knee instability and because of the rapid rise in the adduction moment, which is related to the compressive force on the medial compartment of the knee.21 The variability of the knee’s movement was calculated in both the sagittal and frontal planes, and termed the “sagittal plane variability index” and the “frontal plane variability index”, respectively.
Figure 1.
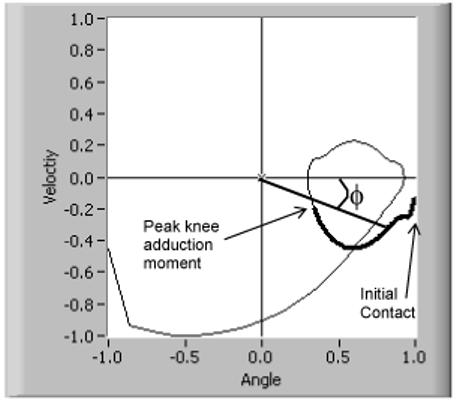
Representative phase plot of one trial for one subject. The normalized knee flexion angle is plotted against the normalized angular velocity. The phase angle (ϕ) is calculated at each point between initial contact and peak knee adduction moment (thickened line).
Statistical Analysis
Statistical analysis was performed using SPSS (version 11.0, Chicago, IL). Differences in the OA group’s involved to uninvolved variability indices, kinematics and kinetics, knee laxity, and co-contraction were tested using paired t-tests. Group differences between the OA and control group were tested using independent samples t-tests. Pearson correlation coefficients were used to determine the presence of a relationship between the involved and uninvolved limbs for the frontal and sagittal variability indices. Multiple regression was used to assess the effect of co-contraction, laxity, and pain on variability indices. Significance was set at α=0.05.
Results
Joint kinematics and kinetics
The OA and control subjects walked at a velocity of 1.37±0.13m/s and 1.44±0.16m/s respectively (p=0.219). The knee flexion excursion during weight acceptance was significantly less on the OA group’s involved side (9.6±4.4°) compared to the uninvolved side (15.4±5.2°; p=0.003) or controls (14.7±3.6°; p=0.002). The involved knee extension moment at peak knee flexion was 0.124±0.186 Nmm/kgm, which was significantly less than the uninvolved knee extension moment of 0.281±0.166 Nmm/kgm (p=0.005) and the control group’s moment of 0.244±0.121 Nmm/kgm (p=0.046)(Figure 2).
Figure 2.
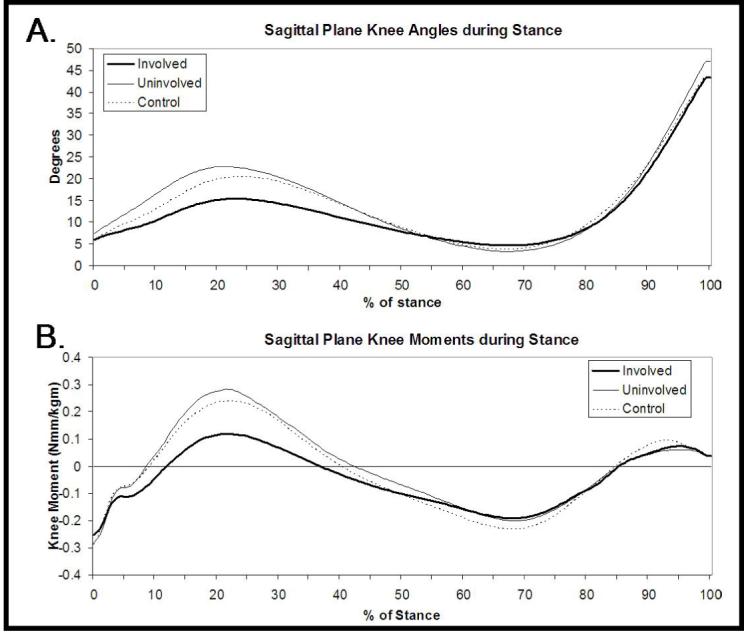
Sagittal plane knee angles (A) and moments (B) during stance.
Knee motion variability
The OA group’s involved frontal plane variability index was not significantly different from the control group (p=0.773)(Figure 3). The uninvolved frontal plane variability index was significantly greater than both the involved (p=0.007) and the control group (p=0.007). No difference was observed in the sagittal plane variability index between the involved and uninvolved limbs (p=0.176). In addition, the control group’s sagittal plane variability index was not different from either the involved (p=0.805) or uninvolved limbs (p=0.229) of the OA patients. No correlation was observed between the OA group’s involved and uninvolved side variability indices in either the frontal (R=-0.062, p=0.832) or sagittal (R=0.176, p=0.547) planes.
Figure 3.
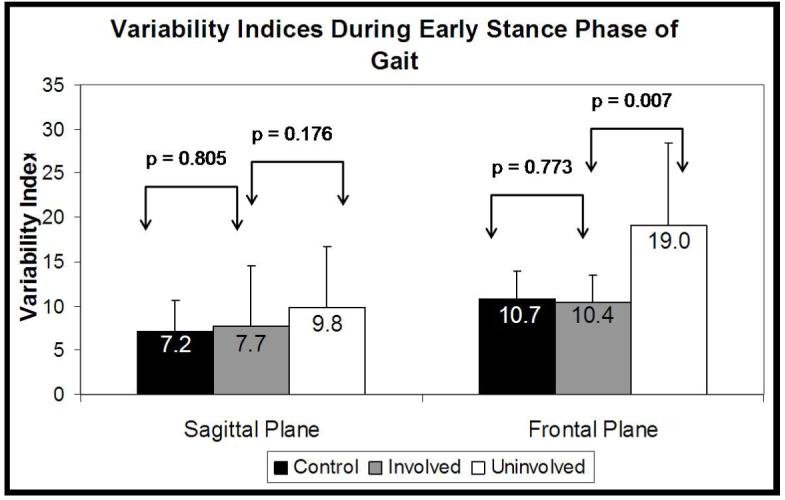
Sagittal and frontal plane variability indices. Values represent means and standard deviations.
Knee joint laxity
Medial joint laxity was 4.9±1.8mm on the involved side, which was significantly greater than the control group’s medial laxity measurement of 3.2±0.9mm (p=0.004) and showed a trend towards greater medial laxity than the uninvolved side (4.2±1.8mm; p=0.080). The uninvolved side also showed a trend towards greater medial laxity than the control group (p=0.086). Lateral joint laxity was not significantly different in the OA group’s involved side (3.5±1.5mm) compared to the uninvolved (4.2±2.4mm; p=0.123) and control group’s lateral laxity (4.0±1.4mm; p=0.354).
Co-contraction index
The OA group’s involved side VLLH co-contraction index of 25.5±10.6 was significantly greater than that of the uninvolved side (17.3±6.8; p=0.010). No differences were observed between the involved and uninvolved sides for the VLLG, VMMH, or VMMG co-contraction indices (Figure 4). The control group (9.8±7.1) had a significantly lower VMMG co-contraction index compared to both the OA group’s involved (16.0±7.4; p=0.031) and uninvolved (15.3±6.6; p=0.045) sides.
Figure 4.

Co-contraction indices for the control group, and the involved and uninvolved sides for the OA group.
A linear regression analysis revealed no significant relationship between pain (mean=2; SD=1) and either the sagittal (r2=0.020, p=0.615) or frontal plane (r2=0.061, p=0.377) variability indices. Medial co-contraction values together (VMMH and VMMG) accounted for a significant portion of the variance in the frontal plane variability of the OA group’s involved side (r2=0.565, p=0.016). Both medial (r2=0.282, p=0.051) and lateral joint laxity (r2=0.474, p=0.006) accounted for a significant portion of the variance in the OA group’s involved frontal plane variability indices (Figure 5). For both the OA group’s uninvolved side as well as the Control group, however, no significant relationship was observed between laxity and frontal plane variability indices (p>0.05).
Figure 5.
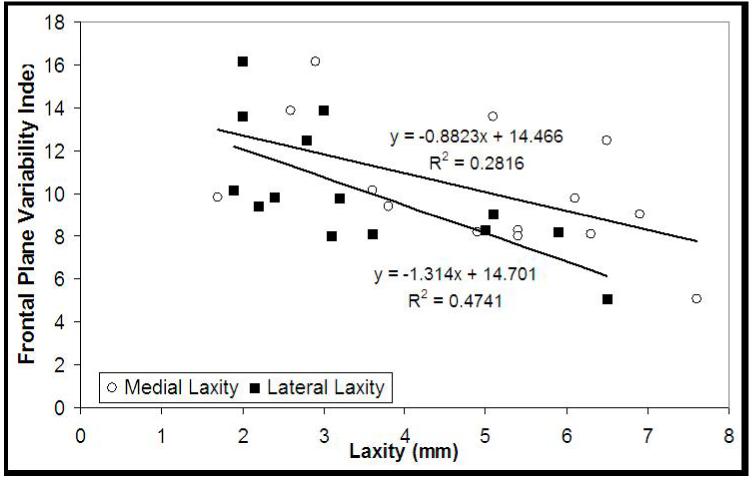
Relationship between the OA group’s involved side frontal plane variability index and medial joint laxity (open circles) and lateral joint laxity (closed squares).
Discussion
The hypothesis that the involved limb of patients with medial knee OA would demonstrate less varied knee motion during gait was partially supported by these data. The frontal plane variability of the involved limb was significantly lower than the variability of the uninvolved knee but not different from the control group. Frontal plane knee laxity and medial co-contraction partially influenced the amount of joint motion variability in the involved knee in individuals with unilateral knee OA. Pain did not influence variability in this sample.
The frontal plane knee variability findings were somewhat perplexing. Was the variability of the involved knee diminished or was the variability of the uninvolved knee increased? Perhaps the control, uninvolved, and involved knees represent a spectrum of health and disease. The uninvolved knees of the OA group, while showing no overt signs of OA, had somewhat greater medial laxity and higher VMMG co-contraction values than the control knees, but normal knee excursions. The involved knees also had higher co-contraction values but stiffened the knee during weight acceptance.2,3 These data may reflect a continuum of control strategies for patients with knee OA, where an initial increase in laxity, as seen in the uninvolved knee, is met with an increase in the variability of the knee joint’s motion. Such an increase may indicate either inadequate control or may reflect inter-limb compensations for the involved knee. As OA progresses, a substantial reduction in joint motion variability may occur, mediated by higher medial co-contraction values and observed as a truncated knee flexion excursion during gait ,which may ultimately result in disease progression.12 Our subjects already had knee OA, meaning that we are unable to determine whether observed differences in knee motion variability are the cause or the result of the knee OA.
We had hypothesized that the presence of pain would reduce the variability of the knee joint’s motion. The subjects may have learned to use only knee motions that minimized pain, effectively eliminating movement options. Pain, however, was not related to knee motion variability for this group of subjects.
Recent work has also demonstrated that knee instability is a significant problem in patients with knee OA,10 as instability can result from an inability to control excessive joint laxity. The presence of instability in this population raises the possibility that the CNS is unable to deviate from a few similar knee joint motions because of the tightly constrained muscular requirements necessary for controlling greater laxity. In the involved limb, frontal plane laxity significantly influenced frontal plane variability so that individuals with greater laxity exhibited less variable knee motions. Presumably, the greater medial co-contraction was used to control laxity to minimize instability. Therefore, therapeutic interventions that target joint laxity and the subsequent instability may be successful.22
At any given moment during gait, many combinations of knee angles and angular velocities are available, controlled by multiple muscles crossing the knee joint. Although the involved side’s motion variability was not different from the control group, the uninvolved limb demonstrated many different combinations of frontal plane knee angle and angular velocity, possibly reflecting decreased joint control with each step. Increased variability has previously been observed in the uninvolved limb of children with spastic hemiplegic cerebral palsy.23 The authors attributed the increased variability on the uninvolved side to be a compensatory mechanism for impairments on the involved side. In patients with knee OA, greater variability in the uninvolved knee has important clinical implications as the joint may be at greater risk of joint damage. This is particular important, as many individuals with unilateral knee OA eventually develop symptoms of knee OA on the contralateral side.24 We can speculate that the increased variability of the uninvolved knee joint’s motion, undetectable by examining joint kinematics at discrete time points, may lead to a greater risk of articular cartilage damage and may provide insight into the mechanism underlying the high incidence of bilateral knee OA. It remains unclear, however, which factors predispose an individual with unilateral knee OA to increase variability on the uninvolved side. The establishment of these factors may aid in the determination of who may progress to bilateral knee OA.
In summary, this study provides important information about how individuals with unilateral knee OA walk and about the potential consequences of more variable knee joint motion of the uninvolved limb during gait. Patients with unilateral medial knee OA display altered knee kinematics and kinetics on the involved side, although stride-to-stride variability of knee motion was unchanged on the involved side. Evidence of excessive joint motion variability on the uninvolved side, however, may provide insight into the development of OA in the contralateral cognate joint.
Acknowledgements
The authors would like to acknowledge the assistance of Darcy Reisman, PhD, PT, William Newcomb, MD, Laura C. Schmitt, PT, Daniel Ramsey, PhD, and Laurie Andrews, RTR. Funding was provided by the American College of Sports Medicine (Doctoral Student Research Grant), National Institute of Health (1P20RR016458, 2T32HD007490), the Foundation for Physical Therapy (PODS II), and EBI Medical, L.P.
Contributor Information
Michael D. Lewek, PT was a doctoral student in the Biomechanics and Movement Science Program, Department of Physical Therapy, University of Delaware at the time of the study. He is currently a post-doctoral fellow at the Sensory Motor Performance Program, Rehabilitation Institute of Chicago and Department of Physical Medicine & Rehabilitation, Northwestern University, Chicago, IL 60611.
John Scholz, PT is Associate Professor in the Department of Physical Therapy and Biomechanics and Movement Science Program, University of Delaware, Newark, DE 19716.
Katherine S. Rudolph, PT is Assistant Professor in the Department of Physical Therapy and Biomechanics and Movement Science Program, University of Delaware, Newark, DE 19716.
Lynn Snyder-Mackler, PT, ATC is Professor in the Department of Physical Therapy and Biomechanics and Movement Science Program, University of Delaware, Newark, DE 19716.
References
- 1.Felson DT, Lawrence RC, et al. Osteoarthritis: New Insights. Part 2: Treatment Approaches. Ann Intern Med. 2000;133(9):726–737. doi: 10.7326/0003-4819-133-9-200011070-00015. [DOI] [PubMed] [Google Scholar]
- 2.Fisher NM, White SC, et al. Muscle function and gait in patients with knee osteoarthritis before and after muscle rehabilitation. Disabil Rehabil. 1997;19(2):47–55. doi: 10.3109/09638289709166827. [DOI] [PubMed] [Google Scholar]
- 3.Messier SP, Loeser RF, et al. Osteoarthritis of the knee: effects on gait, strength, and flexibility. Arch Phys Med Rehabil. 1992;73(1):29–36. [PubMed] [Google Scholar]
- 4.Turvey MT. Coordination. Am Psychol. 1990;45(8):938–53. doi: 10.1037//0003-066x.45.8.938. [DOI] [PubMed] [Google Scholar]
- 5.Heiderscheit BC. Movement variability as a clinical measure for locomotion. J Appl Biomech. 2000;16:419–427. [Google Scholar]
- 6.Hamill J, van Emmerik RE, et al. A dynamical systems approach to lower extremity running injuries. Clin Biomech (Bristol, Avon) 1999;14(5):297–308. doi: 10.1016/s0268-0033(98)90092-4. [DOI] [PubMed] [Google Scholar]
- 7.Radin EL, Yang KH, et al. Relationship between lower limb dynamics and knee joint pain. J Orthop Res. 1991;9(3):398–405. doi: 10.1002/jor.1100090312. [DOI] [PubMed] [Google Scholar]
- 8.Thibault M, Poole AR, et al. Cyclic compression of cartilage/bone explants in vitro leads to physical weakening, mechanical breakdown of collagen and release of matrix fragments. J Orthop Res. 2002;20(6):1265–73. doi: 10.1016/S0736-0266(02)00070-0. [DOI] [PubMed] [Google Scholar]
- 9.Torzilli PA, Grigiene R. Continuous cyclic load reduces proteoglycan release from articular cartilage. Osteoarthritis Cartilage. 1998;6(4):260–8. doi: 10.1053/joca.1998.0119. [DOI] [PubMed] [Google Scholar]
- 10.Fitzgerald GK, Piva SR, et al. Reports of joint instability in knee osteoarthritis: its prevalence and relationship to physical function. Arthritis Rheum. 2004;51(6):941–6. doi: 10.1002/art.20825. [DOI] [PubMed] [Google Scholar]
- 11.Sharma L, Lou C, et al. Laxity in healthy and osteoarthritic knees. Arthritis Rheum. 1999;42(5):861–70. doi: 10.1002/1529-0131(199905)42:5<861::AID-ANR4>3.0.CO;2-N. [DOI] [PubMed] [Google Scholar]
- 12.Lewek MD, Rudolph KS, et al. Control of frontal plane knee laxity during gait in patients with medial compartment knee osteoarthritis. Osteoarthritis Cartilage. 2004;12(9):745–51. doi: 10.1016/j.joca.2004.05.005. [DOI] [PMC free article] [PubMed] [Google Scholar]
- 13.Dugdale TW, Noyes FR, et al. Preoperative planning for high tibial osteotomy. The effect of lateral tibiofemoral separation and tibiofemoral length. Clin Orthop. 1992;(274):248–64. [PubMed] [Google Scholar]
- 14.Irrgang JJ, Snyder-Mackler L, et al. Development of a patient-reported measure of function of the knee. J Bone Joint Surg Am. 1998;80(8):1132–45. doi: 10.2106/00004623-199808000-00006. [DOI] [PubMed] [Google Scholar]
- 15.Marx RG, Jones EC, et al. Reliability, validity, and responsiveness of four knee outcome scales for athletic patients. J Bone Joint Surg Am. 2001;83-A(10):1459–69. doi: 10.2106/00004623-200110000-00001. [DOI] [PubMed] [Google Scholar]
- 16.Tallroth K, Lindholm TS. Stress radiographs in the evaluation of degenerative femorotibial joint disease. Skeletal Radiol. 1987;16(8):617–20. doi: 10.1007/BF00357109. [DOI] [PubMed] [Google Scholar]
- 17.Moore TM, Meyers MH, et al. Collateral ligament laxity of the knee. Long-term comparison between plateau fractures and normal. J Bone Joint Surg Am. 1976;58(5):594–8. [PubMed] [Google Scholar]
- 18.Grood ES, Suntay WJ. A joint coordinate system for the clinical description of three-dimensional motions: application to the knee. J Biomech Eng. 1983;105(2):136–44. doi: 10.1115/1.3138397. [DOI] [PubMed] [Google Scholar]
- 19.Rudolph KS, Axe MJ, et al. Dynamic stability in the anterior cruciate ligament deficient knee. Knee Surg Sports Traumatol Arthrosc. 2001;9(2):62–71. doi: 10.1007/s001670000166. [DOI] [PubMed] [Google Scholar]
- 20.Batschelet E. Circular statistics in biology. Academic Press; London: 1981. [Google Scholar]
- 21.Schipplein OD, Andriacchi TP. Interaction between active and passive knee stabilizers during level walking. J Orthop Res. 1991;9(1):113–9. doi: 10.1002/jor.1100090114. [DOI] [PubMed] [Google Scholar]
- 22.Fitzgerald GK, Childs JD, et al. Agility and perturbation training for a physically active individual with knee osteoarthritis. Phys Ther. 2002;82(4):372–82. [PubMed] [Google Scholar]
- 23.Jeng SF, Holt KG, et al. Self-Optimization of Walking in Nondisabled Children and Children With Spastic Hemiplegic Cerebral Palsy. J Mot Behav. 1996;28(1):15–27. doi: 10.1080/00222895.1996.9941729. [DOI] [PubMed] [Google Scholar]
- 24.Chitnavis J, Sinsheimer JS, et al. End-stage coxarthrosis and gonarthrosis. Aetiology, clinical patterns and radiological features of idiopathic osteoarthritis. Rheumatology. 2000;39(6):612–9. doi: 10.1093/rheumatology/39.6.612. [DOI] [PubMed] [Google Scholar]