

Abstract
P0 glycoprotein is the major structural protein of peripheral nerve myelin where it is thought to modulate inter-membrane adhesion at both the extracellular apposition, which is labile upon changes in pH and ionic strength, and the cytoplasmic apposition, which is resistant to such changes. Most studies on P0 have focused on structure-function correlates in higher vertebrates. Here, we focused on its role in the structure and interactions of frog (Xenopus laevis) myelin, where it exists primarily in a dimeric form. As part of our study, we deduced the full sequence of Xenopus laevis P0 (xP0) from its cDNA. The xP0 sequence was found to be similar to P0 sequences of higher vertebrates, suggesting that a common mechanism of PNS myelin compaction via P0 interaction might have emerged through evolution. As previously reported for mouse PNS myelin, a similar change of extracellular apposition in frog PNS myelin as a function of pH and ionic strength was observed, which can be explained by a conformational change of P0 due to protonation-deprotonation of His52 at P0’s putative adhesive interface. On the other hand, the cytoplasmic apposition in frog PNS myelin, like that in the mouse, remained unchanged at different pH and ionic strength. The contribution of hydrophobic interactions to stabilizing the cytoplasmic apposition was tested by incubating sciatic nerves with detergents. Dramatic expansion at the cytoplasmic apposition was observed for both frog and mouse, indicating a common hydrophobic nature at this apposition. Urea also expanded the cytoplasmic apposition of frog myelin likely owing to denaturation of P0. Removal of the fatty acids that attached to the single Cys residue in the cytoplasmic domain of P0 did not change PNS myelin structure of either frog or mouse, suggesting that the P0-attached fatty acyl chain does not play a significant role in PNS myelin compaction and stability. These results help clarify the present understanding of P0’s adhesion role and the role of its acylation in compact PNS myelin.
Keywords: x-ray diffraction, membrane-membrane interactions, protein zero cDNA, PNS, detergents, hydroxylamine, adhesion protein, frog, mass spectrometry
1. Introduction
Mouse PNS myelin structure and stability at different pH and ionic strength have been studied by x-ray diffraction (Inouye and Kirschner, 1988a; Inouye and Kirschner, 1988b). As shown, myelin swelling and compaction at its extracellular apposition can be largely accounted for by a balance between electrostatic repulsion and van der Waals attraction between membrane surfaces according to the DLVO theory of colloid stability. The width of this apposition (and myelin period) change as a function of pH at physiological ionic strength, i.e., the native period is stable only at neutral to slightly alkaline pH but increases at lower pH. Compaction to the native period from the swollen period at neutral pH is proposed to arise from the ionic interaction between deprotonated His52 and positive-charged Arg45′ at the putative adhesive interface between trans-oriented P0 extracellular domains (P0-ed; (Shapiro et al., 1996)). The cytoplasmic apposition, by contrast, is nearly constant at different pH and ionic strength, and therefore unlikely to result from electrostatic interaction; rather, the stable apposition may arise, in part, from hydrophobic interactions (Inouye and Kirschner, 1988a; Inouye and Kirschner, 1988b) or may be related to the acylation of the single Cys residue in the P0 cytoplasmic domain (P0-cyt) (Bizzozero et al., 1994; Inouye et al., 1999). Recent solution studies of P0-cyt reconstituted in lipid vesicles by circular dichroism and fluorescence spectroscopy suggest that intermolecular interactions involving β-strands in the apposed P0-cyt molecules are likely to be responsible for the tight cytoplasmic apposition (Luo et al., 2007).
In the last two decades, sequences of P0 from different species have been reported, including Rattus norvegicu: rat (Lemke and Axel, 1985), Bos taurus: bovine (Sakamoto et al., 1987), Heterodontus francisci: Horn shark (Saavedra et al., 1989), Gallus gallus: chicken (Barbu, 1990), Homo sapiens: human (Hayasaka et al., 1991), Mus musculus: mouse (You et al., 1991), Salmo sp.: trout (Stratmann and Jeserich, 1995), and Danio rerio: zebrafish (Schweitzer et al., 2003). However, lack of P0 sequence information from Xenopus laevis (frog), the classic model of amphibian species, has limited our understanding of the evolution of P0 structure and function in myelin compaction and stability. Here, we report the complete amino acid sequence of Xenopus (xP0) deduced from its corresponding cDNA. xP0 sequence is highly similar to P0 sequences of mouse and other higher vertebrates. Multiple residues, including Arg45 and His52 located at the P0 adhesive interface (Shapiro et al., 1996) and some critical sites of post-translational modification (Inouye and Kirschner, 1991), including putative phosphorylation (Eichberg, 2002), N-glycosylation (Sakamoto et al., 1987), and S-acylation (Bizzozero et al., 1994; Gao et al., 2000) sites, thought to be essential for P0 homophilic interactions, were fully conserved in xP0. This high degree of sequence conservation supports the idea that a common mechanism of myelin compaction via P0 adhesion might exist in the frog and higher vertebrates.
In the current study, using x-ray diffraction, we tested this hypothesis by investigating the structure of frog PNS myelin under different experimental conditions. We show that the width of extracellular apposition of frog PNS myelin changed as a function of pH and ionic strength in a similar way as observed for mouse myelin. This result suggests that the His52 and Arg45′ interaction probably also exists in the adhesive interface of trans-located xP0-ed. Also similar to that of the mouse, the cytoplasmic apposition of frog PNS myelin remained constant at different pH and ionic strength. An increase in width of this apposition after nerves were treated with detergents and urea suggests that hydrophobic forces contribute to the stability at the cytoplasmic apposition. By contrast, this apposition remained stable when either frog or mouse sciatic nerves were treated with hydroxylamine (HA) to remove the fatty acids bound to the single Cys residue in P0-cyt, suggesting that acylation of P0 is not required to maintain this apposition.
2. Materials and Methods
2.1. Materials
Adult female Xenopus laevis were purchased from NASCO (Fort Atkinson, WI); Trypsin (gold) was obtained from Promega (Madison, WI), MALDI matrix 2, 5-dihydroxybenzoic acid (DHB) from Bruker (Billerica, MA) and other chemicals were obtained from Sigma-Aldrich (St. Louis, MO).
2.2. Sequencing of xP0
Xenopus laevis (frog) sciatic nerve myelin was isolated using a discontinuous sucrose gradient (Norton and Poduslo, 1973). P0 protein was separated from other myelin proteins by SDS-PAGE, and was electroblotted onto an Immobilon-P nitrocellulose membrane (Millipore Corp., Billerica, MA) using Electrophoretic Transfer Cell (Bio-Rad, Hercules, CA). The membrane was stained by Coomassie blue and the portion containing the P0 band was excised, rinsed with distilled water and sent for sequencing at University of Massachusetts Medical School (Worcester, MA). The protein was digested with trypsin, and an aliquot of the digest was subjected to MALDI-TOF mass spectrometry. Selected fractions were again analyzed by mass spectrometry to determine purity and peptide size. Several fractions were sequenced by automated Edman degradation using an Applied Biosystems 494 Precise protein sequencer. Peptide sequences determined from MS analysis were searched against the NCBI non-redundant database using the BLAST program to identify homologous sequences of P0 in other species (shark, chicken, rat, mouse, human, and bovine). The homologous sequences were then used to design primers for RT-PCR and subsequent gene sequencing experiments.
Specifically, the sequence analysis of peptides obtained from trypsin-digested P0 protein and homology analysis yielded the following peptides: (1) EMYSVFHYAK and EMYSIVHFAK (weakly conserved to residue 46–55 of Xenopus P0 extracellular domain (xP0-ed)), (2) GQPSIDAGVFK (residue 56–66 of xP0-ed), (3) IEWVGSPK (residue 69–76 of xP0-ed), (4) SSYVHLQVQEK (residue 109–119 of xP0-ed), (5) QTPILYAMLDQTR (residue 185–197 of xP0-cyt), and (6) (G)LSSIDAGIF(K) (no apparent sequence homology). For initial PCR reaction the sense and anti-sense primers were designed based on EMYSVFHYAK and YAMLDQT peptides, respectively. The PCR product obtained was sequenced and aligned with P0 sequences from other species. This newly obtained sequence was used to design nested and other primers used for 5′ and 3′ RACE experiments.
To minimize the complexities arising from allelic variations from Xenopus laevis, which is a tetraploid organism, total RNAs from the sciatic nerves were isolated from a single frog with the Micro-FastTrack™ 2.0 Kit (Invitrogen, Carlsbad, CA). Three sets of cDNAs were prepared using RT-PCR technique employing random hexamer primers.
PCRs with designed sense and anti-sense primers were carried out to obtain different regions of xP0 gene. 5′and 3′ RACE (Invitrogen, Carlsbad, CA) were used to sequence the 5′ signal sequence and 3′ UTR respectively. All the fragments were cloned into TOPO TA vector (Invitrogen, Carlsbad, CA) and sequenced at Beth Israel Deaconess Medical Center DNA sequencing facility (Boston, MA). The sequencing results were analyzed using Chromas software (written by C. McCarthy, Griffith University, Australia). The results reported were from at least eight different sets of sequencing experiments using four different cDNAs constructed from independent mRNAs. The xP0 protein sequence reported in this study (Fig. 1A) was deduced from at least five different sets of experiments.
Figure 1.

xP0 sequence analysis. (A) cDNA sequence. (B) 3′ end of Xenopus gene sequence with corresponding protein sequence below. (C) Pairwise sequence alignment of mouse P0 (upper) and xP0 (lower) (by Align program; http://inn.weizmann.ac.il/bio_tools/pairwise.html). The xP0 sequence in red indicates the putative signal peptide, and the second one in red shows the predicted transmembrane domain. The number of residues including a signal sequence is 248 for mouse P0 and 246 for xP0. Sequence identity for these two molecules was measured as 64.0%. (D) Pairwise alignment of the signal sequences (black) and the first two N-terminal residues (red) for different species. (E) Pairwise alignment of the crucial two-fold adhesive interface of P0-ed for different species (residues 45–52). (F) Comparison of the residues near the acylated Cys residue of P0-cyt. (G) Comparison of transmembrane sequences (black) and neighboring residues (red) for different species and the measured distance between the lipid polar headgroups (lpg) in Å.
2.3. Sequence analysis
Sequence analysis was carried out by PROTEIN as coded in FORTRAN77 (Inouye and Kirschner, 1991), and the hydrophobicities of the amino acids were scored (Eisenberg et al., 1984). The signal sequence (Fig. 1D) was predicted on line (http://www.cbs.dtu.dk/services/SignalP/; (Nielsen et al., 1997)), and the transmembrane sequence (Fig. 1G) was predicted on line (http://www.sbc.su.se/~miklos/DAS/tmdas.cgi; (Cserzo et al., 1997)).
2.4. Treatments of nerves
pH and ionic strength
Each dissected sciatic nerve from adult female Xenopus laevis was tied-off at both ends with fine silk suture, placed in a 20 ml scintillation vial containing a chosen buffer (see below), and allowed to equilibrate at room temperature while gently agitated on a rocker. Buffers at low ionic strength were prepared by diluting 10 mM stock solutions, whereas buffers at high ionic strength were prepared by adding the necessary amount of NaCl to a small volume of the selected stock solution. The buffers for different pH treatments included glycine at pH 2.5, acetic acid at pH 4.0 and 5.6, phosphate buffer at pH 7.3, Tris-HCl at pH 8.5, and glycine at pH 10.0. The ionic strengths of the media at these pHs were 0.012, 0.029, 0.038, 0.115, 0.153, and 0.200.
Nerves incubated in physiological saline were equilibrated on the rocker for 24 hours. Samples incubated in dilute saline were equilibrated for 24 or 48 hours. After incubation, each nerve sample, along with a small amount of buffer, was inserted into a 0.7 mm quartz capillary tube and sealed with wax at both ends.
Detergents and urea
Each sciatic nerve dissected from adult female frog was divided into two segments and tied off with suture. Each nerve was lightly stretched over a frame (a notched pipette tip) and placed into 20 ml of the appropriate incubation medium that had been diluted from stock solutions. During incubation, nerves were gently rocked for 24 or 48 hours before being transferred into 0.7 mm thin-wall quartz capillary tubes, which were then sealed with wax. The incubation media included 1.4 mM DTMAB, 1.7 and 5 mM β-OG, 4 mM CHAPSO, and urea (at 0.5, 6, and 8 M) in buffered saline (115 mM NaCl and 5 mM Tris, pH 7.3).
Hydroxylamine (HA) or CHAPSO
Freshly-dissected sciatic nerves were tied off at each end with fine suture, and then incubated for 1–24 h with gentle agitation in 25 ml deacylation solution. For frog, the solution (at room temperature) was 100 mM HA, 15 mM NaCl, and 5 mM Tris, pH 7.3; whereas for mouse, the solution (at 37 °C) was 100 mM HA, 54 mM NaCl, and 5 mM Tris, pH 7.4. Some mouse nerves were also treated with 4 mM CHAPSO, 154 mM NaCl, and 5 mM Tris, pH 7.4.
2.5. X-ray diffraction
X-ray diffraction experiments were undertaken as recently described (Avila et al., 2005). The exposure times ranged from 15 min to 1 h. X-ray diffraction patterns were recorded using a linear, position-sensitive detector (Molecular Metrology, Inc., Northampton, MA), and analyzed using PeakFit (Jandel Scientific, San Rafael, CA). Background intensity, approximated as a polynomial curve, was subtracted from the total intensity, and the integral areas of the Bragg peaks were obtained. The phases of the observed structure amplitudes were determined assuming either an invariant pair of membrane (Finean and Burge, 1963; Moody, 1963; Blaurock, 1971; McIntosh and Worthington, 1974) or an invariant asymmetric structure (Caspar and Kirschner, 1971; Kirschner and Ganser, 1982; Inouye et al., 1989). For the former, the observed structure amplitudes map out a single continuous Fourier transform, whereas for the latter, where intermembrane spaces can vary at both appositions, the best packing distance (umin) was searched in order to give the best agreement, (i.e., the least R-factor) between the observed and calculated structure amplitudes.
2.6. Protein in-gel proteolysis and MALDI-TOF MS peptide mapping
Native and deacylated frog or mouse sciatic myelin samples were boiled in sample buffer (2% SDS, 10% glycerol, 0.1 mM DTT, 0.01% bromophenol blue, 63 mM Tris-HCl) before being loaded on 4–20% Tris-HCl Novex precast polyacrylamide minigels (Invitrogen, Carlsbad, CA). All gels were run at a constant voltage of 125 V for ~90 min. Gels were then stained by standard Coomassie blue, and the bands corresponding to P0 were excised, pooled, cut into pieces of ~1 mm3, and washed with 50 mM NH4HCO3 followed by 100% acetonitrile (CH3CN). After removal of the supernatant, gel segments were dried in a Savant Instruments SC 110 SpeedVac™ concentrator (Farmingdale, NY) for 5 min, and incubated at 56 °C for 60 min in 25 μl of 10 mM dithiothreitol in 50 mM NH4HCO3. After cooling to room temperature and removal of the supernatant, the gel pieces were incubated at 45 °C for 45 min in the dark in 25 μl of 50 mM fresh iodoacetamide in 50 mM NH4HCO3, washed in 50 μl of 50 mM NH4HCO3 followed by 100% CH3CN, and dried using a SpeedVac™ to remove SDS, reducing and alkylation reagents. The dried gel pieces were treated with trypsin (20 ng/μl). For each digestion, the volume of enzyme solution was adjusted to cover gel pieces. All digests were covered with additional buffer (50 mM NH4HCO3) and incubated at 37 °C overnight.
Peptides were extracted from the gel pieces by 3 × 30-min sonications in 100 μl-aliquots of 50% acetonitrile (in water). All extracts, including that of the incubation buffer, were combined and dried in a SpeedVac™.
All mass spectra were acquired on a Bruker Reflex IV MALDI-TOF MS equipped with a Laser Science nitrogen laser (Franklin, MA) having a 3-ns pulse width at 337 nm.
2.7. Molecular modeling
Swiss Modeler (Guex et al., 1999) was used to build a model of the three-dimensional atomic structure of xP0 from the crystallographic structure of rat P0-ed (PDB ID 1NEU) as a template. The model was displayed and manipulated using Molscript (Kraulis, 1991), XtalView (McRee, 1999), Rasmol (by Roger Sayle), PyMOL (DeLano, 2002), Swiss-PDB Viewer (Guex et al., 1999), and QUANTA (MSI, Inc., Burlington, MA). The secondary structure, which underlies the visual presentation of the model with MOLSCRIPT (Kraulis, 1991), was determined from the atomic coordinates by DSSP (Kabsch and Sander, 1983) and STRIDE (Frishman and Argos, 1995); http://www.emblheidelberg.de/stride_info.html). The stereochemistry of the structure was evaluated using PROCHECK (Laskowski et al., 1993).
3. Results
3.1. Xenopus P0 sequence resembled those of P0’s from higher vertebrates
Using RT-PCR and mass spectrometry, we determined the amino acid sequence of full-length xP0 from its cDNA (Fig. 1A) and verified the sequence by MALDI-TOF MS peptide mapping of the purified protein. The observed variation in the third base of codons in the xP0 gene, most likely due to the four alleles inherent in Xenopus laevis, could result in amino acid substitutions, the most significant of which would be Gly213Cys and Ser215Phe in the cytoplasmic domain (Fig. 1B). Such amino acid residues at these positions have not been identified in other species, including cases of human pathology involving P0 (Kirschner et al., 2004).
Overall, the xP0 sequence (including the signal sequence) showed a high degree of homology (63% identity) with mouse P0 (Fig. 1C) and with P0 of other higher vertebrates (Kirschner et al., 2004). Arg45 and His52 are conserved across a wide phylogenetic range, and were also present in xP0 (Fig. 1E). In addition, Trp28 and Trp77 (both of which might directly interact with membranes; (Shapiro et al., 1996)), Asn92 (which is N-glycosylated; (Sakamoto et al., 1987)), and Cys152 (which is acylated; (Gao et al., 2000; Xie et al., 2007)) were all present in xP0 (Fig. 1F).
The net differences in the sequence were one additional acidic residue in mouse P0, and two additional histidines in Xenopus. The calculated isoelectric point for Xenopus was 0.5 higher than for mouse (see also Supplementary Fig. 3).
3.2. Changes in pH and ionic strength altered frog PNS myelin structure
X-ray diffraction of frog sciatic nerve suggested that myelin structure changed as a function of pH and ionic strength (Fig. 2; Table 1 and 2). At acidic pH (= 4) and independent of ionic strength, frog myelin compacted by ~10 Å from native period to a period of 162–164 Å. Diffraction patterns showed sharp and intense even orders and weak odd orders, indicating increased similarity in widths for the cytoplasmic and extracellular appositions. At higher pH (5.6, 7.3, and 8.5) and physiological ionic strength (115 mM NaCl), myelin swelled by 6–20 Å from its native period. Substantial further swelling occurred (~74–83 Å) at these higher pHs as the ionic strength decreased to 12 mM NaCl. The strong odd order reflections from these diffraction patterns suggested that the membrane pairs were asymmetric—i.e., the space between membrane bilayers was considerably greater at one of the appositions than the other. At extreme pH of 2.5, myelin swelled to periods >300 Å. At pH of 4.0, 5.6, 7.3, and 8.5, the structure factors measured from the diffraction data from nerves at different ionic strength mapped out a single continuous Fourier transform (Fig. 3), indicating that the difference in periods comes from the variation in the fluid layer at the extracellular space (Fig. 2B; Table 2). The electron density profiles showed that the measured cytoplasmic separations (cyt) ranged in width from 28–38 Å, while the extracellular separations (ext) ranged from 37–146 Å. The distance between the lipid polar head group layers (lpg) varied the least, ranging in thickness from 45–51 Å.
Figure 2.

(A) X-ray diffraction patterns of frog sciatic nerve myelin before background subtraction. The intensity, plotted as a function of reciprocal coordinate (1/Å), was normalized so that the area under the curve was unity. Native myelin period of 174 Å at pH 7.3 and 115 mM NaCl, compact period of 164 Å at pH 4.0 and 115 mM NaCl, and swollen period of 263 Å at pH 8.5 and 12 mM NaCl are shown. (B) Absolute electron density profiles (e/Å3) of myelin membrane profiles as a function of radial distance for different pH and NaCl concentrations. The curves include native structure at pH 7.3 and 115 mM NaCl (solid line), compact structure at pH 4.0 and 115 mM NaCl (dashed line), and swollen structure at pH 8.5 and 12 mM NaCl (dash-dot-dash line). The corresponding myelin periods are 174 Å, 164 Å, and 263 Å, respectively.
Table 1.
Period (Å) of frog PNS myelin at different pH and ionic strength
| Myelin perioda (Å)
|
|||||
|---|---|---|---|---|---|
| pH
|
|||||
| NaCl (mM) | 2.5 | 4.0 | 5.6 | 7.3 | 8.5 |
| 12 | 161 | 164 | 254 | 257 | 265 |
| 29 | 326 | 162 | 216 | 223 | 260 |
| 38 | 325 | 163 | 205 | 219 | 245 |
| 115 | 345 | 163 | 180 | 174 | 179/196b |
| 153 | 344 | 163 | 177 | 175 | 192 |
| 200 | 352 | 163 | 178 | 177 | 180 |
The period is an average of duplicate experiments.
Two separate phases coexist under these conditions.
Table 2.
Structural parameters for frog PNS myelin at different pH and ionic strength
| Dimensiona (Å)
|
||||||
|---|---|---|---|---|---|---|
| pH | NaCl (mM) | d | Cyt | Lpg | Ext | |
| 2.5 | 12 | 161 | 30 | 47 | 37 | |
| 12 | 164 | 30 | 47 | 40 | ||
| 4.0 | 29 | 162 | 28 | 46 | 42 | |
| 38 | 162 | 28 | 46 | 42 | ||
| 115 | 164 | 32 | 46 | 40 | ||
| 12 | 270 | 28 | 48 | 146 | ||
| 5.6 | 29 | 231 | 30 | 47 | 107 | |
| 115 | 178 | 30 | 45 | 58 | ||
| 29 | 227 | 32 | 47 | 101 | ||
| 38 | 211 | 34 | 45 | 87 | ||
| 7.3 | 115 | 174 | 34 | 47 | 46 | |
| 153 | 177 | 34 | 49 | 45 | ||
| 200 | 180 | 36 | 49 | 46 | ||
| 12 | 263 | 34 | 46 | 137 | ||
| 38 | 240 | 34 | 48 | 110 | ||
| 8.5 | 115b | { | 194 | 34 | 48 | 64 |
| 179 | 34 | 51 | 43 | |||
| 153 | 193 | 38 | 48 | 59 | ||
| 200 | 185 | 38 | 50 | 47 | ||
Dimensions include: d, myelin periods; Cyt, width of cytoplasmic space; Lpg, width of bilayer; Ext, width of extracellular space. The origin for the membrane pair was assigned to the center of the cytoplasmic space.
There were two lamellar phases at pH 8.5 and 115 mM NaCl.
Figure 3.

Structure factors as a function of reciprocal coordinates (1/Å) on an absolute scale for frog sciatic nerve myelin at pH 4.0 (A), 5.6 (B), 7.3 (C), and 8.5 (D). Different symbols refer to different NaCl concentrations: 12 mM (diamond), 29 mM (triangle), 38 mM (square), 115 mM (circle), 153 mM (filled triangle), and 200 mM (filled square). The Fourier transform for a pair of membranes was calculated as a function of reciprocal coordinate at every 0.001 Å−1 from the observed structure factors. The continuous curve was an average of the Fourier transforms calculated at constant pH but different ionic strengths. An absolute scale (Inouye et al., 1999) for the nerves was derived by using the scale factor = 2.0, exclusion length = 136 Å, average membrane electron density within the exclusion length = 0.343 e/Å3 (Worthington and Blaurock, 1969), and extracellular fluid electron density = 0.335 e/Å3.
The electron density profiles on an absolute scale for the native, compacted, and expanded structures were compared (Fig. 2B). The densities at the center of the lipid bilayer were identical in these three profiles. The major difference between the native and compacted structures occurred at the extracellular apposition where the density level of the compact structure was higher than that of the native. The large difference between the native and expanded structures occurred at the extracellular space, but the electron density levels at the cytoplasmic and extracellular lipid head groups were also altered. While the electron density level of the lipid head group layer at the cytoplasmic side in the native and compacted structures was higher than that at the extracellular side, this relationship was reversed in the expanded structure. These differences can be accounted for by different proportions of protein and lipid molecules at the appositions.
3.3. Complete deacylation of P0 had little effect on myelin structure
In the in vitro model where P0 is transfected into Chinese hamster ovary cells, acylation of the single Cys residue of P0-cyt (Bizzozero et al., 1994) is apparently essential for P0 adhesion between the extracellular surfaces of the cells (Gao et al., 2000). To test whether P0 acylation may underlie the stable cytoplasmic apposition in compact myelin (Inouye et al., 1999), both frog and mouse sciatic nerves were treated with HA to cleave off the Cys-attached fatty acids before being subjected to x-ray diffraction. Complete deacylation of P0 by HA was confirmed by MALDI-TOF-MS (data not shown). The nerve incubated in HA for 8 h gave sharp Bragg reflections, and the calculated electron density profile was indistinguishable from that of the nerve incubated for 8 h in Ringer’s solution (Figs. 4, 5; Tables 3). These results strongly suggest that deacylation of P0 had no or little effect on myelin structure. A similar result was found for mouse sciatic nerve deacylated with HA (Table 3).
Figure 4.

Effect of HA on structure of frog PNS myelin. Sciatic nerves were incubated for 8 h at room temperature in Ringer’s solution (control) and in 100 mM HA solution. (A) Observed intensity distribution as a function of reciprocal coordinate (1/Å) after background subtraction for the control (thick line) and HA-treated nerve (thin line). The intensity curves were normalized so that the area under each curve was unity. All reflections are indicated by Bragg indices. (B) Structure factor as a function of reciprocal coordinate for the control nerve. The respective structure amplitudes (control: open circle; HA, filled square) are plotted. (C) Electron density distributions of the treated nerves. The myelin periods were 173 Å for both the control and HA treatment, and the profiles are indistinguishable from one another.
Figure 5.

Effect of CHAPSO and deacylation on myelin structure of mouse sciatic nerve. (A) Observed intensity distribution as a function of reciprocal coordinate (1/Å) after background subtraction for treatment of nerve with100 mM hydroxylamine (HA; thin line) and 4 mM CHAPSO (thick line). The intensity curves were normalized as above, and Bragg orders are indicated. (B) Structure factor as a function of reciprocal coordinate for nerve treated with 4 mM CHAPSO (thick line) or with HA (thin line). The respective structure amplitudes (CHAPSO, filled square; HA, open circle) are plotted. (C) Electron density distributions for myelin of the treated nerves. The myelin periods were 178 Å and 293 Å for HA and CHAPSO, respectively. Note the widened separation at both inter-membrane appositions of membranes after CHAPSO.
Table 3.
Structural parameters for frog and mouse PNS myelin after treatment with detergents, urea, or HA
| Dimensiona (Å)
|
||||||
|---|---|---|---|---|---|---|
| Sampleb | d (h)c | umind | Cyt | Lpg | Ext | Re |
| Frog sciatic nerve | ||||||
| Native | 174 (5) | 40 | 34 | 47 | 46 | - |
| 8 mM CHAPSO | 189 (6) | 47 | 52 | 44 | 49 | 0.21 |
| 1.4 mM DTMAB | 172 (5) | 41 | 38 | 46 | 42 | 0.10 |
| 5 mM β-OG | 173 (5) | 39 | 34 | 47 | 45 | 0.04 |
| 0.5 M urea | 177 (5) | 40 | 38 | 46 | 47 | 0.13 |
| 6 M urea | 245 (7) | 46 | 48 | 50 | 97 | 0.26 |
| 8 M urea | 260 (8) | 47 | 48 | 51 | 110 | 0.36 |
| 8 h Ringer’s | 173 (5) | 39 | 33 | 45 | 50 | 0.07 |
| 8 h 100 mM HA | 173 (5) | 39 | 33 | 45 | 50 | 0.08 |
| Mouse sciatic nerve | ||||||
| Native | 178(5) | 40 | 33 | 48 | 49 | - |
| 4 mM CHAPSO | 293 (8) | 54 | 68 | 47 | 131 | 0.23 |
| 100 mM HA | 178 (5) | 41 | 34 | 48 | 48 | 0.11 |
Dimensions as described in Table 2.
Native frog sciatic data are from Table 2 (see above). Native mouse sciatic data were reported in (Inouye and Kirschner, 1988a).
Number of orders used in calculating the membrane profile is in parentheses.
The packing distance from center of one bilayer across cytoplasmic apposition to next bilayer, that minimizes the R-factor between observed and calculated structure factors.
R-factor or residual in comparing observed and calculated structure factors. The phase combinations of the treated nerve samples were determined by assuming an invariant asymmetric structure of the native myelin structure of frog sciatic nerve. For mouse sciatic nerve treated with HA, the phase combination was the same as that observed for native nerve.
3.4. Detergents and urea altered PNS myelin structure
To probe the possible hydrophobic nature of the cytoplasmic apposition, we treated frog sciatic nerves with low concentrations of various detergents including CHAPSO (non-denaturing, zwitterionic), β-OG (non-ionic), and DTMAB (cationic). In addition, urea was chosen to test whether a denaturant would affect myelin compaction (Table 3, Figs. 6 and 7). β-OG at 5 mM resulted in a native-like myelin period of 177 Å (Fig. 6A), whereas 1.4 mM DTMAB (Fig. 6A) and 0.5 M urea (Fig. 7) gave periods of 172 Å and 177 Å, respectively. The corresponding electron density profiles of myelin after the latter two treatments showed a 4 Å-increase in width of the cytoplasmic separation. Nerves treated with 8 mM CHAPSO (Fig. 6B) or with urea at 6 M and 8 M (Fig. 7) showed swollen myelin periods of 189 Å, 245 Å, and 260 Å, respectively. The decreased intensities of the odd order reflections indicated that the expansion arose from an increase in membrane separation at both cytoplasmic and extracellular appositions.
Figure 6.

Effect of detergents on myelin structure of frog peripheral nerve. (A) Observed intensity distributions as a function of reciprocal coordinate (1/Å) after background subtraction for the native (untreated) nerve (thin line) and the one treated with 8 mM CHAPSO (thick line). The intensity curves were normalized as above, and Bragg orders are indicated. (B) Observed intensity distributions of the nerves treated with 5 mM β-OG (thin line) or 1.4 mM DTMAB (thick line). (C) Structure factors as a function of reciprocal coordinate for native frog sciatic nerve (thin line) and after treatment with 8 mM CHAPSO (thick line), with measured structure amplitudes (open circles and filled squares) plotted. (D) Structure factor as a function of reciprocal coordinate for the nerves treated with 5 mM β-OG (thin line) or 1.4 mM DTMAB (thick line). (E) Electron density distribution on a relative scale for native nerve (thin line) and after treatment with CHAPSO (thick line). (F) Electron density distribution of the nerve treated with β-OG (thin line) and with DTMAB (thick line).
Figure 7.
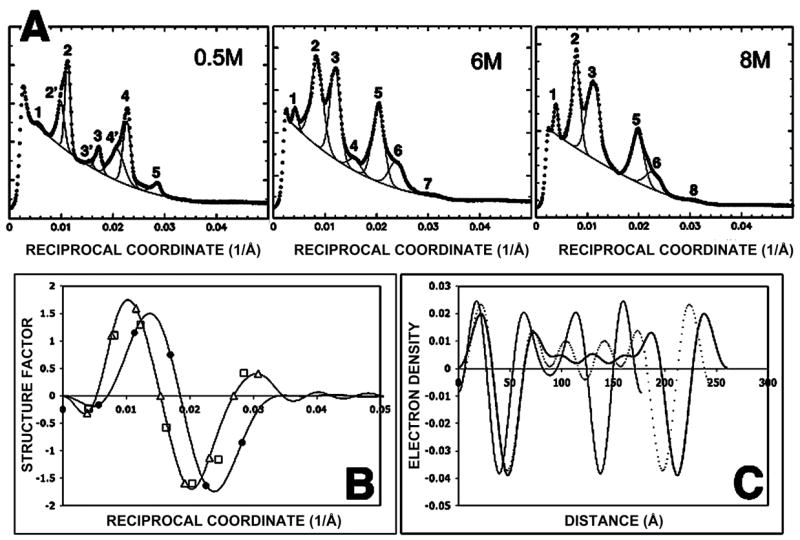
Effect of urea on myelin structure of frog peripheral nerve. (A) Observed intensity (thick lines) and background (thin line) as a function of reciprocal coordinate (1/Å) for frog sciatic nerves treated with 0.5 M, 6 M, and 8 M urea solutions. Lorentz and polarization corrections were not applied. The overlapping Bragg peaks were separated and are indicated here by overlapping peaks. The respective reflections of the two phases in 0.5 M urea are indicated by indices 1, 2, 3, 4, and 5 (177 Å period) and by indices 2′, 3′, and 4′ (195 Å period). The reflections from myelin treated with 6 M (245 Å) and 8 M urea (260 Å) are shown indexed here in the same manner. (B) Structure factor as a function of reciprocal coordinate for the 177 Å phase in 0.5 M urea and the 260 Å one in 8 M urea solution (solid lines). The measured structure amplitudes for 0.5 M urea (filled circle), 6 M urea (open square) and 8 M urea (open triangle) are indicated. (C) Electron density distribution as a function of distance from the cytoplasmic center (Å) for 0.5 M urea (thin line), 6 M urea (dotted line), and 8M urea (thick line).
For comparison with the Xenopus nerves, we also treated mouse sciatic nerves with CHAPSO. Overnight treatment with 4 mM CHAPSO resulted in a swollen myelin period of 293 Å (Fig. 5; Table 3 italics). The electron density profile of sciatic nerve showed extensive swelling at both the cytoplasmic and extracellular appositions (Fig. 5), which suggests that CHAPSO likely weakened the hydrophobic interactions involved in the membrane compaction.
4. Discussion
To investigate the role of P0 in and the contribution of electrostatic and hydrophobic interactions to the stabilization of membrane arrays in PNS internodal myelin, we undertook a comparative study of inter-membrane interactions in peripheral nerves from frog and mouse using x-ray diffraction. As part of this study, we also deduced the full sequence of Xenopus P0 (xP0) from its cDNA. The sequence was verified by parallel mass spectrometry analyses following tryptic digestion of the xP0 protein.
4.1. Phylogenetic comparison of PNS myelin structure
PNS myelin periods vary among species, e.g. ~180 Å for mammals, ~177 Å for rodents, ~171 Å for frog, and ~161 Å for fish (Schmitt et al., 1935; Fernandez-Moran and Finean, 1957; Hoglund and Ringertz, 1961; Finean and Burge, 1963; Moody, 1963; Blaurock, 1967; Akers and Parsons, 1970; Caspar and Kirschner, 1971; Chandross et al., 1978; Blaurock et al., 1986; Kirschner et al., 1989; Mateu et al., 1990). These differences derive mostly from differences in the widths of the extracellular and cytoplasmic appositions between membrane bilayers, and correlate generally with the sizes of the respective domains of P0 or P0-like proteins (Kirschner et al., 1989; Inouye and Kirschner, 1990; Inouye and Kirschner, 1991; Avila et al., 2007). In teleosts, the width of the cytoplasmic apposition is 10 Å smaller than that of mouse and frog (Kirschner et al., 1989; Avila et al., 2007), and this is consistent with a P0-cyt that is about half the size of the corresponding domains in the higher vertebrates (Brösamle and Halpern, 2002).
The 10 Å-shorter period of frog PNS myelin compared to that of higher vertebrates cannot arise from a smaller xP0, as its number of residues was similar to that of the higher vertebrates. Rather, the smaller period might come in part from the conformation of this molecule’s transmembrane domain (xP0-tm) (Fig. 1G). While the distribution of hydrophobic residues in P0-tm from most species (based on the hydrophobicity scale; (Eisenberg et al., 1984)) showed a single, strong peak indicating α-helical amphiphilicity, that of xP0-tm gave an additional strong peak indicating β-amphiphilicity (data not shown). A sequence motif that frequently occurs in the transmembrane domains of integral proteins and often in association with β-branched residues at neighboring positions (Senes et al., 2000)—namely, GXXXG—was present only once in xP0-tm but three times in P0-tms of most other species. Frog was also unique among all the species in that xP0 contained at the C-terminal end of the transmembrane sequence a Thr residue that could contribute to inter-helical H-bonding (Smith et al., 2002). Such sequence variability may underlie different conformations of the transmembrane domain in P0, as a tilt or kink would shorten the length of the transmembrane domain. A previous, alternative explanation is that the hydrocarbon chain length of the membrane lipids may be shorter in frog than in other vertebrates (Caspar and Kirschner, 1971; Bizzozero et al., 1994). Our recent results indicate that the fatty acyl group on Cys152 in Xenopus P0 is C18 (Xie et al., 2007), whereas it has been reported to be C16 in other vertebrates.
4.2. Balance of non-specific forces largely accounts for membrane interactions in frog myelin
Using DLVO theory-based procedures that we previously developed for analyzing inter-membrane interactions from x-ray diffraction of mouse nerves (Inouye and Kirschner, 1988a; Inouye and Kirschner, 1988b), we calculated the charge densities of P0 from both frog and mouse with or without lipids on the extracellular surface of the myelin membrane. We assumed that the lipid composition for frog and mouse were the same as that for rat (Table 2 in Inouye and Kirschner, 1988b). For mouse, the charge density gradually decreases as pH increases; and the calculated pI value is 5.6 (protein only) or 4.3 (with lipids). For frog, these values were about one-half pH unit higher than for mouse (Supplementary Fig. 1). We also calculated the pair-potential energy curves for frog PNS myelin at different pHs (Supplementary Fig. 2), and the equilibrium myelin period as a function of pH (Supplementary Fig. 3). As shown experimentally and in agreement with the calculations, myelin period depended on pH: swollen arrays at low acidic pH and at pH >5, and compacted arrays at pH ~4 (near the pI). Whereas the overall swelling and compaction of frog myelin was consistent with the calculations, the observed 174 Å native-like period was smaller than predicted. A similar discrepancy is also observed for mouse PNS myelin (Inouye and Kirschner, 1988a; Inouye and Kirschner, 1988b). For both species, deprotonation of His52 in P0 may result in a protein conformational change, and accounts for these findings.
4.3. Atomic model of xP0 provides insight into mechanism of myelin compaction
Molecular contacts between protomers in the crystal structure of rat P0-ed suggest which interactions stabilize myelin compaction: on each membrane surface P0-ed forms homo tetramers, and the tetramers from the apposing membranes adhere via a dimeric (two-fold) interface containing His52 (Shapiro et al., 1996). Using rat P0-ed as a template (PDB ID: 1NEU), we built an atomic model of xP0-ed with Swiss Modeler (Fig. 8 left). Visual inspection of the model showed that the structure was stereochemically reasonable, as the backbone of xP0-ed closely traced that of rat P0-ed (Fig. 8 right).
Figure 8.

Molecular model of the predicted adhesive interface of xP0-ed. Molscript representation highlighting the β-strands (left) and residues Arg45 and His 52 (right), which are likely involved in the extracellular apposition (see also Fig. 1E). The C-terminal end of xP0-ed in this model is Leu114. As the N-terminal end of the transmembrane domain is Ala124, nine residues (115QVQEKGPAR123) are likely exposed to the aqueous medium in the extracellular space.
In xP0, three tryptophan residues (Trp24, Trp28, and Trp77) are conserved and, according to the model, are at the apical end of the molecule and, therefore, exposed at the surface. Residues 103–106 are disordered in the crystal structure of rat P0-ed (Shapiro et al., 1996), and were modeled in xP0 to form a tight reverse turn that may be created by two consecutive Pro residues. In xP0, two of five His residues are conserved (His52 and His 85), and the other three are non-conservative substitutions compared to the rat sequence (frog#rat): Arg38His, Gly43His, and Phe113His. In the current model, the two latter His residues are located near the C-terminus of xP0-ed, close to the membrane surface, and may be involved in the interaction between the protein and the apposed membrane. As the conserved His52 and His85 are at the two-fold adhesive interface, they should play a crucial role in the proper homophilic interaction of P0-ed.
The crystal structure of rat P0-ed shows that the apposed molecules interact at the dimeric, adhesive interface via a pair of anti-parallel β-chains (residues 45–52) (Fig. 8, lower right; (Shapiro et al., 1996)). Moreover, the interaction between Arg45 and His52′ appears to be crucial in adhesion, as protonation of His52 likely weakens the protein interaction, thereby accounting for the abrupt myelin swelling at pH <7, even at physiological ionic strength (Inouye and Kirschner, 1988a; Inouye and Kirschner, 1988b). Conservation of the sequence forming the anti-parallel β–chains in P0 proteins from various species (including mouse, rat, and frog; Fig. 1E) further suggests the importance of this region in membrane compaction. The stability of P0-P0 interaction in compact myelin, however, may differ between mouse and frog. While the native period of mouse PNS myelin does not change at pH >7 (Inouye and Kirschner, 1988a), that of the frog myelin increases by ~20 Å at pH ~8.5 (Table 2), suggesting a weaker xP0 homophilic interaction. In xP0, the adhesive interface contains Met47 and Tyr48 in place of the hydrophobic residues Ala and Ile in rodents (Figs. 1E, 8 right), which could contribute to weakened hydrophobic interactions between the two β-chains and lowered stability of this interface.
4.4. Other players in PNS myelin stability?
A possible involvement of the Asn-linked glycans in myelin compaction at the extracellular apposition is suggested by in vitro, cell aggregation assays (Filbin and Tennekoon, 1991). As glycans contain sialic acid, the absence of glycans from P0 would shift the pI of the extracellular membrane surface to more alkaline pH. Because the sugars are located at the base of P0-ed, proximal to the membrane surface, they could modulate the orientation of P0-ed, thereby influencing the homophilic interaction of this domain (Wells et al., 1993).
The strong interaction between galactosylceramide and cerebroside sulfate is detected by FTIR even in the absence of Ca2+ ions, suggesting that the interaction between these lipids via trans carbohydrate-carbohydrate association may be involved in myelin stability (Boggs et al., 2000). As this type of interaction does not account for pH-dependent myelin compaction at physiological ionic strength, it is not likely to be the dominant force in stabilizing the native myelin structure; however, glycolipid interactions may play a role in myelin compaction in P0-null mice, where multilamellar membranes are present despite the absence of P0 (Martini et al., 1995; Previtali et al., 2000; Avila et al., 2005).
4.5. What accounts for the stable myelin cytoplasmic apposition?
The widths of the cytoplasmic apposition for both frog and mouse peripheral myelin did not vary at different pH and ionic strength, as indicated by our finding that the observed structure amplitudes of different myelin periods map onto the same Fourier transform (Fig. 3). One hypothesis to explain the stable apposition is that the fatty acid attached to the conserved Cys153 in P0-cyt (Fig. 1F; (Bizzozero et al., 1994)) may anchor one membrane surface to another (Inouye et al., 1999). This role of the fatty acyl group is supported by observations that teleost and elasmobranch myelin, which lacks the Cys residue in P0-cyt (Fig. 1F), do undergo cytoplasmic swelling (Inouye et al., 1980; Blaurock et al., 1986). However, a recent study of zebrafish PNS myelin, whose P0-cyt also lacks the Cys residue, failed to show such swelling (Avila et al., 2007). In the current study, the role of P0-attached fatty acyl group in myelin structure was tested by measuring x-ray diffraction patterns from both frog and mouse sciatic nerves treated with deacylation agent HA. All deacylated nerves showed diffraction patterns similar to those of the native nerves, indicating that the fatty acids do not play a major role in PNS membrane compaction. This result is apparently different from what was reported for proteolipid protein, whose Cys-attached fatty acids are proposed to be indispensable for CNS myelin compaction (Bizzozero et al., 2001). Solution studies of human P0-cyt by circular dichroism and fluorescence spectroscopy indicate that the peptide undergoes a conformational change that depends on the lipid:protein molar ratio (Luo et al., 2007). At ratios lower than the physiological level (~50:1 in native myelin; (Inouye and Kirschner, 1988b)), the peptide shows a β-conformation, whereas at higher ratios it adopts increasing amounts of α structure. By contrast, myelin basic protein shows a β-conformation at any lipid:protein ratio. Homology modeling indicates in human P0-cyt a short hydrophobic sequence (VLYAML) that is folded in β-conformation. This hydrophobic sequence is fully conserved in mouse P0 and very similar to the corresponding xP0 sequence (LLYAML). Therefore, H-bonding between the β-chains from apposing P0-cyt molecules may be involved in the cytoplasmic apposition (Luo et al., 2007). This finding is consistent with the current x-ray results, which showed that detergents as well as denaturing agents (e.g., urea) weakened the cytoplasmic apposition, presumably by disrupting the lipid/protein interaction or destroying the β-conformation of P0-cyt. Among the three detergents—i.e., zwitterionic CHAPSO, cationic DTMAB, and non-ionic β-OG—CHAPSO resulted in the largest swelling at the cytoplasmic apposition (Fig. 6). This may be consistent with CHAPSO’s tendency to form the rim region in discoidal lipid aggregates constituted of long-chain phospholipids and detergent (or bicelles) (Glover et al., 2001; Faham et al., 2005).
4.6. Possible communication between the cytoplasmic and extracellular domains of P0
The P0-induced in vitro aggregation of Chinese hamster cells is inhibited by transfecting the cells with mutant P0 carrying a point mutation at its acylation site Cys153 (Gao et al., 2000), and by mutations inside the PKC recognition motif (RSTK) within P0-cyt (Xu et al., 2001). These findings suggest that P0-ed, which is the site of the aggregation, must somehow be influenced by events involving P0-cyt. For example, a change in conformation at P0-cyt may rotate or translate the transmembrane domain that in turn alters the conformation of P0-ed. Disruption of the cis-interaction of P0-cyt also could affect the tetrameric assembly of P0-ed. The possibility of communication between P0-cyt and P0-ed is consistent with the electron density profiles of frog myelin as a function of pH and ionic strength (Fig. 2B). When myelin is swollen, the electron density level at the cytoplasmic lipid headgroups decreases, while the extracellular level increases. This shift in electron density may indicate a shift of P0 due to movement of the protein or a change in its conformation.
Supplementary Material
Supplementary Figure 1. (A) Charge density (number of charges per Å2) as a function of pH at ionic strength μ = 0.038 for xP0-ed (solid line). A similar plot (Inouye and Kirschner, 1988b) for mouse P0 is shown (dashed) for comparison. The unit area depends on the ionic strength as determined from the mouse data (Inouye and Kirschner, 1988b) as S = 405 μ−1.269 Å2. A temperature of 20 °C and dielectric constant of water 80 were chosen. The charge density equation was numerically solved with 1 mV step of surface potential in the range of −200 mV to 100 mV. (B) Charge density (number of charges per Å2) as a function of pH at ionic strength of 0.038 for the extracellular surfaces of frog (solid line) and mouse myelin (dashed). For purposes of this calculation, the lipid compositions for frog and mouse were assumed to be the same as the one for rat (Inouye and Kirschner, 1988b). The temperature, dielectric constant, and unit surface area that contain one P0 molecule were the same as in (A), and the membrane surface area was assumed to be ionic strength-dependent as it is in (A).
Supplementary Figure 2. Total potential energy curves at different pHs (2.5, 4.0, 5.6, 7.3, 8.5, 10.0) as a function of myelin period at constant ionic strength of 0.038 for frog myelin. It was assumed that the extracellular separation varied. The unit area (Å2) is ionic strength-dependent according to S = 405 μ−1.269. The other constants included the exclusion length of myelin (138 Å), temperature (20 °C), dielectric constant (80), Hamaker coefficient (5 × 10⁻¹⁴ erg), and hydration repulsion force with decay coefficient and height of hydration force (1.93 and 1.×1011, respectively). The exclusion length was derived from the balance between the van der Waals attraction and the hydration repulsion (Inouye and Kirschner, 1988a). The distance giving the energy minimum was identical to the myelin period measured by x-ray diffraction. Note that the energy minima became broader and shallower as the myelin period increased, suggesting that the membrane lattice in myelin is paracrystalline.
Supplementary Figure 3. Comparison between the observed (circles) and calculated myelin period as a function of pH. Myelin periods were calculated as a function of pH at constant ionic strength of 0.029 (A) and 0.038 (B) for frog (solid line) and mouse myelin (dashed). The unit area depends on the ionic strength as determined from the mouse study ((Inouye and Kirschner, 1988b); see Supplementary Fig. 2). The constants were the same as above. Note that there are three different phases: swollen phases at low and higher pH, and a compact phase at pH~4. This pH titration curve shifts to more alkaline pH for frog, due to a higher pI for its extracellular sequence (see text and Fig. 1C).
Acknowledgments
We thank Jing Yu and Annie George for preliminary work leading to determination of the sequence of xP0. This work was supported by Institutional Research Support Funds from Boston College (DAK) and by NIH-NCRR P41 RR10888 (CEC) and S10 RR15942 (CEC).
Abbreviations
- PNS
peripheral nervous system
- CNS
central nervous system
- xP0
Xenopus laevis myelin P0
- P0-cyt
P0 cytoplasmic domain
- P0-ed
P0 extracellular domain
- P0-tm
P0 transmembrane domain
- DTT
dithiothreitol
- HA
hydroxylamine
- DTE
dithioerythritol
- PLP
proteolipid protein
- CHAPSO
3-[(3-cholamidop ropyl) dimethylammonio]-2-hydroxy-1-propane sulfonate
- β-OG
n-octylbetaglucoside
- DTMAB
dodecyltrimethylammonium bromide
- PC
phosphatidylcholine
- PS
phosphatidylserine
- CD
circular dichroism
- DLVO
Derjaguin, Landau, Verwey, Overbeek
- MALDI-TOF
matrix-assisted laser desorption/ionization time-of-flight
- MS
mass spectrometry
- NCBI
The National Center for Biotechnology Information
- RACE
rapid amplification of cDNA ends
- RT-PCR
reverse transcription polymerase chain reaction
- SDS-PAGE
sodium dodecyl sulfate polyacrylamide gel electrophoresis
Footnotes
Publisher's Disclaimer: This is a PDF file of an unedited manuscript that has been accepted for publication. As a service to our customers we are providing this early version of the manuscript. The manuscript will undergo copyediting, typesetting, and review of the resulting proof before it is published in its final citable form. Please note that during the production process errors may be discovered which could affect the content, and all legal disclaimers that apply to the journal pertain.
References
- Akers CK, Parsons DF. X-ray diffraction of myelin membrane. I. Optimal conditions for obtaining unmodified small angle diffraction data from frog sciatic nerve. Biophys J. 1970;10:101–15. doi: 10.1016/S0006-3495(70)86288-9. [DOI] [PMC free article] [PubMed] [Google Scholar]
- Avila RL, Inouye H, Baek R, Yin X, Trapp BD, Feltri ML, Wrabetz L, Kirschner DA. Structure and stability of internodal myelin in mouse models of hereditary neuropathy. J Neuropathol Exp Neurol. 2005;64:976–990. doi: 10.1097/01.jnen.0000186925.95957.dc. [DOI] [PubMed] [Google Scholar]
- Avila RL, Tevlin BR, Lees JP, Inouye H, Kirschner DA. Myelin structure and composition in zebrafish. Neurochem Res. 2007;32:197–209. doi: 10.1007/s11064-006-9136-5. [DOI] [PubMed] [Google Scholar]
- Barbu M. Molecular cloning of cDNAs that encode the chicken P0 protein: evidence for early expression in avians. J Neurosci Res. 1990;25:143–51. doi: 10.1002/jnr.490250119. [DOI] [PubMed] [Google Scholar]
- Bizzozero OA, Bixler HA, Davis JD, Espinosa A, Messier AM. Chemical deacylation reduces the adhesive properties of proteolipid protein and leads to decompaction of the myelin sheath. J Neurochem. 2001;76:1129–41. doi: 10.1046/j.1471-4159.2001.00116.x. [DOI] [PubMed] [Google Scholar]
- Bizzozero OA, Fridal K, Pastuszyn A. Identification of the palmitoylation site in rat myelin P0 glycoprotein. J Neurochem. 1994;62:1163–71. doi: 10.1046/j.1471-4159.1994.62031163.x. [DOI] [PubMed] [Google Scholar]
- Blaurock AE. Low-Angle X-Ray Diffraction Studies of the Myelin Sheath of Nerve. University of Michigan. Ph.D.; 1967. [Google Scholar]
- Blaurock AE. Structure of the nerve myelin membrane: proof of the low-resolution profile. J Mol Biol. 1971;56:35–52. doi: 10.1016/0022-2836(71)90082-9. [DOI] [PubMed] [Google Scholar]
- Blaurock AE, Yale JL, Roots BI. Ca-controlled, reversible structural transition in myelin. Neurochem Res. 1986;11:1103–29. doi: 10.1007/BF00965941. [DOI] [PubMed] [Google Scholar]
- Boggs JM, Menikh A, Rangaraj G. Trans interactions between galactosylceramide and cerebroside sulfate across apposed bilayers. Biophys J. 2000;78:874–85. doi: 10.1016/S0006-3495(00)76645-8. [DOI] [PMC free article] [PubMed] [Google Scholar]
- Brösamle C, Halpern ME. Characterization of myelination in the developing zebrafish. Glia. 2002;39:47–57. doi: 10.1002/glia.10088. [DOI] [PubMed] [Google Scholar]
- Caspar DLD, Kirschner DA. Myelin membrane structure at 10 Å resolution. Nat New Biol. 1971;231:46–52. doi: 10.1038/newbio231046a0. [DOI] [PubMed] [Google Scholar]
- Chandross RJ, Bear RS, Montgomery RL. An X-ray diffraction comparison of myelins from the human nervous system. J Comp Neurol. 1978;177:1–9. doi: 10.1002/cne.901770102. [DOI] [PubMed] [Google Scholar]
- Cserzo M, Wallin E, Simon I, von Heijne G, Elofsson A. Prediction of transmembrane alpha-helices in prokaryotic membrane proteins: the dense alignment surface method. Protein Eng. 1997;10:673–6. doi: 10.1093/protein/10.6.673. [DOI] [PubMed] [Google Scholar]
- DeLano WL. The PyMOL Molecular Graphics System. San Carlos, CA: DeLano Scientific; 2002. [Google Scholar]
- Eichberg J. Myelin P0: new knowledge and new roles. Neurochem Res. 2002;27:1331–40. doi: 10.1023/a:1021619631869. [DOI] [PubMed] [Google Scholar]
- Eisenberg D, Schwarz E, Komaromy M, Wall R. Analysis of membrane and surface protein sequences with the hydrophobic moment plot. J Mol Biol. 1984;179:125–42. doi: 10.1016/0022-2836(84)90309-7. [DOI] [PubMed] [Google Scholar]
- Faham S, Boulting GL, Massey EA, Yohannan S, Yang D, Bowie JU. Crystallization of bacteriorhodopsin from bicelle formulations at room temperature. Protein Sci. 2005;14:836–40. doi: 10.1110/ps.041167605. [DOI] [PMC free article] [PubMed] [Google Scholar]
- Fernandez-Moran H, Finean JB. Electron microscope and low-angle x-ray diffraction studies of the nerve myelin sheath. J Biophys Biochem Cytol. 1957;3:725–48. doi: 10.1083/jcb.3.5.725. [DOI] [PMC free article] [PubMed] [Google Scholar]
- Filbin MT, Tennekoon GI. The role of complex carbohydrates in adhesion of the myelin protein, P0. Neuron. 1991;7:845–55. doi: 10.1016/0896-6273(91)90286-9. [DOI] [PubMed] [Google Scholar]
- Finean JB, Burge RE. The determination of the Fourier transform of the myelin layer from a study of swelling phenomena. J Mol Biol. 1963;17:672–82. doi: 10.1016/s0022-2836(63)80115-1. [DOI] [PubMed] [Google Scholar]
- Frishman D, Argos P. Knowledge-based protein secondary structure assignment. Proteins. 1995;23:566–79. doi: 10.1002/prot.340230412. [DOI] [PubMed] [Google Scholar]
- Gao Y, Li W, Filbin MT. Acylation of myelin P0 protein is required for adhesion. J Neurosci Res. 2000;60:704–13. doi: 10.1002/1097-4547(20000615)60:6<704::AID-JNR2>3.0.CO;2-5. [DOI] [PubMed] [Google Scholar]
- Glover KJ, Whiles JA, Wu G, Yu N, Deems R, Struppe JO, Stark RE, Komives EA, Vold RR. Structural evaluation of phospholipid bicelles for solution-state studies of membrane-associated biomolecules. Biophys J. 2001;81:2163–71. doi: 10.1016/s0006-3495(01)75864-x. [DOI] [PMC free article] [PubMed] [Google Scholar]
- Guex N, Diemand A, Peitsch MC. Protein modelling for all. Trends Biochem Sci. 1999;24:364–7. doi: 10.1016/s0968-0004(99)01427-9. [DOI] [PubMed] [Google Scholar]
- Hayasaka K, Nanao K, Tahara M, Sato W, Takada G, Miura M, Uyemura K. Isolation and sequence determination of cDNA encoding the major structural protein of human peripheral myelin. Biochem Biophys Res Commun. 1991;180:515–8. doi: 10.1016/s0006-291x(05)81094-0. [DOI] [PubMed] [Google Scholar]
- Hoglund G, Ringertz H. X-ray diffraction studies on peripheral nerve myelin. Acta Physiol Scand. 1961;51:290–5. doi: 10.1111/j.1748-1716.1961.tb02139.x. [DOI] [PubMed] [Google Scholar]
- Inouye H, Karthigasan J, Kirschner DA. Membrane structure in isolated and intact myelins. Biophys J. 1989;56:129–137. doi: 10.1016/S0006-3495(89)82658-X. [DOI] [PMC free article] [PubMed] [Google Scholar]
- Inouye H, Kirschner DA. Membrane interactions in nerve myelin. I. Determination of surface charge from effects of pH and ionic strength on period. Biophys J. 1988a;53:235–45. doi: 10.1016/S0006-3495(88)83085-6. [DOI] [PMC free article] [PubMed] [Google Scholar]
- Inouye H, Kirschner DA. Membrane interactions in nerve myelin: II. Determination of surface charge from biochemical data. Biophys J. 1988b;53:247–60. doi: 10.1016/S0006-3495(88)83086-8. [DOI] [PMC free article] [PubMed] [Google Scholar]
- Inouye H, Kirschner DA. NATO ASI Series. Springer-Verlag; 1990. Phylogenetic aspects of myelin structure; pp. 373–387. [Google Scholar]
- Inouye H, Kirschner DA. Folding and function of the myelin proteins from primary sequence data. J Neurosci Res. 1991;28:1–17. doi: 10.1002/jnr.490280102. [DOI] [PubMed] [Google Scholar]
- Inouye H, Tsuruta H, Sedzik J, Uyemura K, Kirschner DA. Tetrameric assembly of full-sequence protein zero myelin glycoprotein by synchrotron x-ray scattering. Biophys J. 1999;76:423–37. doi: 10.1016/S0006-3495(99)77209-7. [DOI] [PMC free article] [PubMed] [Google Scholar]
- Inouye H, Worthington AR, Worthington CR. An x-ray study of fish nerves. Biol Bull. 1980;159:485. Abstract. [Google Scholar]
- Kabsch W, Sander C. Dictionary of protein secondary structure: pattern recognition of hydrogen-bonded and geometrical features. Biopolymers. 1983;22:2577–637. doi: 10.1002/bip.360221211. [DOI] [PubMed] [Google Scholar]
- Kirschner DA, Ganser AL. Myelin labeled with mercuric chloride. Asymmetric localization of phosphatidylethanolamine plasmalogen. J Mol Biol. 1982;157:635–58. doi: 10.1016/0022-2836(82)90503-4. [DOI] [PubMed] [Google Scholar]
- Kirschner DA, Inouye H, Ganser AL, Mann V. Myelin membrane structure and composition correlated: a phylogenetic study. J Neurochem. 1989;53:1599–609. doi: 10.1111/j.1471-4159.1989.tb08558.x. [DOI] [PubMed] [Google Scholar]
- Kirschner DA, Wrabetz L, Feltri ML. The P0 gene. In: Lazzarini RA, Griffin JW, Lassmann H, et al., editors. Myelin Biology and Disorders. 1. Vol. 1. Amsterdam: Elsevier/Academic Press; 2004. pp. 523–545. [Google Scholar]
- Kraulis PJ. MOLSCRIPT: a program to produce both detailed and schemiatic plots of protein structures. J Appl Cryst. 1991;24:946–950. [Google Scholar]
- Laskowski RA, MacArthur MW, Moss DS, Thornton JM. PROCHECK: a program to check the stereochemical quality protein structures. J Appl Cryst. 1993;26:283–291. [Google Scholar]
- Lemke G, Axel R. Isolation and sequence of a cDNA encoding the major structural protein of peripheral myelin. Cell. 1985;40:501–8. doi: 10.1016/0092-8674(85)90198-9. [DOI] [PubMed] [Google Scholar]
- Luo X, Sharma D, Inouye H, Lee D, Avila RL, Salmona M, Kirschner DA. Cytoplasmic domain of human myelin protein zero likely folded as {beta}-structure in compact myelin. Biophys J. 2007;92:1585–97. doi: 10.1529/biophysj.106.094722. [DOI] [PMC free article] [PubMed] [Google Scholar]
- Martini R, Mohajeri MH, Kasper S, Giese KP, Schachner M. Mice doubly deficient in the genes for P0 and myelin basic protein show that both proteins contribute to the formation of the major dense line in peripheral nerve myelin. J Neurosci. 1995;15:4488–95. doi: 10.1523/JNEUROSCI.15-06-04488.1995. [DOI] [PMC free article] [PubMed] [Google Scholar]
- Mateu L, Luzzati V, Vargas R, Vonasek E, Borgo M. Order-disorder phenomena in myelinated nerve sheaths. II. The structure of myelin in native and swollen rat sciatic nerves and in the course of myelinogenesis. J Mol Biol. 1990;215:385–402. doi: 10.1016/s0022-2836(05)80359-6. [DOI] [PubMed] [Google Scholar]
- McIntosh TJ, Worthington CR. Direct determination of the lamellar structure of peripheral nerve myelin at low resolution (17 A) Biophys J. 1974;14:363–86. doi: 10.1016/S0006-3495(74)85922-9. [DOI] [PMC free article] [PubMed] [Google Scholar]
- McRee DE. XtalView/Xfit--A versatile program for manipulating atomic coordinates and electron density. J Struct Biol. 1999;125:156–65. doi: 10.1006/jsbi.1999.4094. [DOI] [PubMed] [Google Scholar]
- Moody MF. X-Ray Diffraction Pattern Of Nerve Myelin: A Method For Determining The Phases. Science. 1963;142:1173–4. doi: 10.1126/science.142.3596.1173. [DOI] [PubMed] [Google Scholar]
- Nielsen H, Engelbrecht J, Brunak S, von Heijne G. Identification of prokaryotic and eukaryotic signal peptides and prediction of their cleavage sites. Protein Eng. 1997;10:1–6. doi: 10.1093/protein/10.1.1. [DOI] [PubMed] [Google Scholar]
- Norton WT, Poduslo SE. Myelination in rat brain: method of myelin isolation. J Neurochem. 1973;21:749–57. doi: 10.1111/j.1471-4159.1973.tb07519.x. [DOI] [PubMed] [Google Scholar]
- Previtali SC, Quattrini A, Fasolini M, Panzeri MC, Villa A, Filbin MT, Li W, Chiu SY, Messing A, Wrabetz L, Feltri ML. Epitope-tagged P0 Glycoprotein Causes Charcot-Marie-Tooth-like Neuropathy in Transgenic Mice. Journal of Cell Biology. 2000;151:1035. doi: 10.1083/jcb.151.5.1035. [DOI] [PMC free article] [PubMed] [Google Scholar]
- Saavedra RA, Fors L, Aebersold RH, Arden B, Horvath S, Sanders J, Hood L. The myelin proteins of the shark brain are similar to the myelin proteins of the mammalian peripheral nervous system. J Mol Evol. 1989;29:149–56. doi: 10.1007/BF02100113. [DOI] [PubMed] [Google Scholar]
- Sakamoto Y, Kitamura K, Yoshimura K, Nishijima T, Uyemura K. Complete amino acid sequence of PO protein in bovine peripheral nerve myelin. J Biol Chem. 1987;262:4208–14. [PubMed] [Google Scholar]
- Schmitt FO, Bear RS, Clark GL. X-ray diffraction studies on nerve. Radiology. 1935;25:131–51. [Google Scholar]
- Schweitzer J, Becker T, Becker CG, Schachner M. Expression of protein zero is increased in lesioned axon pathways in the central nervous system of adult zebrafish. Glia. 2003;41:301–17. doi: 10.1002/glia.10192. [DOI] [PubMed] [Google Scholar]
- Senes A, Gerstein M, Engelman DM. Statistical analysis of amino acid patterns in transmembrane helices: the GxxxG motif occurs frequently and in association with beta-branched residues at neighboring positions. J Mol Biol. 2000;296:921–36. doi: 10.1006/jmbi.1999.3488. [DOI] [PubMed] [Google Scholar]
- Shapiro L, Doyle JP, Hensley P, Colman DR, Hendrickson WA. Crystal structure of the extracellular domain from P0, the major structural protein of peripheral nerve myelin. Neuron. 1996;17:435–49. doi: 10.1016/s0896-6273(00)80176-2. [DOI] [PubMed] [Google Scholar]
- Smith SO, Eilers M, Song D, Crocker E, Ying W, Groesbeek M, Metz G, Ziliox M, Aimoto S. Implications of threonine hydrogen bonding in the glycophorin A transmembrane helix dimer. Biophys J. 2002;82:2476–86. doi: 10.1016/S0006-3495(02)75590-2. [DOI] [PMC free article] [PubMed] [Google Scholar]
- Stratmann A, Jeserich G. Molecular cloning and tissue expression of a cDNA encoding IP1--a P0-like glycoprotein of trout CNS myelin. J Neurochem. 1995;64:2427–36. doi: 10.1046/j.1471-4159.1995.64062427.x. [DOI] [PubMed] [Google Scholar]
- Wells CA, Saavedra RA, Inouye H, Kirschner DA. Myelin P0-glycoprotein: predicted structure and interactions of extracellular domain. J Neurochem. 1993;61:1987–95. doi: 10.1111/j.1471-4159.1993.tb07434.x. [DOI] [PubMed] [Google Scholar]
- Worthington CR, Blaurock AE. A structural analysis of nerve myelin. Biophys J. 1969;9:970–90. doi: 10.1016/S0006-3495(69)86431-3. [DOI] [PMC free article] [PubMed] [Google Scholar]
- Xie B, Luo XY, Zhao C, Priest CM, Chan S-Y, O’Connor PB, Kirschner DA, Costello CE. Molecular characterization of myelin protein zero in Xenopus laevis peripheral nerve: Equilibrium between non-covalnetly associated diimer and monomer. Int J Mass Spctrom. 2007 doi: 10.1016/j.ijms.2007.08.007. in press. [DOI] [PMC free article] [PubMed] [Google Scholar]
- Xu W, Shy M, Kamholz J, Elferink L, Xu G, Lilien J, Balsamo J. Mutations in the cytoplasmic domain of P0 reveal a role for PKC-mediated phosphorylation in adhesion and myelination. Journal of Cell Biology. 2001;155:439. doi: 10.1083/jcb.200107114. [DOI] [PMC free article] [PubMed] [Google Scholar]
- You KH, Hsieh CL, Hayes C, Stahl N, Francke U, Popko B. DNA sequence, genomic organization, and chromosomal localization of the mouse peripheral myelin protein zero gene: Identification of polymorphic alleles. Genomics. 1991;9:751. doi: 10.1016/0888-7543(91)90370-t. [DOI] [PubMed] [Google Scholar]
Associated Data
This section collects any data citations, data availability statements, or supplementary materials included in this article.
Supplementary Materials
Supplementary Figure 1. (A) Charge density (number of charges per Å2) as a function of pH at ionic strength μ = 0.038 for xP0-ed (solid line). A similar plot (Inouye and Kirschner, 1988b) for mouse P0 is shown (dashed) for comparison. The unit area depends on the ionic strength as determined from the mouse data (Inouye and Kirschner, 1988b) as S = 405 μ−1.269 Å2. A temperature of 20 °C and dielectric constant of water 80 were chosen. The charge density equation was numerically solved with 1 mV step of surface potential in the range of −200 mV to 100 mV. (B) Charge density (number of charges per Å2) as a function of pH at ionic strength of 0.038 for the extracellular surfaces of frog (solid line) and mouse myelin (dashed). For purposes of this calculation, the lipid compositions for frog and mouse were assumed to be the same as the one for rat (Inouye and Kirschner, 1988b). The temperature, dielectric constant, and unit surface area that contain one P0 molecule were the same as in (A), and the membrane surface area was assumed to be ionic strength-dependent as it is in (A).
Supplementary Figure 2. Total potential energy curves at different pHs (2.5, 4.0, 5.6, 7.3, 8.5, 10.0) as a function of myelin period at constant ionic strength of 0.038 for frog myelin. It was assumed that the extracellular separation varied. The unit area (Å2) is ionic strength-dependent according to S = 405 μ−1.269. The other constants included the exclusion length of myelin (138 Å), temperature (20 °C), dielectric constant (80), Hamaker coefficient (5 × 10⁻¹⁴ erg), and hydration repulsion force with decay coefficient and height of hydration force (1.93 and 1.×1011, respectively). The exclusion length was derived from the balance between the van der Waals attraction and the hydration repulsion (Inouye and Kirschner, 1988a). The distance giving the energy minimum was identical to the myelin period measured by x-ray diffraction. Note that the energy minima became broader and shallower as the myelin period increased, suggesting that the membrane lattice in myelin is paracrystalline.
Supplementary Figure 3. Comparison between the observed (circles) and calculated myelin period as a function of pH. Myelin periods were calculated as a function of pH at constant ionic strength of 0.029 (A) and 0.038 (B) for frog (solid line) and mouse myelin (dashed). The unit area depends on the ionic strength as determined from the mouse study ((Inouye and Kirschner, 1988b); see Supplementary Fig. 2). The constants were the same as above. Note that there are three different phases: swollen phases at low and higher pH, and a compact phase at pH~4. This pH titration curve shifts to more alkaline pH for frog, due to a higher pI for its extracellular sequence (see text and Fig. 1C).