

Abstract
Whether glucagon-like peptide (GLP)-1 requires the hepatic portal vein to elicit its insulin secretion-independent effects on glucose disposal in vivo was assessed in conscious dogs using tracer and arteriovenous difference techniques. In study 1, six conscious overnight-fasted dogs underwent oral glucose tolerance testing (OGTT) to determine target GLP-1 concentrations during clamp studies. Peak arterial and portal values during OGTT ranged from 23 to 65 pM and from 46 to 113 pM, respectively. In study 2, we conducted hyperinsulinemic-hyperglycemic clamp experiments consisting of three periods (P1, P2, and P3) during which somatostatin, glucagon, insulin and glucose were infused. The control group received saline, the PePe group received GLP-1 (1 pmol·kg−1·min−1) peripherally, the PePo group received GLP-1 (1 pmol·kg−1·min−1) peripherally (P2) and then intraportally (P3), and the PeHa group received GLP-1 (1 pmol·kg−1·min−1) peripherally (P2) and then through the hepatic artery (P3) to increase the hepatic GLP-1 load to the same extent as in P3 in the PePo group (n = 8 dogs/group). Arterial GLP-1 levels increased similarly in all groups during P2 (~50 pM), whereas portal GLP-1 levels were significantly increased (2-fold) in the PePo vs. PePe and PeHa groups during P3. During P2, net hepatic glucose uptake (NHGU) increased slightly but not significantly (vs. P1) in all groups. During P3, GLP-1 increased NHGU in the PePo and PeHa groups more than in the control and PePe groups (change of 10.8 ± 1.3 and 10.6 ± 1.0 vs. 5.7 ± 1.0 and 5.4 ± 0.8 μmol·kg−1·min−1, respectively, P < 0.05). In conclusion, physiological GLP-1 levels increase glucose disposal in the liver, and this effect does not involve GLP-1 receptors located in the portal vein.
Keywords: glucose uptake, dog, oral glucose tolerance test, glucagon-like peptide-1
Glucagon-Like Peptide (GLP)-1 is synthesized from proglucagon in L cells of the duodenum, distal ileum, and colon. It is secreted in response to meal absorption and is rapidly released into the portal vein (2, 26). The earliest discovered biological effect of GLP-1 was its ability to increase glucose-dependent insulin secretion (20). It is also known to increase the transcription of the proinsulin gene (15). These capabilities, together with the observed hypoglycemic effect of GLP-1 (9), led to the hypothesis that it might be useful in the treatment of diabetes.
Recent evidence has established the presence of GLP-1 sensors or receptors in the hepatoportal region (4, 7, 31, 33). Because GLP-1 is secreted into the portal vein and is rapidly degraded in the plasma, the hepatoportal region may play a critical role in the generation of the full effects of GLP-1, especially on the liver, where the presence of GLP-1 receptors is not yet clearly established. This may explain the controversial results regarding GLP-1’s insulin secretion-independent effects in vivo on tissue glucose uptake (9, 10, 13, 20, 34, 36) because the incretin was delivered peripherally, thereby minimizing the role of hepatoportal GLP-1 sensors.
In a previous study (11) in conscious dogs, we demonstrated that supraphysiological levels of GLP-1 could increase hepatic glucose uptake and glycogen synthesis independent of an action on insulin or glucagon secretion. Furthermore, the route of GLP-1 infusion (peripheral or through the portal vein) had no effect on its hepatic action. The dose of GLP-1 used, however, did not allow a conclusion regarding the involvement of the portal vein in GLP-1 action. Indeed, the infusion rate used increased portal GLP-1 concentrations substantially even though the peptide was given peripherally. It is possible therefore that the portal vein GLP-1 level obtained with peripheral infusion saturated the portal vein GLP-1 receptors.
GLP-1 receptors are present on β-cells (39), and there are numerous reports of GLP-1 binding sites on glucose-consuming tissues such as skeletal muscle and fat (14, 41, 43). Most in vitro studies show that GLP-1 stimulates glucose uptake and metabolism in muscle (27, 43, 46) and adipocytes (45), suggesting that GLP-1 can potentially promote glucose disposal directly in vivo in these tissues in addition to its effect on insulin secretion. By contrast, even though GLP-1 has been shown to increase glycogen synthesis in the liver (3), the presence of hepatic GLP-1 binding sites remains controversial (3, 5, 8, 44).
We therefore performed the present study using the conscious dog to assess the involvement of the portal vein in pancreatic hormone secretion-independent effects of physiological levels of GLP-1.
MATERIALS AND METHODS
Animals and Surgical Procedures
Experiments were performed on thirty-two 42-h fasted conscious mongrel dogs (20–25 kg) of either sex that had been fed once daily a standard meat and chow diet (31% protein, 52% carbohydrate, 11% fat, and 6% fiber based on dry weight, Kal Kan; Vernon, CA; and Purina Lab Canine Diet no. 5006, Purina Mills; St. Louis, MO). The dogs were housed in a facility that met American Association for the Accreditation of Laboratory Animal Care guidelines, and protocols were approved by the Vanderbilt University Medical Center Animal Care Committee. At least 16 days before experimentation, a laparotomy was performed with animals under general anesthesia. Silastic catheters (Dow Corning; Midland, MI) for blood sampling were placed into the portal vein, a hepatic vein, and a femoral artery, and infusion catheters were inserted into a jejunal vein, a splenic vein, and a hepatic artery as previously described (32). Ultrasonic flow probes (Transonic Systems; Ithaca, NY) were placed around the portal vein and hepatic artery. On the day of the experiment, the catheters were exteriorized under local anesthesia, and intravenous access was established in three peripheral veins. Dogs were used for an experiment only if they met established criteria for good health (30).
Oral Glucose Tolerance Test
To determine relevant physiological levels of GLP-1, an oral glucose tolerance test (OGTT) was performed on six 18-h fasted dogs. After a basal period of 100 min, glucose (1.5 g/kg) was rapidly given orally, and blood samples were withdrawn over the subsequent 3-h period from the femoral artery and portal vein to measure insulin, glucose, and GLP-1 concentrations.
GLP-1 Infusion Studies
In each of the four groups (n = 8 dogs each), the protocol consisted of a tracer equilibration period (0–90 min) and a basal period (90–120 min) followed by three test periods of 90 min each (P1 = 120–210 min, P2 = 210–300 min, and P3 = 300–390 min), during which hyperglycemia and hyperinsulinemia existed (Fig. 1). At time (t) = 0 min, a primed (1.2 μCi/kg), continuous (0.17 μCi/min) infusion of [3-3H]glucose (New England Nuclear; Boston, MA) and a continuous infusion of indocyanine green dye (0.08 mg/min, Sigma Chemical; St. Louis, MO) were started. At t = 120 min, a peripheral infusion of somatostatin (0.8 μg·kg−1·min−1) was begun to inhibit endogenous pancreatic insulin and glucagon secretion. Intraportal infusions of insulin (1.2 mU·kg−1·min−1), to achieve hyperinsulinemia (33 times the basal arterial levels), and glucagon (0.55 ng·kg−1·min−1), to maintain basal levels, were also started. A dextrose solution was infused peripherally at variable rates starting at t = 120 min to clamp the arterial plasma glucose level at 12.5 mM. The infusion rate of glucose was adjusted in response to the plasma glucose concentration, which was measured every 5 min. In the two last test periods (210–300 and 300–390 min), the control group received a saline infusion via the sapheneous vein, whereas the three other groups received a GLP-1(7–36) amide infusion at 1.0 pmol·kg−1·min−1 (Bachem Bioscience; King of Prussia, PA). In the PePe group, GLP-1 was infused via a saphenous vein until the end of the experiment (P2 + P3 periods). In the PePo group, GLP-1 was first infused via a saphenous vein for 90 min (P2 period) and then intraportally (at the same rate) for the next 90 min (P3 period). In the PeHa group, GLP-1 was first infused via a saphenous vein for 90 min (P2 period) and then into the hepatic artery (at the same rate) for the next 90 min (P3 period). This infusion rate generated levels of GLP-1 similar to those seen postprandially. Blood was collected on EDTA, and an inhibitor of dipeptidyl peptidase IV (DPP-IV) activity was immediately added to whole blood to preserve the integrity of the GLP-1 (Linco Research; St. Charles, MO).
Fig. 1.
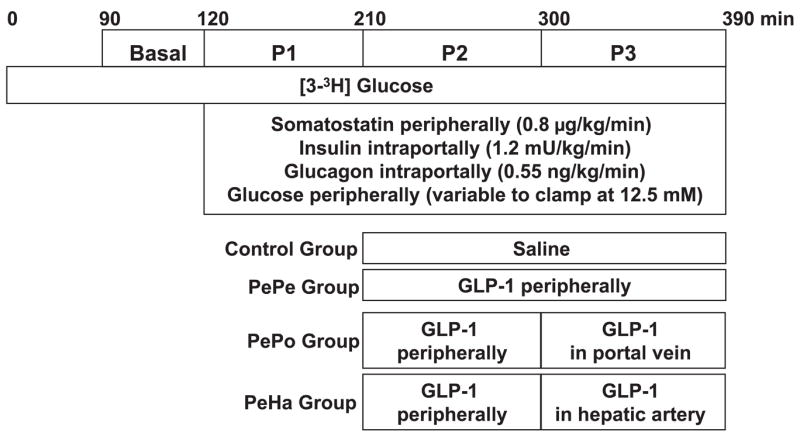
Protocol design. The protocol consisted of a tracer equilibration period (0–90 min) and a basal period (90–120 min) followed by three test periods of 90 min each (P1 = 120–210 min, P2 = 210–300 min, and P3 = 300–390 min). The control group received saline, the PePe group received glucagon-like peptide 1 (GLP-1; 1 pmol·kg−1·min−1) peripherally, the PePo group received GLP-1 (1 pmol·kg−1·min−1) peripherally (P2) and then intraportally (P3), and the PeHa group received GLP-1 (1 pmol·kg−1·min−1) peripherally (P2) and then through the hepatic artery (P3) to increase the hepatic GLP-1 load to the same extent as in P3 in the PePo group (n = 8 dogs/group). The GLP-1 infusion rate was 1 pmol·kg−1·min−1 in the PePe, PePo, and PeHa groups during P2 and P3.
Analytical Procedures
Plasma glucose and glucose radioactivity (3H), insulin, glucagon, and blood lactate were measured as previously described (30, 32). Plasma GLP-1 concentrations were determined by an ELISA method (Linco Research) that specifically quantifies the biologically active form of GLP-1.
Calculations
Net hepatic substrate balance (NHB) was calculated using the formula [H × FT − (A × FA + P × FP)], where A, P, and H are the arterial, portal vein, and hepatic vein substrate concentrations and FA, FP, and FT are the hepatic arterial, portal vein, and total hepatic blood or plasma flows (as appropriate), respectively. Hepatic substrate load was calculated as A × FA + P × FP. Net hepatic fractional extraction (FE) was calculated as NHB ÷ hepatic load. For all calculated data, plasma glucose concentrations were converted to blood concentrations with factors compiled in our laboratory from extensive data in which plasma and blood glucose values were compared (22). During the basal period, arterial, portal vein, and hepatic vein plasma glucose concentrations were multiplied by 0.74, 0.74, and 0.73 to convert them to blood glucose concentrations, and, during the experimental period, all plasma concentrations were multiplied by 0.73. The use of blood rather than plasma glucose concentrations ensures accurate NHB calculations regardless of the characteristics of glucose entry into the erythrocyte. Sinusoidal hormone concentrations were calculated using the formula (A × FA + P × FP) ÷ FT as described previously (32). The assessment of hepatic artery GLP-1 concentration in the PeHa group was calculated using the formula [A + (GLP-1 infusion rate ÷ FA)]. Net hepatic carbon retention (NHCR), an indicator of the carbon available for glycogen synthesis, was calculated as net hepatic glucose uptake (NHGU) minus net hepatic lactate output. This omitted the contribution of gluconeogenic substrates other than lactate and also of carbon utilized in hepatic oxidation. With regard to the former, glycerol would not have contributed in a net sense to glycogen synthesis, because lipolysis was inhibited and its net hepatic uptake during the test periods was not different from zero (data not shown). Amino acid uptake did not change throughout the study of Nishizawa et al. (32), which used a protocol identical to the present one, and it would have contributed a maximum of ≈3 μmol glucose equivalents·kg−1·min−1 in each protocol. This would have been offset by the hepatic glucose oxidation of ≈3 μmol glucose equivalents·kg−1·min−1 that would have been predicted (38). Thus NHCR should provide a reasonable estimate of net hepatic glycogen synthesis.
Statistical Analysis
Data are reported as means of the values for the last 30 min of each experimental period. NHGU, FE, and NHCR are expressed as the difference between the mean values observed during the last 30 min of each experimental period (P1, P2, or P3). Differences (P2 − P1 and P3 − P1) were calculated to assess the specific effect of GLP-1 over the effect achieved by pancreatic hormones and hyperglycemia per se.
Data are expressed as means ± SE and were analyzed by Sigma-Stat. Two-way repeated-measures ANOVA was used to compare time course data of groups. Classification factors were treatment group and time period. For significant F values, the one-tailed Fishers least-significant difference method test was employed as a post hoc analysis. Differences were considered significant when P < 0.05.
RESULTS
Physiological GLP-1 Levels in Dogs Given an OGTT
After the OGTT, arterial plasma glucose increased rapidly from 6.3 mmol/l to a peak of 11 mmol/l. Insulin concentrations increased concomitantly with glucose, with arterial concentrations reaching 450 pmol/l (Fig. 2). Plasma glucose and insulin concentrations remained elevated for 2 h and then returned to basal values by 3 h. During the basal period, GLP-1 levels in both the arterial and portal plasma averaged ~15 pM. After oral glucose intake, GLP-1 concentrations increased rapidly over 20 min, reaching peak values of 35 ± 7 and 61 ± 13 pM in the artery and portal vein, respectively (Fig. 2). The maximal GLP-1 concentrations in the artery ranged from 23 to 65 pM, and those in the portal vein ranged from 46 to 113 pM. The concentrations in both blood vessels remained above basal for ~2 h after administration of the glucose load, with mean values over that 2-h period being 28 ± 4 pM in the artery and 43 ± 8 pM in the portal vein. As late as 60 min after the glucose load, half of the dogs exhibited portal vein concentrations >60 pM, demonstrating the sustained response. The peak hepatic sinusoidal concentrations were 56 ± 13 pM, with a range of 41–109 pM. The sinusoidal concentrations over the 2-h period after glucose administration averaged 41 ± 7 pM.
Fig. 2.
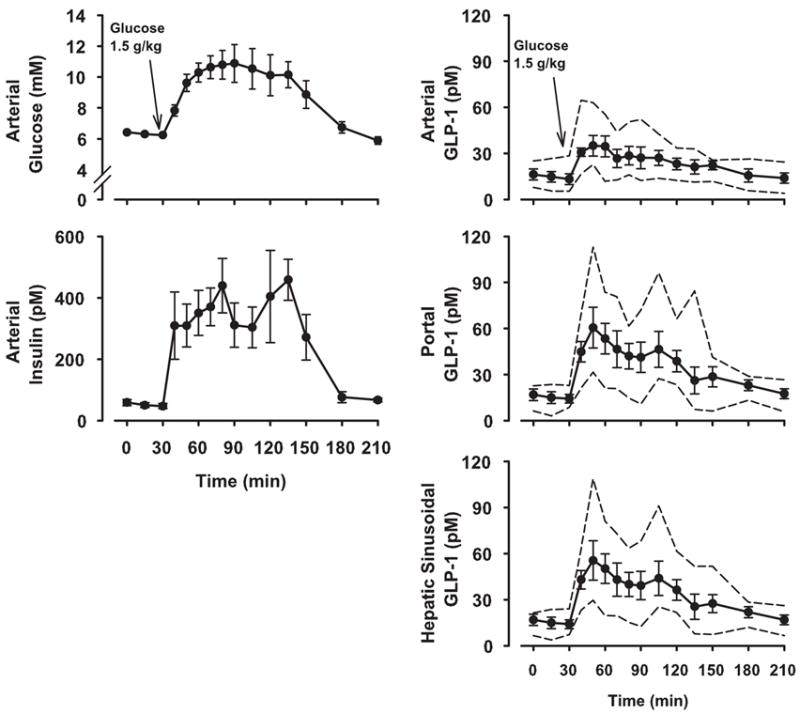
Plasma glucose, insulin, and GLP-1 concentrations after an oral glucose tolerance test in overnight-fasted dogs (n = 6). Data shown as symbols and solid lines are means ± SE. Dashed lines denote the ranges (upper and lower ends) of data from this group.
Hyperinsulinemic-Hyperglycemic Clamp Studies With or Without GLP-1 Infusion
Hormone concentrations and blood flows
Arterial and hepatic sinusoidal insulin concentrations increased (P < 0.05) by a physiological amount during test periods P1, P2, and P3 with no significant differences among the groups (Table 1). No increase of insulin levels in either the artery or portal vein was recorded after GLP-1 infusion, indicating that GLP-1 did not overcome the pancreatic clamp brought about by somatostatin infusion (Table 1). Furthermore, in the control and PeHa groups, C-peptide levels were measured and remained at low values after the initiation of the pancreatic clamp with or without GLP-1 infusion (0.40 ± 0.04 ng/ml before somatostatin infusion to 0.15 ± 0.03 and 0.15 ± 0.01 ng/ml, respectively, during somatostatin infusion). Arterial and hepatic sinusoidal glucagon concentrations remained basal and similar in all groups (Table 1). Clearly, therefore, in the present study, GLP-1 did not modify the concentrations of pancreatic hormones, and any metabolic effects observed occurred independent of GLP-1’s effects on insulin and glucagon secretion. Arterial blood flow increased slightly with time, but no significant differences were recorded among groups (Table 1). Portal blood flow tended to decrease after the basal period in all groups due to somatostatin infusion. Total hepatic blood flow, therefore, changed minimally (<10%) in all groups over the course of the study (Table 1).
Table 1.
Hepatic blood flows and plasma insulin, glucagon, and GLP-1 concentrations

Data are means ± SE; n = 8 dogs/group. Time periods P1 = 120–210 min, P2 = 210–300 min, and P3 = 300–390 min. No glucagon-like peptide (GLP)-1 was infused in the control group. GLP-1 infused peripherally during P2 and P3 (PePe group), peripherally during P2 and intraportally during P3 (PePo group), and peripherally during P2 and in the hepatic artery during P3 (PeHa group).
P < 0.05 vs. the basal period;
P < 0.05 vs. the PePe group.
With peripheral GLP-1 infusion (P2), arterial and portal vein GLP-1 concentrations increased significantly (P < 0.05) over control group values and reached levels seen postprandially in all three groups (≈50 pM; Table 1). These levels remained constant during P3 in the PePe group. In the PePo group, the portal vein GLP-1 concentration increased significantly (to ≈80 pM) in response to the portal infusion of GLP-1 (P3). In the PeHa group, the portal vein levels did not rise during hepatic artery GLP-1 infusion. Hepatic sinusoidal GLP-1 concentrations were similar (≈45 pM) in all groups during the peripheral infusion of GLP-1 (P2), but, during P3, both portal vein (PePo group) and hepatic artery infusion (PeHa group) increased the hepatic sinusoidal GLP-1 concentration (to ≈80 pM) compared with peripheral infusion (PePe group).
Blood glucose levels and net hepatic glucose balance
In response to peripheral glucose infusion, arterial blood glucose and hepatic glucose load increased significantly in all groups (Fig. 3). No differences were recorded among groups. The combination of hyperinsulinemia and hyperglycemia during the P1 test period switched the liver from net hepatic glucose output to NHGU in all groups (data not shown). During saline infusion, NHGU increased slightly (relative to P1) during P2 and P3 (change of 2.6 ± 0.7 and 5.7 ± 1.0 μmol·kg−1·min−1, respectively; Fig. 4A). Peripheral infusion of GLP-1 did not significantly enhance NHGU during P2 in any group (Fig. 4B). NHGU rose slightly in P3 in the control and PePe groups. However, when GLP-1 was infused in the portal vein or hepatic artery (P3), GLP-1 significantly increased NHGU (change of 10.8 ± 1.3 and 10.6 ± 1.0 μmol·kg−1·min−1, P < 0.05 relative to the change of 5.70 ± 0.98 and 5.42 ± 0.91 μmol·kg−1·min−1 in the control and PePe groups, respectively). Clearly, it made no difference whether GLP-1 was given via the portal vein or hepatic artery.
Fig. 3.
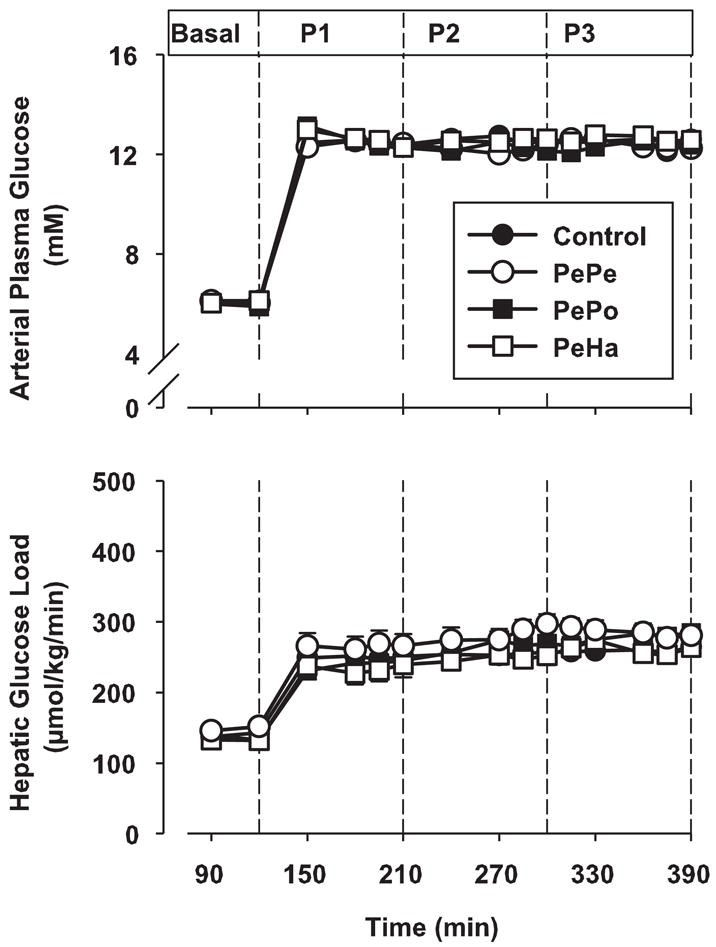
Arterial plasma glucose and hepatic glucose loads in 42-h fasted dogs in the presence of somatostatin, intraportal insulin and glucagon, and peripheral glucose infusions. GLP-1 was infused peripherally during P2 and P3 (PePe group), peripherally during P2 and intraportally during P3 (PePo group), or peripherally during P2 and in the hepatic artery during P3 (PeHa group). Data are expressed as means ± SE; n = 8 dogs/group. There were no significant differences among the groups.
Fig. 4.
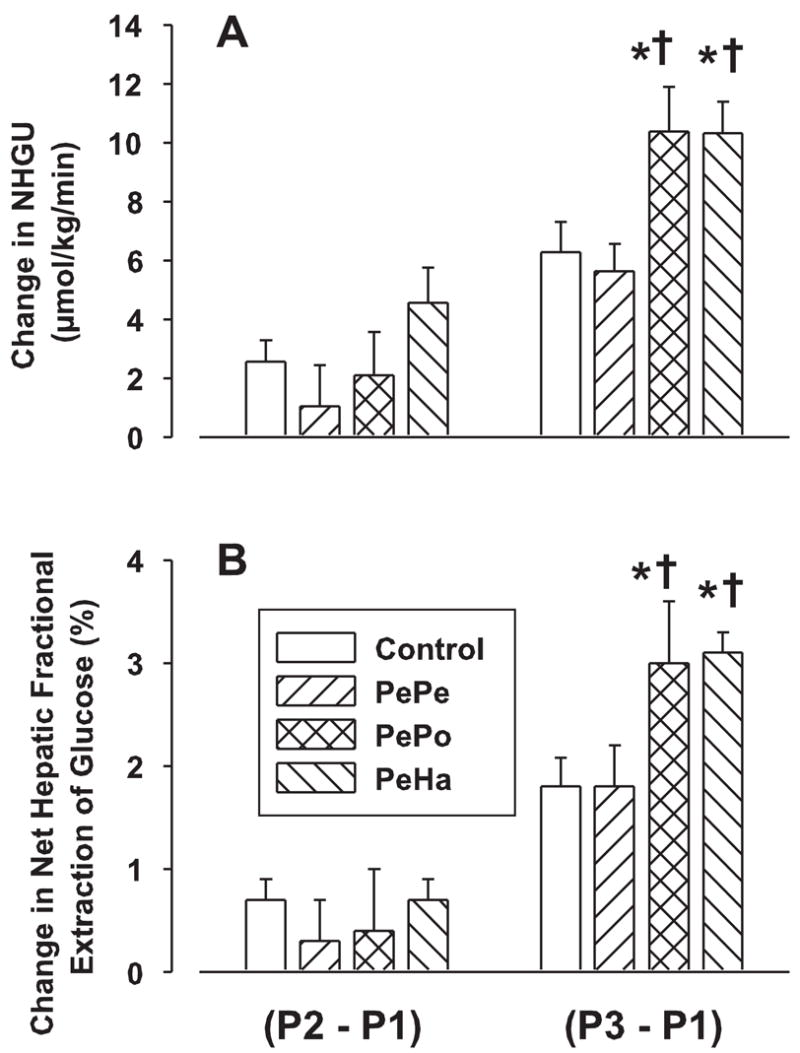
GLP-1 effects on net hepatic glucose uptake (NHGU) and net hepatic fractional extraction (FE) of glucose. See Fig. 3 for study conditions. Data are expressed as means ± SE (n = 8 dogs/group) and represent the incremental increase of NHGU and FE between the experimental periods P1, P2, and P3. *P < 0.05 vs. the control group; †P < 0.05 vs. the PePe group.
The change in net hepatic FE of glucose followed the same pattern as the change in NHGU (Fig. 4B). Short-term peripheral GLP-1 infusion did not significantly increase FE in any group. Prolonged peripheral GLP-1 infusions remained without any significant effect on FE, whereas hepatic portal vein and hepatic artery GLP-1 infusions resulted in the same significant increase of FE (change of 1.8 ± 0.3, 1.8 ± 0.2, 3.0 ± 0.5, and 3.0 ± 0.2% for the control, PePe, PePo, and PeHa groups during P3 relative to P1, respectively, P < 0.05 vs. the control and PePe groups).
The mean glucose infusion rate (GIR) required to maintain constant hyperglycemia increased significantly over the experimental periods (Fig. 5). However, no differences between groups were recorded in any test period. When assessed with tracer dilution technique, whole body glucose utilization (Rd) followed the same pattern as GIR (Fig. 5). Rd increased with time in each experimental group, but no differences were recorded between groups at any time point. Endogenous glucose production decreased over the duration of the study in all groups from ≈23 μmol·kg−1·min−1 before the pancreatic clamp to ≈3 μmol·kg−1·min−1 in P2 and P3 with no significant difference between groups (data not shown).
Fig. 5.
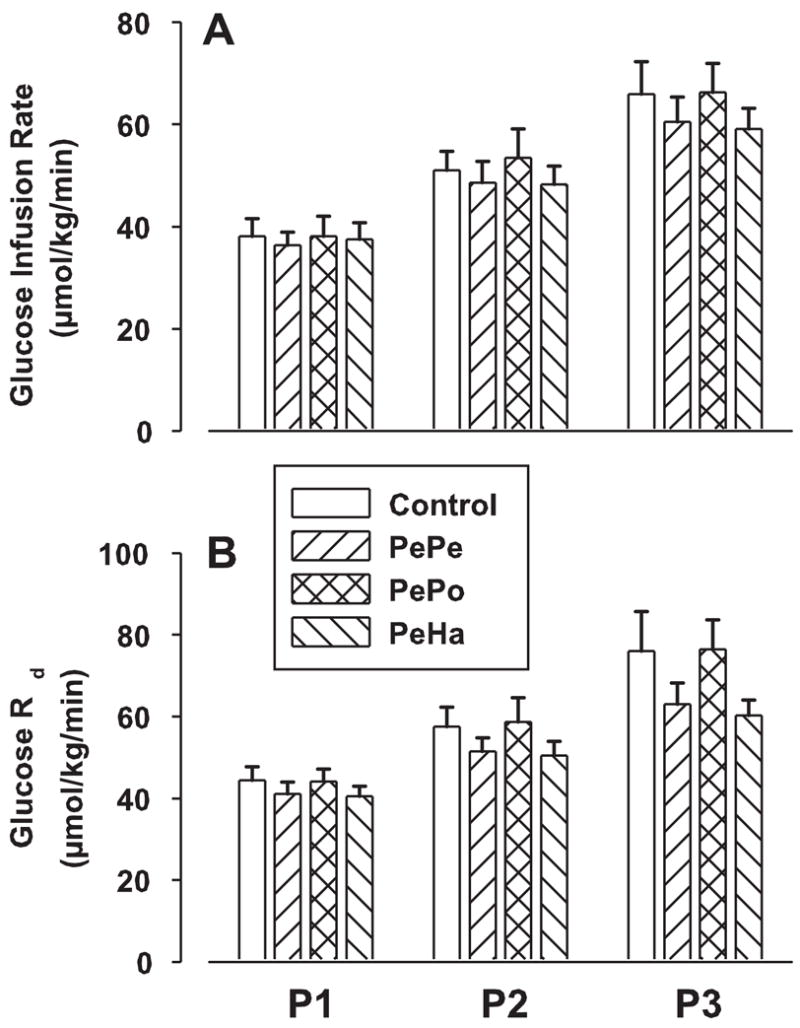
GLP-1 effects on glucose infusion rate and whole body glucose utilization (Rd) in 42-h fasted dogs. See Fig. 3 for study conditions. Data are means ± SE (n = 8 dogs/group) for each test period: P1 = 120–210 min, P2 = 210–300 min, and P3 = 300–390 min. There were no significant differences among the groups.
Lactate concentrations, net hepatic lactate balance, and glycogen synthesis
After the hyperglycemic-hyperinsulinemic clamp was initiated, arterial blood lactate concentrations increased and remained constant during the test periods P1, P2, and P3 (from ≈0.4 to 0.9 mM) with no significant differences among groups (not shown). Net hepatic lactate balance changed from uptake to output in all groups, and, after a peak during P1 (≈8.0 μmol·kg−1·min−1), it declined to a value of ≈4.0 μmol·kg−1·min−1 in all groups during P2 and P3 (Fig. 6). Concomitantly, combined hyperinsulinemia and hyperglycemia (P1) was associated with NHCR (data not shown). During the peripheral GLP-1 infusion (P2), NHCR was not significantly stimulated in the PePe, PePo, and PeHa groups compared with the control group (P2 − P1: change of 3.7 ± 0.9, 2.8 ± 1.5, 3.8 ± 1.3, and 5.0 ± 0.8 μmol·kg−1·min−1 for the control, PePe, PePo, and PeHa groups, respectively; Fig. 6). With prolonged GLP-1 infusion (P3), NHCR further increased in all groups compared with P1, but it was only significantly stimulated over control values (P < 0.05) when GLP-1 was infused into the portal vein or hepatic artery (PePo and PeHa groups, respectively; Fig. 6).
Fig. 6.
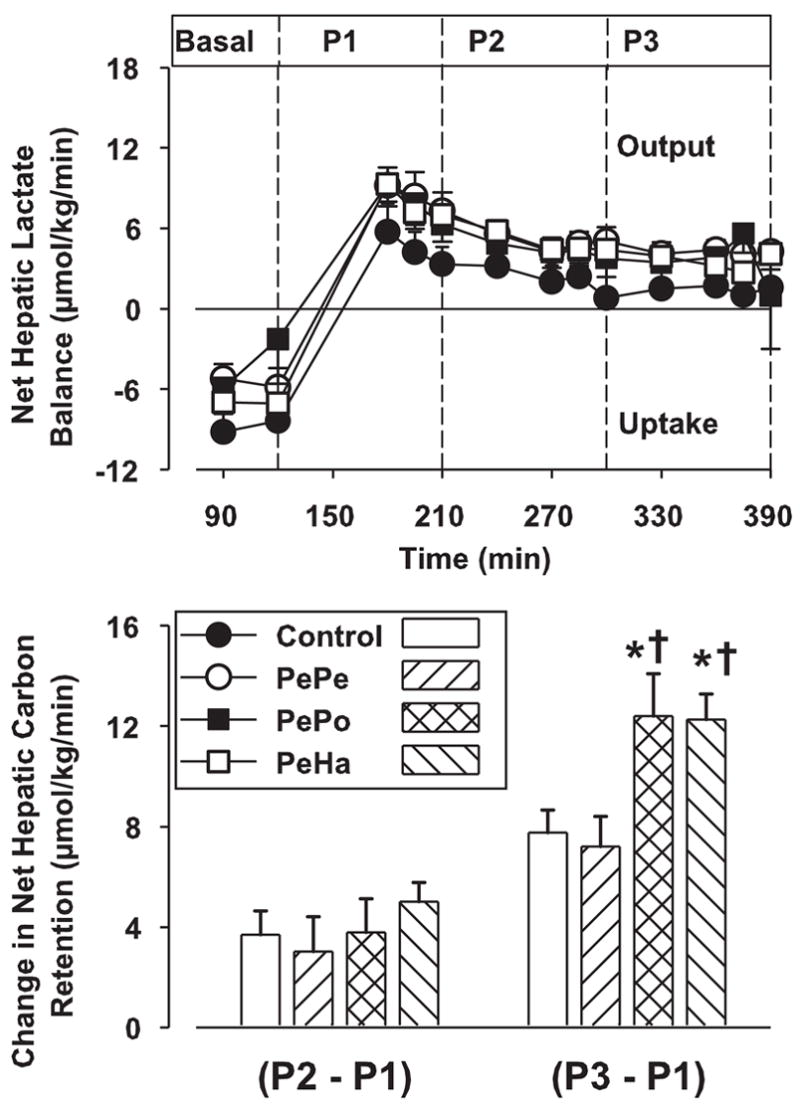
Net hepatic lactate balance and net hepatic carbon retention (NHCR). See Fig. 3 for study conditions. Data are means ± SE (n = 8 dogs/group) for each test period: basal = 90–120 min, P1 = 120–210 min, P2 = 210–300 min, and P3 = 300–390 min. *P < 0.05 vs. the control group; †P < 0.05 vs. the PePe group.
DISCUSSION
Previous work performed in our laboratory (11, 32) has shown that GLP-1 is able to increase glucose disposal under hyperglycemic, hyperinsulinemic conditions, independent of its well-recognized effects on insulin and glucagon secretion. Furthermore, our data suggested that the insulin secretion-independent effects of GLP-1 were hepatic in origin and were also time dependent, requiring over 90 min to be seen and even longer to become maximal (150–180 min). We also assessed the role of the portal vein in the generation of GLP-1’s effects by comparing the effectiveness of peripheral and intraportal GLP-1 infusion. When infused intraportally, GLP-1 did not increase glucose utilization by the liver to a greater extent than it did when it was infused peripherally at the same rate. The dose of GLP-1 used, however, was probably not optimal, as the portal GLP-1 concentrations were supraphysiological even when the peptide was given via a peripheral vein. The present study was thus specifically designed to answer the following questions: 1) Does GLP-1 have pancreatic hormone-independent effects at physiological levels? and 2) Do these effects require the involvement of GLP-1 receptors located within the portal vein?
In the present study, we were successful in achieving physiological concentrations of GLP-1 (i.e., concentrations that fell in the range of those exhibited by dogs receiving an OGTT) in all blood vessels tested, regardless of the route of GLP-1 infusion. All of the concentrations during the clamp studies were within 2 SD of the mean concentrations evident during OGTT. In addition, we were successful in achieving a gradient of portal and sinusoidal GLP-1 concentrations among the groups, as designed. The arterial concentrations were equivalent during P3 among the PePe, PePo, and PeHa groups, but the PePo group exhibited a significant elevation of portal GLP-1. Additionally, the PePo and PeHa groups exhibited a significant and equivalent elevation of sinusoidal GLP-1 compared with the PePe group.
Our results clearly show that physiological levels of GLP-1 stimulated NHGU when delivered intraportally, whereas no increase of NHGU was noted with the peripheral infusion. However, by maintaining the same concentration (~80 pM) of GLP-1 reaching the liver in the presence or absence of an increase in the portal vein GLP-1 level, we were able to show that the activation of GLP-1 receptors in the portal vein was not responsible for the effect on the liver. The net hepatic FE of glucose and the glycogen synthesis data are in agreement with NHGU. Thus it is clear that GLP-1 receptors located within the portal vein are not playing a critical role in the insulin secretion-independent effects of GLP-1 on the liver that we have observed. It is evident, however, that hepatic sinusoidal GLP-1 can play a role in the control of glucose metabolism by the liver. Recent reports suggest that the hepatoportal area is of special importance in physiological actions of GLP-1 (4, 7, 24, 25). For example, Nakabayashi et al. (31) reported that intra-portal GLP-1 infusion, at a physiological dose, stimulated afferent vagal nerve activity in rats. This activation, in turn, stimulated efferent signaling in the pancreatic branch of the vagus nerve, suggesting a neural component of GLP-1’s stimulation of insulin secretion. Burcelin et al. (7) showed in mice that the GLP-1 receptor is part of hepatoportal glucose sensing and that basal fasting levels of GLP-1 sufficiently activate the receptor to confer maximum glucose competence to the sensor. Indeed, when GLP-1 was infused intraportally with glucose, it had no effect on the well-known activation of the portal signal, which leads to an increase of glucose clearance. However, if coinfused with the GLP-1 receptor antagonist exendin(9–39), intraportal glucose delivery was not associated with increased glucose clearance, and thus the portal glucose signal was ablated (7). Our findings are in general agreement with these previous reports, because there was no differentiation between the hepatoportal region and the liver itself in at least some of those reports (e.g., Refs. 7 and 25).
Hepatic glucose metabolism was sensitive to GLP-1 at concentrations in the range seen in the postprandial state. We define postprandial concentrations as ~25–65 pM (arterial) or 45–110 pM (portal or sinusoidal) based on our OGTT data. Both peptones and some fatty acids apparently stimulate GLP-1 secretion (16, 17, 21), but data obtained in humans indicate that GLP-1 concentrations after mixed meals are similar to those we observed after an OGTT (35). By compiling the data from our previous work and the present study (Fig. 7), it can be seen that NHGU is linearly related to hepatic sinusoidal GLP-1 in the physiological range, up to at least 100 pM. It is also evident, however, that the direct effect of GLP-1 on the liver under the conditions of our study was small. It remains to be determined whether GLP-1 would be of greater significance in the presence of portal vein glucose delivery. In one study carried out in dogs, GLP-1 (at a rate 3-fold that used in our present investigation) and glucose were administered concurrently via the portal vein; circulating glucose concentrations were reduced with GLP-1 plus portal glucose vs. portal glucose alone, without an enhancement of insulin concentrations (25). No organ balance data were included in that report, however, making it impossible to tell if GLP-1’s effect included an increase in liver glucose uptake.
Fig. 7.
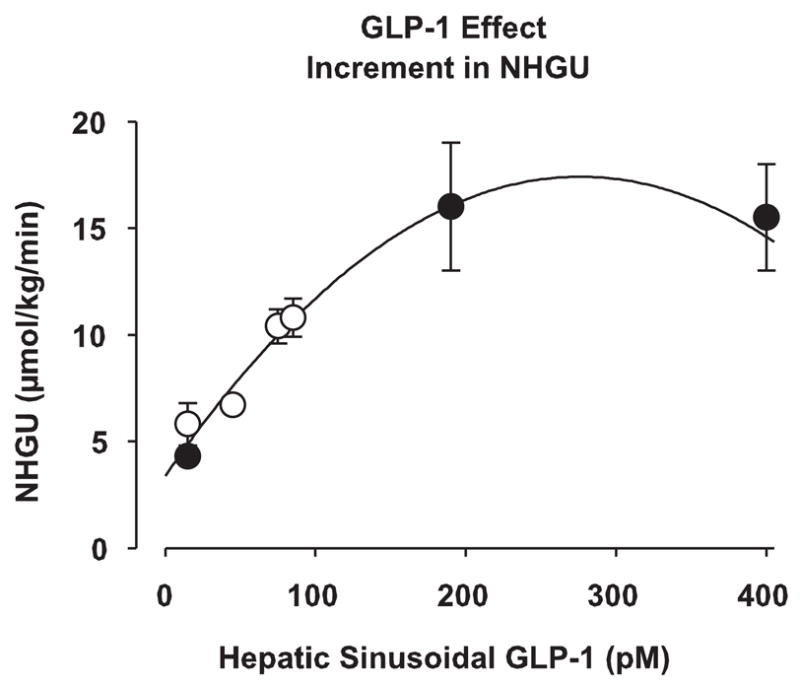
Dose-response curve of the stimulation NHGU during P3 with different hepatic sinusoidal GLP-1 concentrations. Data from our previous study (●; Ref. 11) and the present study (○) were combined. Data are expressed as means ± SE and represent the incremental increase of NHGU over P1. Line of best fit = 3.3792882879 + 0.1016201057x − 0.00018404034304x2 (r2 = 0.973), calculated with SigmaPlot 8.0 (SPSS; Chicago, IL).
Whether or not GLP-1 has a synergistic relationship with portally delivered (or intestinally absorbed) nutrients, there are at least two factors that could limit its physiological impact on hepatic glucose metabolism: the time course of its action and its rapid degradation. As we (32) have previously suggested, the effect of GLP-1 on liver glucose uptake may increase with time. In the present study, the enhancement of NHGU was prompt (~30–60 min) when the infusion route was switched from a peripheral vein to the portal vein or hepatic artery. Even though the PePe group exhibited no enhancement in NHGU during P3 (compared with the control group), it is impossible to rule out the possibility of an interaction between the duration of infusion and the route of delivery. In the investigation mentioned above in which dogs received intraportal GLP-1 infusion, the effect of GLP-1 to lower circulating glucose concentrations was slow, requiring at least 120 min (25). Nevertheless, the absorptive period after a mixed meal lasts for several hours (29), affording GLP-1 the opportunity to play an enhancing role in glucose disposal during the postprandial period. The peptide is rapidly degraded by DPP IV, however, and it is a substrate for neutral endopeptidase 24.11 and potentially for other nonspecific peptidases as well (12). DPP IV is widely distributed in the vasculature, including mesenteric bed capillaries and the portal vein, as well as a soluble form in plasma (12). Thus GLP-1 concentrations fall rapidly from their early peak after nutrient ingestion (Fig. 2). Our continuous infusion of GLP-1 was effective in producing a square wave increase in GLP-1 concentrations, but peak GLP-1 levels are unlikely to be sustained in the postprandial period. The fact that there is a steep linear relationship between NHGU and physiological concentrations of GLP-1 (Fig. 7), however, suggests a therapeutic potential for GLP-1 analogs resistant to degradation or for DPP IV inhibitors in the control of postprandial hyperglycemia.
Several studies have assessed the role of GLP-1 on glucose utilization independent of its effect on insulin secretion in vivo. The results, however, are divergent, and conclusions are hard to draw. Most of the clamp studies showing no insulin secretion-independent effect of GLP-1 were conducted under euglycemic conditions (34, 36), whereas, when a positive effect was recorded, the studies were performed in the presence of hyperglycemia (37, 42). These results suggest that the presence of hyperglycemia is required to elicit GLP-1 effects fully. The glucose-dependent effect of GLP-1 has largely been studied with regard to its effect on pancreatic β-cells. In addition, the present study showed that GLP-1 may have tissue-specific effects. We observed an effect of GLP-1 on the liver but not on whole body glucose utilization (GIR and Rd). The controversial results recorded in vivo regarding the GLP-1’s effect on glucose metabolism may arise from this tissue specificity, because a small increase in NHGU caused by GLP-1 may simply not be detected if only whole body glucose utilization and glucose infusion rates are assessed. GLP-1 may serve to alter glucose partitioning between the tissues (e.g., into the liver) rather than altering whole body disposal. In this way, it may serve to reduce postprandial glycemia.
The insulin secretion-independent effect of GLP-1 on hepatic glucose uptake that we observed is consistent with the presence of specific GLP-1 receptors on liver cells. Binding of GLP-1 to these receptors could initiate intracellular signaling pathways that could target kinases and/or factors involved in glucose uptake and glycogen synthesis. GLP-1 receptors on β-cells have been well characterized, and the binding of GLP-1 to its receptor leads to an increase of intracellular cAMP levels by a G protein-coupled activation of adenylate cyclase (6, 8, 15, 19). The presence of GLP-1 receptors in glucose-consuming tissues, such as skeletal muscle and adipose tissue, has also been reported (14, 41, 43). In in vitro studies, GLP-1 has been shown to increase glycogen synthesis in the liver (3). However, the presence of hepatic GLP-1 receptors remains controversial (3, 5, 8, 44). For example, based on the lack of cAMP production by GLP-1 in hepatocytes, Blackmore et al. (5) concluded GLP-1 receptors were absent in the liver. However, several studies have shown that in the liver and skeletal muscle, GLP-1 seems to act through specific receptors, different in structure and signaling pathways from those in the pancreas, which are cAMP associated. Second messengers such as inositol phosphoglycan or phosphatidylinositol 3-phosphate have been proposed (18, 23, 28, 40). In a more recent study (1), activation of phosphatidylinositol 3′-kinase, protein kinase B, and mitogen-activated protein kinases has been shown to be involved in the action of GLP-1 upon glycogen synthase a activity in rat skeletal muscle. Taken together, these observations are in favor of the existence of different GLP-1 receptor types on β-cells and other tissues, and this could explain the controversy over the presence of GLP-1 receptor mRNA in the liver based on the GLP-1 receptor sequence.
In conclusion, GLP-1, at physiological levels, significantly increased NHGU and hepatic glycogen synthesis. This effect was independent of insulin or glucagon secretion and apparently did not involve GLP-1 receptors located in the portal vein. Our study supports the presence of GLP-1 receptors in the liver. On the basis of the magnitude of the effect we observed, it seems unlikely that GLP-1’s direct effect on the liver plays a major role in its physiological action. This does not preclude the possibility of a pharmacological benefit, e.g., stimulation of postprandial NHGU and hepatic glycogen synthesis in individuals with impaired glucose tolerance or Type 2 diabetes by administration of a stable GLP-1 analog or a peptidase inhibitor. GLP-1 may thus play a therapeutic role in the control of postprandial hyperglycemia.
Acknowledgments
This work was presented in part at the American Diabetes Association 64th Scientific Session on June 4–8, 2004, in Orlando, FL.
GRANTS
This study was supported by National Institute of Diabetes and Digestive and Kidney Diseases Grant R01-DK-43706 and Diabetes Research and Training Center Grant SP-60-AM-20593.
References
- 1.Acitores A, Gonzalez N, Sancho V, Valverde I, Villanueva-Penacarrillo ML. Cell signalling of glucagon-like peptide-1 action in rat skeletal muscle. J Endocrinol. 2004;180:389–398. doi: 10.1677/joe.0.1800389. [DOI] [PubMed] [Google Scholar]
- 2.Ahren B. Glucagon-like peptide-1 (GLP-1): a gut hormone of potential interest in the treatment of diabetes. Bioessays. 1998;20:642–651. doi: 10.1002/(SICI)1521-1878(199808)20:8<642::AID-BIES7>3.0.CO;2-K. [DOI] [PubMed] [Google Scholar]
- 3.Alcantara AI, Morales M, Delgado E, Lopez-Delgado MI, Clemente F, Luque MA, Malaisse WJ, Valverde I, Villanueva-Penacarrillo ML. Exendin-4 agonist and exendin(9–39)amide antagonist of the GLP-1(7–36)amide effects in liver and muscle. Arch Biochem Biophys. 1997;341:1–7. doi: 10.1006/abbi.1997.9951. [DOI] [PubMed] [Google Scholar]
- 4.Balkan B, Li X. Portal GLP-1 administration in rats augments the insulin response to glucose via neuronal mechanisms. Am J Physiol Regul Integr Comp Physiol. 2000;279:R1449–R1454. doi: 10.1152/ajpregu.2000.279.4.R1449. [DOI] [PubMed] [Google Scholar]
- 5.Blackmore PF, Mojsov S, Exton JH, Habener JF. Absence of insulinotropic glucagon-like peptide-I(7–37) receptors on isolated rat liver hepatocytes. FEBS Lett. 1991;283:7–10. doi: 10.1016/0014-5793(91)80541-a. [DOI] [PubMed] [Google Scholar]
- 6.Bode HP, Moormann B, Dabew R, Goke B. Glucagon-like peptide 1 elevates cytosolic calcium in pancreatic beta-cells independently of protein kinase A. Endocrinology. 1999;140:3919–3927. doi: 10.1210/endo.140.9.6947. [DOI] [PubMed] [Google Scholar]
- 7.Burcelin R, Da Costa A, Drucker D, Thorens B. Glucose competence of the hepatoportal vein sensor requires the presence of an activated glucagon-like peptide-1 receptor. Diabetes. 2001;50:1720–1728. doi: 10.2337/diabetes.50.8.1720. [DOI] [PubMed] [Google Scholar]
- 8.Campos RV, Lee YC, Drucker DJ. Divergent tissue-specific and developmental expression of receptors for glucagon and glucagon-like peptide-1 in the mouse. Endocrinology. 1994;134:2156–2164. doi: 10.1210/endo.134.5.8156917. [DOI] [PubMed] [Google Scholar]
- 9.D’Alessio D, Kahn SE, Leusner CR, Ensinck JW. Glucagon-like peptide 1 enhances glucose tolerance both by stimulation of insulin release and by increasing insulin-independent glucose disposal. J Clin Invest. 1994;93:2263–2266. doi: 10.1172/JCI117225. [DOI] [PMC free article] [PubMed] [Google Scholar]
- 10.D’Alessio D, Prigeon RL, Ensinck JW. Enteral enhancement of glucose disposition by both insulin-dependent and insulin-independent processes. A physiological role of glucagon-like peptide I. Diabetes. 1995;44:1433–1437. doi: 10.2337/diab.44.12.1433. [DOI] [PubMed] [Google Scholar]
- 11.Dardevet D, Moore MC, Neal D, DiCostanzo CA, Snead W, Cherrington AD. Insulin-independent effects of GLP-1 on canine liver glucose metabolism: duration of infusion and involvement of hepatoportal region. Am J Physiol Endocrinol Metab. 2004;287:E75–E81. doi: 10.1152/ajpendo.00035.2004. [DOI] [PubMed] [Google Scholar]
- 12.Deacon CF. Circulation and degradation of GIP and GLP-1. Horm Metab Res. 2004;36:761–765. doi: 10.1055/s-2004-826160. [DOI] [PubMed] [Google Scholar]
- 13.Deacon CF, Plamboeck A, Moller S, Holst JJ. GLP-1-(9–36) amide reduces blood glucose in anesthetized pigs by a mechanism that does not involve insulin secretion. Am J Physiol Endocrinol Metab. 2002;282:E873–E879. doi: 10.1152/ajpendo.00452.2001. [DOI] [PubMed] [Google Scholar]
- 14.Delgado E, Luque MA, Alcantara A, Trapote MA, Clemente F, Galera C, Valverde I, Villanueva-Penacarrillo ML. Glucagon-like peptide-1 binding to rat skeletal muscle. Peptides. 1995;16:225–229. doi: 10.1016/0196-9781(94)00175-8. [DOI] [PubMed] [Google Scholar]
- 15.Drucker DJ, Philippe J, Mojsov S, Chick WL, Habener JF. Glucagon-like peptide I stimulates insulin gene expression and increases cyclic AMP levels in a rat islet cell line. Proc Natl Acad Sci USA. 1987;84:3434–3438. doi: 10.1073/pnas.84.10.3434. [DOI] [PMC free article] [PubMed] [Google Scholar]
- 16.Feltrin KL, Little TJ, Meyer JH, Horowitz M, Smout AJ, Wishart J, Pilichiewicz AN, Rades T, Chapman IM, Feinle-Bisset C. Effects of intraduodenal fatty acids on appetite, antropyloroduodenal motility, and plasma CCK and GLP-1 in humans vary with their chain length. Am J Physiol Regul Integr Comp Physiol. 2004;287:R524–R533. doi: 10.1152/ajpregu.00039.2004. [DOI] [PubMed] [Google Scholar]
- 17.Fung LC, Chisholm C, Greenberg GR. Glucagon-like peptide-1-(7–36) amide and peptide YY mediate intraduodenal fat-induced inhibition of acid secretion in dogs. Endocrinology. 1998;139:189–194. doi: 10.1210/endo.139.1.5700. [DOI] [PubMed] [Google Scholar]
- 18.Galera C, Clemente F, Alcantara A, Trapote MA, Perea A, Lopez-Delgado MI, Villanueva-Penacarrillo ML, Valverde I. Inositol-phosphoglycans and diacyglycerol are possible mediators in the glycogenic effect of GLP-1(7–36)amide in BC3H-1 myocytes. Cell Biochem Funct. 1996;14:43–48. doi: 10.1002/cbf.639. [DOI] [PubMed] [Google Scholar]
- 19.Goke R, Conlon JM. Receptors for glucagon-like peptide-1(7–36) amide on rat insulinoma-derived cells. J Endocrinol. 1988;116:357–362. doi: 10.1677/joe.0.1160357. [DOI] [PubMed] [Google Scholar]
- 20.Gutniak M, Orskov C, Holst JJ, Ahren B, Efendic S. Antidiabetogenic effect of glucagon-like peptide-1 (7–36)amide in normal subjects and patients with diabetes mellitus. N Engl J Med. 1992;326:1316–1322. doi: 10.1056/NEJM199205143262003. [DOI] [PubMed] [Google Scholar]
- 21.Herrmann C, Goke R, Richter G, Fehmann HC, Arnold R, Goke B. Glucagon-like peptide-1 and glucose-dependent insulin-releasing polypeptide plasma levels in response to nutrients. Digestion. 1995;56:117–126. doi: 10.1159/000201231. [DOI] [PubMed] [Google Scholar]
- 22.Hsieh PS, Moore MC, Neal DW, Emshwiller M, Cherrington AD. Rapid reversal of the effects of the portal signal under hyperinsulinemic conditions in the conscious dog. Am J Physiol Endocrinol Metab. 1999;276:E930–E937. doi: 10.1152/ajpendo.1999.276.5.E930. [DOI] [PubMed] [Google Scholar]
- 23.Idris I, Patiag D, Gray S, Donnelly R. Exendin-4 increases insulin sensitivity via a PI-3-kinase-dependent mechanism: contrasting effects of GLP-1. Biochem Pharmacol. 2002;63:993–996. doi: 10.1016/s0006-2952(01)00924-8. [DOI] [PubMed] [Google Scholar]
- 24.Imeryuz N, Yegen BC, Bozkurt A, Coskun T, Villanueva-Penacarrillo ML, Ulusoy NB. Glucagon-like peptide-1 inhibits gastric emptying via vagal afferent-mediated central mechanisms. Am J Physiol Gastroin-test Liver Physiol. 1997;273:G920–G927. doi: 10.1152/ajpgi.1997.273.4.G920. [DOI] [PubMed] [Google Scholar]
- 25.Ionut V, Hucking K, Liberty IF, Bergman RN. Synergistic effect of portal glucose and glucagon-like peptide-1 to lower systemic glucose and stimulate counter-regulatory hormones. Diabetologia. 2005;48:967–975. doi: 10.1007/s00125-005-1709-3. [DOI] [PubMed] [Google Scholar]
- 26.Kieffer TJ, Habener JF. The glucagon-like peptides. Endocr Rev. 1999;20:876–913. doi: 10.1210/edrv.20.6.0385. [DOI] [PubMed] [Google Scholar]
- 27.Luque MA, Gonzalez N, Marquez L, Acitores A, Redondo A, Morales M, Valverde I, Villanueva-Penacarrillo ML. Glucagon-like peptide-1 (GLP-1) and glucose metabolism in human myocytes. J Endocrinol. 2002;173:465–473. doi: 10.1677/joe.0.1730465. [DOI] [PubMed] [Google Scholar]
- 28.Marquez L, Trapote MA, Luque MA, Valverde I, Villanueva-Penacarrillo ML. Inositolphosphoglycans possibly mediate the effects of glucagon-like peptide-1(7–36)amide on rat liver and adipose tissue. Cell Biochem Funct. 1998;16:51–56. doi: 10.1002/(SICI)1099-0844(199803)16:1<51::AID-CBF767>3.0.CO;2-T. [DOI] [PubMed] [Google Scholar]
- 29.Moore MC, Pagliassotti MJ, Swift LL, Asher J, Murrell J, Neal D, Cherrington AD. Disposition of a mixed meal by the conscious dog. Am J Physiol Endocrinol Metab. 1994;266:E666–E675. doi: 10.1152/ajpendo.1994.266.4.E666. [DOI] [PubMed] [Google Scholar]
- 30.Myers SR, McGuinness OP, Neal DW, Cherrington AD. Intraportal glucose delivery alters the relationship between net hepatic glucose uptake and the insulin concentration. J Clin Invest. 1991;87:930–939. doi: 10.1172/JCI115100. [DOI] [PMC free article] [PubMed] [Google Scholar]
- 31.Nakabayashi H, Nishizawa M, Nakagawa A, Takeda R, Niijima A. Vagal hepatopancreatic reflex effect evoked by intraportal appearance of tGLP-1. Am J Physiol Endocrinol Metab. 1996;271:E808–E813. doi: 10.1152/ajpendo.1996.271.5.E808. [DOI] [PubMed] [Google Scholar]
- 32.Nishizawa M, Moore MC, Shiota M, Gustavson SM, Snead WL, Neal DW, Cherrington AD. Effect of intraportal glucagon-like peptide-1 on glucose metabolism in conscious dogs. Am J Physiol Endocrinol Metab. 2003;284:E1027–E1036. doi: 10.1152/ajpendo.00503.2002. [DOI] [PubMed] [Google Scholar]
- 33.Nishizawa M, Nakabayashi H, Kawai K, Ito T, Kawakami S, Nakagawa A, Niijima A, Uchida K. The hepatic vagal reception of intraportal GLP-1 is via receptor different from the pancreatic GLP-1 receptor. J Auton Nerv Syst. 2000;80:14–21. doi: 10.1016/s0165-1838(99)00086-7. [DOI] [PubMed] [Google Scholar]
- 34.Orskov L, Holst JJ, Moller J, Orskov C, Moller N, Alberti KG, Schmitz O. GLP-1 does not not acutely affect insulin sensitivity in healthy man. Diabetologia. 1996;39:1227–1232. doi: 10.1007/BF02658511. [DOI] [PubMed] [Google Scholar]
- 35.Rask E, Olsson T, Soderberg S, Johnson O, Seckl J, Holst JJ, Ahren B. Impaired incretin response after a mixed meal is associated with insulin resistance in nondiabetic men. Diabetes Care. 2001;24:1640–1645. doi: 10.2337/diacare.24.9.1640. [DOI] [PubMed] [Google Scholar]
- 36.Ryan AS, Egan JM, Habener JF, Elahi D. Insulinotropic hormone glucagon-like peptide-1-(7–37) appears not to augment insulin-mediated glucose uptake in young men during euglycemia. J Clin Endocrinol Metab. 1998;83:2399–2404. doi: 10.1210/jcem.83.7.4988. [DOI] [PubMed] [Google Scholar]
- 37.Sandhu H, Wiesenthal SR, MacDonald PE, McCall RH, Tchipashvili V, Rashid S, Satkunarajah M, Irwin DM, Shi ZQ, Brubaker PL, Wheeler MB, Vranic M, Efendic S, Giacca A. Glucagon-like peptide 1 increases insulin sensitivity in depancreatized dogs. Diabetes. 1999;48:1045–1053. doi: 10.2337/diabetes.48.5.1045. [DOI] [PubMed] [Google Scholar]
- 38.Satake S, Moore MC, Igawa K, Converse M, Farmer B, Neal DW, Cherrington AD. Direct and indirect effects of insulin on glucose uptake and storage by the liver. Diabetes. 2002;51:1663–1671. doi: 10.2337/diabetes.51.6.1663. [DOI] [PubMed] [Google Scholar]
- 39.Thorens B. Expression cloning of the pancreatic β-cell receptor for the glucoincretin hormone glucagon-like peptide 1. Proc Natl Acad Sci USA. 1992;89:8641–8645. doi: 10.1073/pnas.89.18.8641. [DOI] [PMC free article] [PubMed] [Google Scholar]
- 40.Trapote MA, Clemente F, Galera C, Morales M, Alcantara AI, Lopez-Delgado MI, Villanueva-Penacarrillo ML, Valverde I. Inositolphosphoglycans are possible mediators of the glucagon-like peptide 1 (7–36)amide action in the liver. J Endocrinol Invest. 1996;19:114–118. doi: 10.1007/BF03349846. [DOI] [PubMed] [Google Scholar]
- 41.Valverde I, Merida E, Delgado E, Trapote MA, Villanueva-Penacarrillo ML. Presence and characterization of glucagon-like peptide-1(7–36) amide receptors in solubilized membranes of rat adipose tissue. Endocrinology. 1993;132:75–79. doi: 10.1210/endo.132.1.8380388. [DOI] [PubMed] [Google Scholar]
- 42.Vella A, Shah P, Basu R, Basu A, Holst JJ, Rizza RA. Effect of glucagon-like peptide 1(7–36) amide on glucose effectiveness and insulin action in people with type 2 diabetes. Diabetes. 2000;49:611– 617. doi: 10.2337/diabetes.49.4.611. [DOI] [PubMed] [Google Scholar]
- 43.Villanueva-Penacarrillo ML, Alcantara AI, Clemente F, Delgado E, Valverde I. Potent glycogenic effect of GLP-1(7–36)amide in rat skeletal muscle. Diabetologia. 1994;37:1163–1166. doi: 10.1007/BF00418382. [DOI] [PubMed] [Google Scholar]
- 44.Villanueva-Penacarrillo ML, Delgado E, Trapote MA, Alcantara A, Clemente F, Luque MA, Perea A, Valverde I. Glucagon-like peptide-1 binding to rat hepatic membranes. J Endocrinol. 1995;146:183–189. doi: 10.1677/joe.0.1460183. [DOI] [PubMed] [Google Scholar]
- 45.Wang Y, Kole HK, Montrose-Rafizadeh C, Perfetti R, Bernier M, Egan JM. Regulation of glucose transporters and hexose uptake in 3T3-L1 adipocytes: glucagon-like peptide-1 and insulin interactions. J Mol Endocrinol. 1997;19:241–248. doi: 10.1677/jme.0.0190241. [DOI] [PubMed] [Google Scholar]
- 46.Yang H, Egan JM, Wang Y, Moyes CD, Roth J, Montrose MH, Montrose-Rafizadeh C. GLP-1 action in L6 myotubes is via a receptor different from the pancreatic GLP-1 receptor. Am J Physiol Cell Physiol. 1998;275:C675–C683. doi: 10.1152/ajpcell.1998.275.3.C675. [DOI] [PubMed] [Google Scholar]