

Abstract
Costimulatory ligands, CD80 and CD86 have different binding preferences and affinities to their receptors CD28 and CTLA-4. Earlier, we demonstrated that CD80 binds to CTLA-4 with higher affinity and has a role in suppressing T cell response. The current study demonstrates that blockade of CD86 upon antigen presentation by bone marrow derived dendritic cells to OVA specific T cells resulted in not only induction of hyporesponsive T cells, but also these T cells could also suppress the proliferative response of effector T cells. These T cells showed TGF-β1 on their surface, and secreted TGF-β1 and IL-10 upon restimulation. While blockade of CTLA-4 and neutralization of IL-10 profoundly inhibited the induction of these TGF-β1+ T cells, their ability to suppress the effector T cell proliferation was abrogated by neutralization of TGF-β1 alone. Interestingly, induction of TGF-β1+ and IL-10+ T cells was found to be independent of natural CD4+CD25+ Tregs demonstrating that preferential ligation of CTLA-4 by CD80 induced IL-10 production by effector T cells, which in turn promoted the secretion of TGF-β1. Importantly, treatment of pre-diabetic NOD mice with islet β-cell antigen pulsed CD86−/− DCs, but not CD80−/− DCs, resulted in the induction of TGF-β1 and IL-10 producing cells, significant suppression of insulitis, and delay the onset of hyperglycemia. These observations demonstrate that CD80 not only preferentially binds to CTLA-4, but that interaction during antigen presentation can result in IL-10 dependent TGF-β1+ Tregs induction reinstating the potential of approaches to preferentially engage CTLA-4 through CD80 during self-antigen presentation in suppressing autoimmunity.
Keywords: T cells, co-stimulation, CD80, CD86, CTLA-4, regulatory T cells, tolerance, dendritic cells, Type 1 diabetes
Introduction
The co-stimulatory signal, which is essential for primary T cell activation, is delivered via CD28 when it interacts with its ligands, CD80 (B7.1) and CD86 (B7.2) on the surface of APCs. Ligation of CD28 by CD80 or CD86 in the presence of TCR engagement results in T cell proliferation and increased IL-2 production (1). T cells activated in the absence of co-stimulation through CD28 may become anergic to antigens or undergo apoptosis (2,3). Cytotoxic T lymphocyte antigen 4 (CTLA-4), a CD28 homologue, binds to the same ligands as CD28. In contrast to CD28, CTLA-4 restricts T cell activation by inhibiting IL-2 production, IL-2 receptor expression, and cell cycle progression (4). Mice that lack CTLA-4 suffer from lymphoproliferative disorders and die within 4 weeks of age (5). In spite of these differences in their functional properties, both CD28 and CTLA-4 share the ligands CD80 and CD86.
Although, it is generally believed that CD80 and CD86 are functionally identical co-stimulatory ligands with difference in kinetics of expression, several reports suggest that these ligands have preferences in terms of the type of T cell response they induce (6-8). Recent years have seen considerable efforts to understand the structures and biophysical interactions of these ligands with their receptors. It has been shown that CD28 and CTLA-4 have different affinities for their ligands (9-11). While CTLA-4 has about a 100 fold higher affinity for the ligand compared to CD28, the differences between CD80 and CD86 are not clearly understood. It has been shown that CD86 has faster association and dissociation rates with its receptors compared to CD80, possibly due to the ability of CD80 to exist in a dimeric state (10,11). Earlier, we have shown that the avidity of CTLA-4 binding to CD80 is significantly higher than that of CD86 suggesting that CD80 is a preferential ligand for CTLA-4 (12). Our report also revealed that T cell stimulatory properties of CD80 and CD86 are different and indicated a role for their immunoglobulin-like constant domains in this difference. Importantly, recent reports have shown that CD80 and CD86 have the ability to differentially recruit CTLA-4 and CD28 to the T cell surface and influence T cell differentiation (13). This study also demonstrated that CD80 is the major ligand involved in mediating CTLA-4 localization, while CD86 is the preferential ligand for CD28 recruitment to the synapse.
Based on these observations, it can be speculated that CD80 could be the preferential ligand for CTLA-4. If that is the case, it is possible that dominant engagement of CTLA-4 by CD80 can not only result in the down-regulation of effector T cell response, but also affect the T cell function. Recently, we observed that enhanced engagement of CTLA-4 in the immune synapse by an agonistic antibody could induce IL-10 and TGF-β1 responses, and result in the generation of Foxp3+ and TGF-β1+ adaptive regulatory T cells (Tregs) (14,15). Hence, we hypothesized that if CD80 is the preferential ligand of CTLA-4, then T cells activated in the absence of, or reduced levels of, CD86 may show similar cytokine and adoptive Treg responses.
In this study, we show that dominant co-stimulation through CD80 can result in the induction of TGF-β1+ adaptive Tregs. Our results also demonstrate that this effect is due to the dominant engagement of CTLA-4 by CD80 and that the induction of TGF-β1 release is dependent on IL-10. These observations were further substantiated by the suppression of ongoing autoimmune response and delay in the onset of hyperglycemia in NOD mice by islet β-cell antigen loaded CD86 deficient DCs.
Materials and methods
Mouse strains
Six to eight week-old female wild-type Balb/c and NOD/Ltj mice, NOD-CD80−/−, NOD-CD86−/− and NOD-CD80−/−/86−/− mice, and NOD.BDC2.5 TCR-transgenic (TCR-Tg) mice were purchased from the Jackson Laboratory (Bar Harbor, ME). These NOD-CD80−/−, NOD-CD86−/− and NOD-CD80−/−/86−/− mice have been described in earlier studies (16,17). All animal studies were approved by the animal care and use committee of the University of Illinois at Chicago.
Cell lines, antigens and antibodies
Hamster anti-mouse CD80 (16−10A1), rat anti-mouse CD86 (GL1), hamster anti-mouse CTLA-4 (clone: UC10−4-F-10−11) hybridomas were purchased from American Type Culture Collection (Manassas, VA). Hybridomas were grown in complete DMEM medium with 10% FBS or serum free/protein free medium (BD Biosciences, San Diego, CA). Antibodies were purified from the spent medium using Protein L or Protein A (Sigma-Aldrich, St. Louis, MO) affinity columns, concentrated, and dialyzed against PBS. Purified hamster IgG and rat IgG were purchased from Fitzgerald International (Concord, MA) and used as isotype control Abs. Antigen binding efficiencies of purified antibodies were tested by ELISA using recombinant mouse B7.1-Ig, B7.2-Ig, and CTLA-4-Ig as antigens (R&D systems, Minneapolis, MN). FAb fragments of different Abs were prepared and purified using FAb fragmentation kit (Pierce, Rockford, IL).
Type VI chicken OVA and LPS from Salmonella enterica were purchased from Sigma-Aldrich (St Louis, MO). Immunodominant β cell antigen peptides (viz., 1. Insulin B(9−23), 2. GAD65(206−220), 3. GAD65(524−543), 4. IA-2beta(755−777) and 5. IGRP(123−145)) and BDC2.5 peptide (YVRPLWVRME) were custom synthesized (Genescript Inc), pooled at an equal molar ratio, and used as described in our earlier study(18). Recombinant mouse GM-CSF and IL-4 were purchased from Biosource. Purified anti-mouse-TGF-β1 (clone: A75−2), anti-CD16/CD32 (FC block) Abs; FITC-conjugated anti-mouse CD11c, CD4, CD25, IL-10 Abs and streptavidin; PE-labeled anti-mouse CD80, CD86, CD40, I-Ad, I-Ak ( which cross reacts with I-Ag7), CD4, CD25, CTLA-4, CD28, CD62L, CD69, Foxp3, and streptavidin; biotin labeled anti-mouse/human TGF-β1 (clone A-75−3) and anti-LAP (TGF-β1) affinity purified Ab; PE-cy5 labeled anti-mouse CD62L Abs and streptavidin; PE-TR labeled anti-mouse CD4 Ab; and different fluorochrome labeled isotype control Abs (Caltag Laboratories, BD Biosciences, eBiosciences, R&D Systems, and Biolegend Laboratories) were used for FACS analysis.
Neutralizing Ab to mouse IL-10 (rat IgG1; clone JES5−2A5) and TGF-β1 (rat IgG1; clone 1D11), and normal rat IgG1 isotype control Ab were purchased from E-bioscience and R&D Systems. Magnetic bead-conjugated anti-PE, anti-biotin antibodies, total T cell, CD4+CD25+ T cell and CD4+ T cell isolation kits (Miltenyi Biotec) were used for enriching or depleting T cell subpopulations. Multiplex reagents, and paired antibodies and standards for ELISA to detect TGF-β1, TNF-α, IL-10, IL-12, IL-1β, and IL-6 were purchased from R&D system, Biosource, BD Biosciences, and eBiosciences.
Priming mice with antigens
Wild-type Balb/c mice were i.v. injected with 50μg of OVA and 5 μg LPS at least 10 days prior to use in experiments. Spleen cells from these OVA primed mice were used throughout the study to examine the differences in the co-stimulatory properties of CD80 and CD86 on antigen specific effector/memory T cells. In some experiments, spleen cells from BDC2.5-peptide primed NOD.BDC2.5 TCR-Tg mice were used.
BM derived dendritic cells (BMDCs) and T cell subpopulations
Bone marrow (BM) cells were cultured in complete RPMI 1640 medium containing 10% heat-inactivated FBS in the presence of 20 ng/ml GM-CSF for 2 days and for further 3 days in fresh complete RPMI 1640 medium containing 20 ng/ml GM-CSF and 5 ng/ml IL-4. On day 5, fresh medium containing GM-CSF (5 ng/ml), IL-4 (2 ng/ml) and LPS (1 μg/ml) was added and the non-/loosely-adherent cells from 6-day cultures were used. Activation markers (CD80, CD86, CD40 and MHC II) on LPS treated DCs were tested by FACS before use. Secreted cytokines in the final 24 h culture supernatants were tested by ELISA method.
Total T cells, CD4+, CD4+CD25−, and TGF-β1+ T cell subpopulations were isolated using appropriate kits and magnetic separation columns according to the manufacturer's (Miltenyi Biotec) directions. Isolated cells were washed, stained with FITC- or PE-labeled appropriate Abs, and tested for purity by FACS (FACSCalibur; BD Biosciences) before use.
In vitro antigen presentation assays
OVA pulsed (20 μg/1×106 cells/ml for 2 h at 37°C) BMDCs were plated in triplicate in 96-well flat-bottom tissue culture plates (1× 10⁵ cells/well) along with purified T cells (5 × 10⁵/well) from OVA primed mice in RPMI 1640 medium containing 2% normal mouse serum (NMS) at a final volume of 0.25 ml/well. Isotype control antibodies (rat IgG or hamster IgG), anti-CD80 and/or anti-CD86 Abs (10 μg/ml) were added to some assay wells. In some assays, anti-CTLA-4 or isotype control FAb fragment (2.5 μg/ml), neutralizing anti-mouse IL-10 (1 μg/ml), anti-mouse TGF-β1 (1μg/ml), or isotype-matched control Abs were added to some sets of assay wells. In some assays, BMDCs generated from wild-type NOD/Ltj, NOD-CD80−/−, NOD-CD86−/− and NOD-CD80−/−/86−/− mice were pulsed with BDC2.5 peptide (1 μg/ml/1×106 cells for 2 h at 37°C), cultured with CFSE labeled CD4+ T cells from NOD.BDC2.5 TCR-Tg mice for 5 days. Cytokine profile and T cell phenotypes were examined as described below.
Cells were labeled with CFSE as described earlier (18). CFSE labeled cells were cultured as described above. On day 5, to test for CFSE dilution, cells from these cultures were collected, stained with PE labeled Abs to CD4 or CD8, and analyzed by FACS. Unlabeled cells, that were cultured as described above, were washed on day 5 using complete RPMI 1640 medium maintained for an additional 48 h at 37°C to bring down the activation related markers to basal levels. These cells were analyzed by FACS, or used for secondary stimulation, and co-culture.
FACS analysis
Freshly isolated and ex vivo cultured spleen and LN cells were washed using PBS supplemented with 2% FBS and 10 mM EDTA (pH 7.4) and blocked with anti-CD16/CD32 Fc block Ab on ice for 15 min. For surface staining, cells were incubated with FITC-, PE-, and PECy5 or PE-TR-labeled appropriate antibodies in different combinations on ice for 30 min and washed thrice before analysis. For intracellular staining, surface stained cells were fixed and permeablized using fixation/permeablization reagent kits by following manufacturer's instructions, incubated with fluorochrome labeled appropriate Abs, and washed thrice prior to analysis. Stained cells were acquired using FACS-Calibur or LSR (BD Biosciences) flow-cytometers, and the data were analyzed using WinMDI or Weasel application. Cells were also stained using isotype-matched control Abs and considered as background controls. Specific regions were marked, and the gates and quadrants were set while analyzing the data based on these isotype control antibody background staining. At least 10,000 cells were analyzed in each experiment.
Cytokine analysis
Cell-free supernatants collected after 24 h DC cultures, and at different time-points from T cell cultures were tested for cytokine levels by ELISA or Luminex multiplex assays. ELISA or luminex assay was carried out for detecting IL-2, IL-4, IL-10, IFN-γ, TGF-β1, TNF-α, IL-10, IL-12, IL-1β, and IL-6. ELISA was carried out using paired Abs and standards according to the manufacturer's directions. Multiplex assay was carried out as per the manufacturer's directions and the data were acquired and analyzed using a luminex-100 instrument and application from Biorad. The amount of a particular cytokine was determined using an appropriate cytokine-specific standard curve.
Re-stimulation and co-culture assays
Cells from in vitro primary cultures were collected, non- T cells were excluded using total T cell or CD4+ T cell isolation (negative selection) reagents. For some assays, TGF-β1+ population was cells were enriched from these CD4+ T cells using anti-TGF-b1-biotin, streptavidin-PE, and anti-PE-Ab linked magnetic beads. Purified cells were mixed with CFSE labeled effector T cells from OVA primed mice at a 1:1 ratio. These mixtures or individual cell populations were used in T cell proliferation assays (total of 0.6×10⁵ cells/well; 0.25×10⁵ effector T cells, 0.25×10⁵ suppressor cells, and 0.1×10⁵ APCs) that were conducted either in the presence or in absence of OVA. After 5 days, cells were stained with PE labeled anti-CD4 Ab and tested for CFSE dilution in cells gated for CFSE+CD4+ or CFSE+CD8+ population by FACS. Supernatants collected from these cultures after 48 h were tested for cytokines as described above.
Treatment of NOD mice with DCs
DCs were generated from the BM cells of wild type, CD80−/−, CD86−/− and CD80−/−/86−/− NOD mice, and pulsed with a pool of 5 β cell specific immunodominant peptides (insulin beta(9−23), 2. GAD65(206−220), 3. GAD65(524−543), 4. IA-2beta(755−777), and 5. IGRP-3(123−145)) and activated using LPS (1μg/1×106 cells/ml) for 24 h. Cells were washed and injected i.v. into 8 weeks old NOD mice (2×10⁶ cells/mouse) twice at a 15-day interval. These mice were monitored for glucose levels every 7 days. Sets of euglycemic mice were sacrificed on day 30 post-2nd injection with DCs, or upon termination of the experiment, tested for T cell phenotypes and function ex vivo. Paraffin sections of pancreatic tissues were stained with hematoxylin/eosin and examined for cellular infiltration.
Histochemical analysis of pancreatic tissues
Pancreata were fixed in 10% formaldehyde, 5-μm paraffin sections were made, and stained with hematoxylin and eosin (H&E). Stained sections were analyzed in a blinded fashion, using a grading system, in which 0 = no evidence of infiltration, 1 = peri-islet infiltration, 2 = 25%, 3 = >25−50% infiltration, 4 = >50% infiltration of each islet, and 5 = complete loss or only remnants of islets seen as described earlier (18). About 100 islets were examined for each group.
Statistical analysis
Mean, SD, and statistical significance (p value) were calculated using Microsoft Excel or SSPS statistical application. In most cases, values of test groups (cells cultured in the presence of blocking antibodies, or knockout DC injected mice) were compared with that of control group (cells cultured in the presence of isotype control antibody, or wild-type DC injected mice) unless specified. A p value of ≤0.05 was considered significant.
Results
Co-stimulation by CD80 and CD86 results in differential T cell proliferative response
To examine the consequence of CD80 and CD86 blockade during antigen presentation, in vitro antigen (OVA) presentation assays were carried out using BMDCs and effector T cells from OVA primed mice. These LPS activated DCs that expressed significant levels of activation markers including CD80 and CD86 and produced cytokines such as TNF-α, IL-12, and IL-1β (Fig. 1A) were used as APCs. Blockade of CD80 and CD86 individually using blocking Abs during OVA presentation to effector T cells from OVA primed mice resulted in more or less similar number of T cells expressing early activation marker CD69 at the 16 h time-point (Fig. 1B). Levels of expression of both CD28 and CTLA-4 on T cells stimulated in the presence of CD80 and CD86 blocking Abs at different time-points remained unaltered among different groups during T cell activation (not shown). However, blockade of co-stimulation through CD86 led to a significantly lower proliferative response (p=0.019) by T cells against OVA compared to controls as indicated by the percentage of CD4+ T cells with CFSE dilution on day 5 (Fig. 1C). In contrast, blockade of co-stimulation through CD80 resulted in a marginally elevated T cell proliferative response compared to control. As anticipated, blockade of CD80 and CD86 simultaneously resulted in the suppression of early activation markers and proliferative response of T cells against OVA.
FIGURE 1.

Preferential co-stimulation through CD80 and CD86 upon antigen presentation results in difference in proliferative responses by effector T cells. DCs generated in vitro from BM cells using GM-CSF and IL-4, and exposed to bacterial LPS (1 μg/ml) for 24 h were used as antigen presenting cells. A) These DCs were tested for activation markers by FACS (left panel), and cytokine production in the culture supernatants upon 24 h LPS activation by luminex multiplex assay (right panel). For FACS analysis, cells were stained using FITC labeled anti-mouse CD11c Ab and PE- labeled anti-mouse CD80, CD86 CD40 or I-Ad Ab. CD11c+ Cells were gated for the graphs shown. Thin-line and thick-line histograms indicate isotype control Ab and marker specific Ab staining respectively. Purified splenic CD4+ T cells from OVA primed mice were incubated with OVA pulsed BMDCs in the presence of anti-mouse CD80 and CD86 blocking Abs individually or in combination. B) After 16 h, early activation marker (CD69) was examined on CD4+ T cells from these cultures by staining with fluorochrome labeled anti-CD4 and CD69 Abs followed by FACS. E) CFSE labeled CD4+ T cells stimulated similarly using OVA pulsed BMDCs for 5 days were tested for CFSE dilution by FACS following staining with PE-labeled anti-CD4 Ab. CD4+ T cells were gated for panels B and C. These assays were repeated 4 times in triplicate with similar results. * indicates a p value of <0.05. Varying concentrations of blocking Abs were used in the initial assays; however, results from the assay using saturating concentration (10 μg/ml) of Abs are shown throughout.
Preferential co-stimulation by CD80 induces high IL-10, but low IFN-γ, response by T cells
To examine the cytokine profile of T cells that received dominant co-stimulation by either CD80 or CD86, 36 h spent media from CD80 and CD86 blockade cultures were tested for IL-2, IL-4, IL-10, IFN-γ, and TGF-β1 by luminex multiplex assay or ELISA. As shown in Fig. 2, suppressed CD86 co-stimulation resulted in significantly reduced IFN-γ and IL-2, but increased IL-10 and IL-4, responses by T cells as compared to controls. In contrast, blockade of co-stimulation by CD80 resulted in considerably enhanced IFN-γ and IL-2, but significantly diminished IL-10, responses. However, 36 h cultures did not show significant levels of TGF-β1 in the presence of any of the blocking Abs (data not shown). These results show that preferential co-stimulation by either CD80 or CD86 can influence the levels and types of cytokines produced by effector T cells.
FIGURE 2.

Preferential co-stimulation by CD80 and CD86 induces different cytokine profiles by effector T cells. Co-stimulation blockade assay was carried as described for Fig 1. Supernatants collected from 36 h cultures were tested for cytokines by luminex multiplex assay. Mean±SD of values from three individual experiments carried out in triplicate are shown. This assay was repeated 4 times with similar results. * indicates a p value of <0.05.
Co-stimulation by CD80 leads to the induction of hyporesponsive T cells
Next, we tested T cells from CD80 and CD86 blockade cultures for their ability to respond to challenge exposure to OVA. Cells from 5-day old primary cultures were washed, CD4+ T cell fraction was enriched by magnetic sorting, labeled with CFSE, and stimulated for additional 5 days using OVA pulsed APCs (spleen cells depleted of T cells), and tested for CFSE dilution. T cells from primary cultures containing control Ab or anti-CD80 Ab, but not anti-CD86 Ab showed significant proliferation (Fig 3A) upon re-exposure to OVA. However, T cells from cultures containing anti-CD86 Ab (CD86 blockade culture) not only showed lower pro-inflammatory cytokine responses compared to T cells from anti-CD80 Ab (CD80 blockade) or control Ab containing cultures, and produced higher levels of suppressor cytokines, IL-10 and TGF-β1 (lower panels of Fig 3B). As expected, T cells from cultures where both CD80 and CD86 were blocked were also less responsive to challenge with OVA, and produced significantly lower levels of both inflammatory and suppressor cytokines.
FIGURE 3.

Dominant co-stimulation by CD80 results in the generation of hyporesponsive T cells with regulatory function. Co-stimulation blockade assay was carried out as described for Fig. 1 with or without anti-CD80 and/or anti-CD86 Ab. On day 5, CD4+ T cells from these primary cultures were obtained using magnetic bead based negative selection kit, and used in the following experiments. A) Cells were labeled with CFSE, incubated with OVA pulsed APCs for additional 5 days, stained with PE-labeled anti-CD4 Ab and tested for CFSE dilution by FACS. B) Culture supernatants from assay A were tested for cytokines by Luminex multiplex and ELISA assays. CD4+ T cells were gated for panels A and representative values are shown. Mean±SD of values from three individual experiments carried out in triplicate are shown for panel B. This assay was repeated at least 4 times with similar results. * indicates a p value of <0.05.
Hyporesponsive T cells generated upon co-stimulation by CD80 suppress effector T cell response
Next, we examined whether T cells obtained from the CD80 and CD86 blockade cultures can influence OVA specific response of fresh effector T cells upon challenge exposure to antigen. Purified T cells from OVA-primed mice were labeled with CFSE, stimulated with OVA-pulsed APCs in the presence of purified CD4+ T cells from CD80 and CD86 blockade cultures. As observed in Fig. 4, T cells obtained from control or CD80 blockade culture had no significant effect on OVA specific proliferation of effector T cells. In contrast, CD4+ T cells obtained from CD86 blockade culture showed a significant suppressive effect on both CD4+ and CD8+ T cell proliferation. Notably, CD4+ T cells obtained from the cultures where both CD80 and CD86 were blocked showed no profound effect on effector T cell proliferation. These observations show that while effector T cells from CD86 blockade culture could acquire suppressor T cell function, cultures where both CD80 and CD86 were blocked, in spite of their hyporesponsiveness to OVA challenge (as shown in Fig. 3A), did not acquire suppressor function.
FIGURE 4.

Hyporesponsive T cells generated upon co-stimulation by CD80 exhibit regulatory properties. Co-stimulation blockade assay was carried out as described for Fig. 1. CD4+ T cells from this culture were incubated with OVA pulsed APCs and CFSE labeled total T cells from OVA primed mice (effector cells) for additional 5 days, stained with PE labeled anti-CD4 or CD8 Abs, and examined for CFSE dilution in effector populations. Representative values are shown. This assay was repeated at least 4 times with similar results. * indicates a p value of <0.05.
Hyporesponsive T cells in the CD86 blockade culture are primarily TGF-β1+ T cells and their induction is IL-10 dependent
Next, we examined the CD80 and CD86 blockade cultures for the presence of T cells with regulatory phenotype. Cells from these cultures were washed and rested for 48 h to bring the expression of activation related markers to basal levels. These T cells were tested for surface CD25, and intracellular Foxp3 and CTLA-4 expression levels by FACS. Fig. 5A demonstrates that T cells from CD86 blockade culture showed no increase in Foxp3 or CTLA-4 expressing CD25+ or CD25− T cell frequencies compared to control or CD80 blockade cultures. We then tested T cells from these co-stimulation blockade cultures for surface-bound latency associated peptide (LAP) and active forms of TGF-β1 by FACS. As observed in Fig 5B, a significant number of T cells from CD86 blockade culture demonstrated surface bound active TGF-β1 at the resting stage compared to T cells from control or CD80 blockade cultures. However, detectable level of LAP was not found on CD4+ T cells from either CD80 or CD86 blockade culture (not shown).
FIGURE 5.
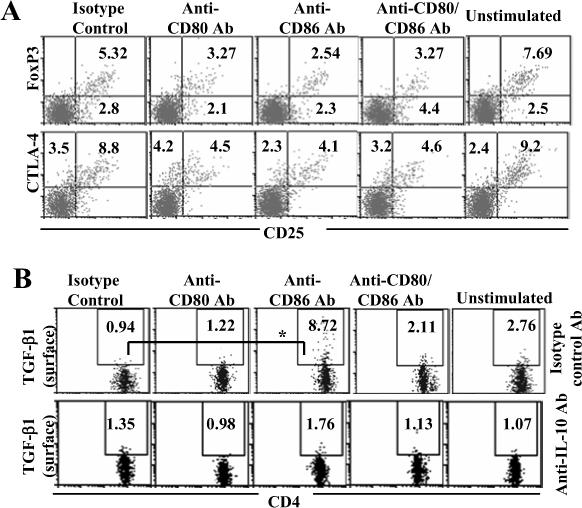
TGF-β1+ T cells, but not CD25+ or Foxp3+ T cells, are induced upon dominant co-stimulation by CD80. Co-stimulation blockade cultures were carried out as described in Fig 1. On day 5, cells from these primary cultures were washed, incubated with fresh medium for additional 48 h. A) These cells were stained for surface CD4 and CD25, and intracellular Foxp3 and CTLA-4, and analyzed by FACS. B) Purified CD4+ T cells from OVA primed mice were cultured as described above in the presence of additional antibodies (isotype control or neutralizing Ab against IL-10). Cells from these cultures were washed on day 5, cultured for an additional 48 h, and tested for CD4+ T cells positive for surface TGF-β1 by FACS. Samples were gated for CD4+ population for the panels A and B. Frequencies of CD4+CD25+Foxp3+ and CD4+CD25+CTLA-4+ cells are shown in panel A and CD4+TGF-β+ cells in panel B. These assays were repeated 4 times in triplicate with similar results and representative values are shown. * indicates a p value of <0.05.
As mentioned above (Fig. 2), blockade of co-stimulation by CD86 did not result in the production of significant levels of TGF-β1 at the early stage (36 h). However, T cells from these cultures not only showed surface bound active TGF-β1 at later stages, but also secreted TGF-β1 upon restimulation with cognate antigen (as shown in Fig 3B). This suggested that IL-10 produced during the early stage of blockade of CD86 might have a role in inducing TGF-β1 production. To examine this possibility, anti-IL-10 neutralizing Ab was added to these costimulatory blockade cultures. Neutralization of IL-10 completely abolished the induction of TGF-β1+ T cells in the CD86 blockade culture (Fig 5B). This result shows that dominant CD80 mediated co-stimulation induced IL-10 is essential for inducing TGF-β1+ T cells.
TGF-β1 secretion by T cells upon CD86 blockade is a late response
To examine the timing of TGF-β1 induction upon dominant co-stimulation by CD80, supernatants obtained at different time-points from the CD86 blockade culture with or without IL-10 neutralizing Ab were examined for secreted TGF-β1 levels. As observed in Fig 6, significant levels of TGF-β1 were detected at 72 h and later time-points, subsequent to the time of IL-10 induction (within 36 h as shown Fig. 1C). However, IL-10 levels remained more or less same in the culture after 36 h (not shown). Neutralizing Ab against IL-10 could abolish TGF-β1 production by T cells from CD86 blockade culture, substantiating the role of IL-10 in triggering TGF-β1 production. Since resting T cells from CD86 blockade culture carried significant amounts of TGF-β1 on the surface (as observed in Fig 5B), T cells from 5 day old cultures were washed and rested for additional two days to examine for their resting stage TGF-β1 secretion, if any. As shown in Fig. 6, resting stage T cells obtained from CD86 blockade culture did not secrete significant levels of TGF-β1 (extreme right bars) suggesting that TGF-β1 on these T cells is retained on the surface for a relatively long time.
FIGURE 6.
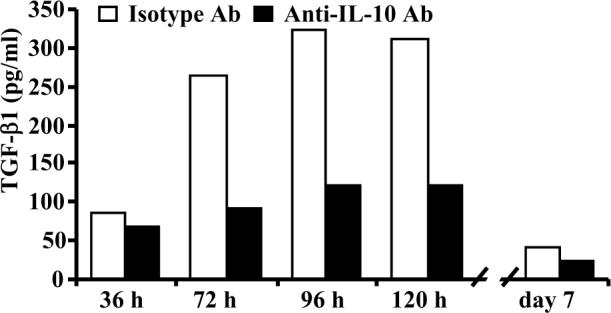
TGF-β1 secretion by T cells upon CD86 blockade is a late response. Costimulatory blockade cultures were carried out in the presence of anti-CD86 blocking Ab and anti-IL-10 neutralizing Ab as described for Fig 5B. Culture supernatants collected at different time points were tested for TGF-β1 by ELISA. This assay were repeated at least 4 times in triplicate with similar results and representative values are shown. * indicates a p value of <0.05.
CTLA-4 ligation by CD80 is responsible for the induction of IL-10 and TGF-β1 producing T cells
To examine whether CTLA-4 or CD28 ligation by CD80 is responsible for the IL-10 and TGF-β1 responses observed upon CD86 blockade, anti-CTLA-4 or Anti-CD28 FAb fragment was added to this culture. As observed in the lower panel of Fig. 7A, anti-CTLA-4 FAb profoundly suppressed the induction of T cells with surface bound TGF-β1 in CD86 blockade culture. Further, IL-10 response by T cells in these cultures was significantly lower as compared to T cells to which anti-CTLA-4 FAb was not added (Fig. 7B). Similarly, secreted TGF-β1 levels were also lower in these cultures at 96 h time-point (not shown). On the other hand, blockade of CD28 signaling in CD86 blockade culture resulted in significantly reduced T cell proliferation, pro-inflammatory and suppressor cytokine levels, an effect more or less similar to that noted upon simultaneous blockade of CD80 and CD86 (as observed in Figs 1, 2, 3, 4, 5) (not shown). These observations suggest that initial activation through CD28 signaling and the subsequent dominant engagement of CTLA-4 by CD80, in the presence of reduced co-stimulation by CD86, can induce IL-10 and TGF-β1 responses by T cells.
FIGURE 7.

TGF-β1+ T cells are induced as a result of dominant engagement of CTLA-4 by CD80. Co-stimulation blockade cultures were carried out as described for Fig. 1. In addition, these cultures were added with FAb fragments of isotype control or anti-CTLA-4 Ab. A) On day 5, cells from these cultures were washed, cultured for an additional 48 h, and tested for CD4+ T cells positive for surface TGF-β1 by FACS. Samples were gated for CD4+ population for the graphs shown here. Frequencies of CD4+TGF-β+ cells are shown. This assay was repeated 2 times in triplicate with similar results and representative values are shown. B) Supernatants collected from 48 h cultures were tested for IL-10 by ELISA. Mean±SD of triplicate values of 3 individual assays are shown. * indicates a p value of <0.05.
Neutralization of TGF-β1 reverses the suppressive function of T cells induced through dominant co-stimulation by CD80
Since T cells from CD86 blockade culture produced both suppressor cytokines IL-10 and TGF-β1 upon recall exposure to cognate antigen, the role of these cytokines in the suppression of effector T cell function was examined. While addition of neutralizing Ab to IL-10 showed only a minor reversal of effector T cell suppression induced by T cells from the CD86 blockade culture, neutralization of TGF-β1 restored the proliferative response of effector T cells completely (Fig. 8A; right panel). Similarly, neutralization of TGF-β1, but not IL-10, restored IL-2 and IFN-γ responses by effector T cells in assay wells where T cells obtained from CD86 blockade culture were used as suppressor cells (Fig. 8 B and C). In addition, although IL-10 is a dominant suppressor of proliferative, and IL-2 and IFN-γ responses of T cells, neutralization of IL-10 in the co-cultures where T cells from CD86 blockade culture were used as suppressor cells did not restore the effector T cell response significantly, perhaps due to dominant suppression of effector cells by TGF-β1.
FIGURE 8.

TGF-β1 plays a dominant role in the suppressive effect of T cells resulting from dominant co-stimulation by CD80. Co-stimulation blockade cultures were carried as described for Fig 1 for 5 days, CD4+ T cells were purified, and co-cultured with CFSE labeled CD4+ T cells from OVA primed mice and OVA pulsed APCs as described for Fig. 4. Isotype control, or neutralizing Abs against IL-10 or TGF-β1 were also added to these co-culture wells. A) Cells from these culture wells were stained for CD4 and the CFSE dilution pattern of effector T cell population was examined on day 5. B and C) Supernatants from above cultures were tested for IL-2 and IFN-γ by Luminex cytokine assay. D) Purified CD4+ T cells from CD86 blockade culture were further fractionated into TGF-β1+ and TGF-β1- rich populations based on the surface TGF-β1 level using anti-TGF-β1-biotin, streptavidin-PE and anti-PE Ab linked magnetic bead reagents (upper panel), co-cultured with effector T cells from OVA primed mice at 1:1 effector:Treg ratio along with OVA pulsed APCs and analyzed (lower panel) as described for Fig. 4. E) Total CD4+ T cells and enriched T cell populations (2.5 ×10⁵ T cells/well) were re-stimulated with OVA pulsed APCs and 36 h culture supernatants were tested for cytokines as described for Fig. 3. These assays were repeated 2−3 times in triplicate with similar results and representative values for panel A and D, and mean±SD values from three individual experiments carried out in triplicate for panels B, C and E are shown. * indicates a p value of <0.05.
To examine the role of T cells with surface bound TGF-β1 from CD86 blockade culture in suppressing the effector T cell response, TGF-β1+ T cells from this culture was enriched and tested in a co-culture assay as described above. As observed in Fig. 8D, TGF-β1+ T cells suppressed effector T cell proliferation profoundly compared to TGF-β1- or total CD4+ T cell populations. However, TGF-β1- cells retained significant ability to suppress the effector T cell response, and secreted significant amounts of TGF-β1 and IL-10 upon re-exposure to OVA (Fig. 8E). Considering the fact that more than 80% of the enriched cells carry TGF-β1 on the surface, their ability to secrete TGF-β1 appears to be relatively low. These results indicate that T cells with surface bound TGF-β1 are not the only suppressor T cell population in CD86 blockade culture, and TGF-β1 and/or IL-10 secreting cells may also be contributing to the regulatory function of T cells from this culture.
CD4+CD25+ T cells are not required for the induction of TGF-β1+ suppressor T cells
It has been suggested that TGF-β1 is primarily produced by CD4+CD25+ T cells (26,27). Therefore, co-stimulatory blockade assays were carried out using total CD4+ T cells and T cells that were depleted of CD25+ population (CD4+CD25− T cells) to examine the impact of natural CD4+CD25+ T cells on the induction of T cells with surface bound TGF-β1. As observed in Fig. 9, the majority of TGF-β1+ T cells induced in CD86 blockade cultures were CD25−. Importantly, depletion of CD25+ T cells from CD86 blockade culture had no effect on the overall frequencies of CD25-TGF-β1+ T cells (Fig. 9A, lower panel). In addition, both total CD4+ T cells and CD4+CD25− T cells produced significant amounts of IL-10 and TGF-β1, albeit relatively less by CD4+CD25− population compared to total T cells, upon antigen presentation in the presence of dominant co-stimulation by CD80 (not shown). Consistent with the results from Fig. 4, T cells isolated from CD86 blockade cultures of either total CD4+ or CD4+CD25− T cells suppressed OVA specific effector T cell response significantly (not shown). These observations suggest not only that naturally existing CD25+ Tregs are not essential for the induction of these adaptive Tregs, but also the primary source of TGF-β1 in the CD86 blockade culture appeared to be CD25− T cells themselves.
FIGURE 9.
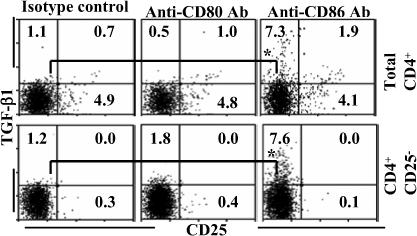
Natural CD4+CD25+ Tregs do not play a significant role in inducing adaptive Tregs with surface bound TGF-β1. CD4+ T cells or CD4+CD25− T cells were cultured in the presence of OVA pulsed BMDCs and blocking Abs as described for Fig. 1. On day 5, cells from these cultures were washed, cultured for an additional 48 h, and tested for CD4+ T cells positive for surface TGF-β1 by FACS after staining using fluorochrome labeled CD4, CD25 and TGF-β1 specific Abs. Samples gated for CD4+ population are shown. This assay was repeated 3 times in triplicate with similar results and representative values are shown. * indicates a p value of <0.05.
CD86−/− DCs are less efficient in inducing T cell proliferation, but induced TGF-β1 production
To further substantiate the results from CD80 and CD86 blockade, additional experiments were carried out using DCs from wild-type, CD80 and/or CD86 deficient non-obese diabetic (NOD) mice. BMDCs were generated from CD80−/−, CD86−/−, CD80/86−/− and wild-type NOD mice, pulsed with BDC2.5 peptide, and tested in an antigen presentation assay using CD4+ T cells from NOD.BDC2.5 TCR-transgenic (TCR-Tg) mice. While early activation (CD69 expression) of T cells upon antigen presentation in the presence of either CD80 or CD86, or both (wild-type) was not significantly different; as expected, antigen presentation in the absence of both CD80 and CD86 resulted in significantly reduced early activation of T cells at 16 h time-point (Fig 10A; upper panel). Antigen presentation by CD86 deficient DCs was relatively less efficient in inducing T cell proliferation and IFN-γ production as compared to T cells stimulated with wild-type or CD80 deficient DCs (Fig. 10A, lower panel, and Fig. 10B). However, significantly higher amounts of TGF-β1 and IL-10 were produced by T cells that were stimulated using CD86−/− DCs. Yet, unlike in the experiments described above using wild-type effector T cells from Balb/c mice, BDC2.5 TCR-Tg T cells did not show significant amount of surface bound TGF-β1 when cultured either with CD86 deficient DCs, or wild-type DCs treated with an anti-CD86 blocking Ab (not shown). Nevertheless, these results indicate that co-stimulation by CD80 in the absence of CD86 in NOD mice can result in the induction of TGF-β1 and IL-10 secreting T cells and may suppress autoimmunity.
FIGURE 10.
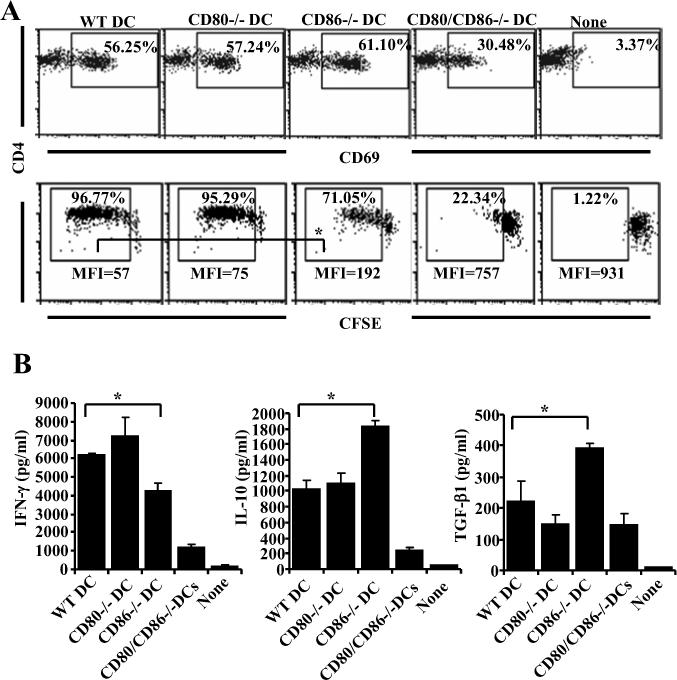
Antigen presentation by CD86−/− DCs induces IL-10 and TGF-β1 producing T cells. DCs were generated from BM of 8-week old wild-type, CD80−/−, CD86−/− and CD80/CD86−/− mice, pulsed with BDC2.5 peptides and incubated with purified CD4+ T cells from BDC2.5 peptide primed NOD.BDC2.5 TCR-Tg mice. A) After 16 h, early activation marker (CD69) was tested on CD4+ T cells from these cultures following staining with fluorochrome labeled anti-CD4 and CD69 Abs by FACS (upper panel). CFSE labeled CD4+ T cells stimulated similarly using peptide pulsed BMDCs for 5 days were tested for CFSE dilution by FACS after staining with PE-labeled anti-CD4 Ab (lower panel). B) Supernatants collected from 72 h cultures were tested for cytokines by luminex multiplex assay or by ELISA. CD4+ T cells were gated for panels A and B. Mean±SD of values from three individual experiments carried out in triplicate are shown for panel B. This assay was repeated 3 times in triplicate with similar results. * indicates a p value of <0.05.
Pancreatic β-cell antigen loaded CD86−/− DCs can delay onset of type 1 diabetes in NOD mice
To understand the effect of in vivo antigen presentation by DCs that express CD80 and CD86 individually on autoimmunity, BMDCs were generated from wild-type NOD mice, or CD80−/−, CD86−/−, or CD80/CD86−/− NOD mice, pulsed with islet β cell specific immunodominant peptides, and transferred into 8-week old wild-type NOD mice. As shown in Fig. 11, while mice that received wild-type or CD80−/− DCs showed earlier onset of hyperglycemia as compared to non-recipients. Recipients of CD86−/− DCs demonstrated a significant delay in the disease onset. As anticipated, mice that received CD80/CD86−/− DCs showed more prolonged euglycemia.
FIGURE 11.

β-cell antigen presentation by CD86−/− DCs delays the onset of hyperglycemia in NOD mice. DCs were generated from BM of 8-week old wild-type, CD80−/−, CD86−/− and CD80−/−CD86−/− mice, pulsed with immunodominant β cell peptides, injected i.v. into 7−8 week old NOD mice (2×10⁶ cells/mouse) twice at 15 day interval. A) Mice were bled every week for up to 16 weeks post-injection to monitor blood glucose levels. Mice that showed glucose levels >250 mg/dl for two consecutive weeks were considered diabetic. 10−12 mice were included in each group.
CD86−/− DCs induced hyporesponsive T cells in NOD mice
To examine the effect of self-antigen presentation along with dominant CD80 and CD86 mediated co-stimulation on T cells in vivo and on the progression of insulitis, NOD mice that received β cell peptide loaded wild-type, or CD80 and/or CD86−/− DCs were examined 4 weeks after the treatment. As observed in Fig 12A and B, mice that received CD86−/− or CD80/CD86−/− DCs appeared to have relatively less severe insulitis as compared to non-recipient, and wild-type and CD80−/− DC recipients. While majority of the islets in CD86−/− or CD80/CD86−/− DCs recipients had grade 1 infiltration, wild-type, and CD80−/− DC recipients showed grades 3−4 infiltration of lymphocytes in a significant number of islets.
FIGURE 12.
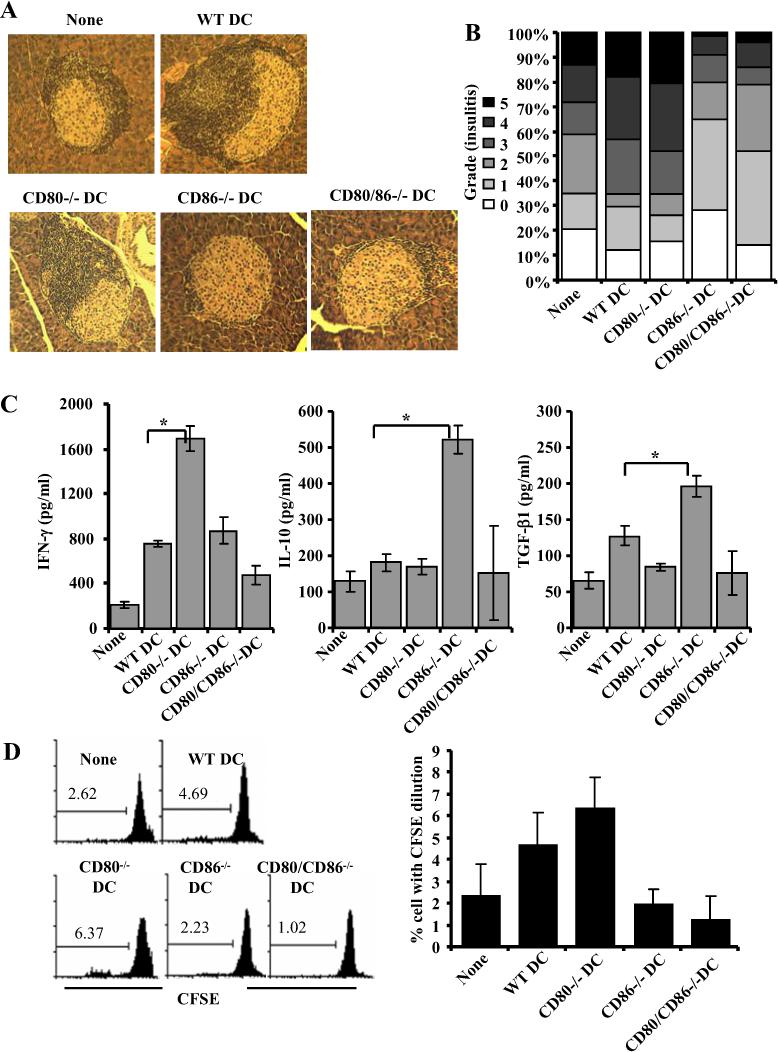
CD86−/− DCs suppress insulitis in NOD mice through induction of IL-10 and TGF-β1 producing T cells. BMDCs from wild-type, CD80−/−, CD86−/− and CD80−/−CD86−/− mice, pulsed with immunodominant β cell peptides, injected i.v. into 7−8 week old NOD mice (2×10⁶ cells/mouse) twice at 15 days interval. Sets of three recipient mice/group were examined for insulitis and T cell response 21 days after DC transfer. A and B) H&E stained pancreatic sections were examined in a blinded fashion and the severity of lymphocyte infiltration was scored as described in materials and methods. Representative islet is shown for each group (A). The percentages of islets with different levels of lymphocyte infiltration are shown (B). C) Spleen cells were incubated with immunodominant peptides, spent medium collected from 72 h cultures were tested for IFN-γ, IL-10 and TGF-β1 by multiplex assay or ELISA. Mean±SD values of cells from 3 mice tested in triplicate are shown. D) CFSE labeled spleen cells were incubated with immunodominant peptides for 5 days, CFSE dilution in CD4+ T cells was examined by FACS after staining using fluorochrome labeled CD4 specific Ab. Representative panels (left panel) and mean±SD (right panel) from assays carried out using three individual mice in triplicate are shown. * indicates a p value of <0.05.
Splenic CD4+ T cells from the above described DC recipient groups of mice were examined for surface bound TGF-β1. While there was no significant difference in the frequency of CD25+ T cells among control and DC recipients, considerably higher, but not statistically significant, number of TGF-β1+ T cells was detected in mice that received CD86−/− DCs (not shown). Importantly, ex vivo challenge of T cells with β cell immunodominant peptides resulted in significantly higher TGF-β1 and IL-10 responses by T cells from CD86−/− DC recipients. In contrast, T cells from CD80−/− DC recipients produced significantly higher IFN-γ response as compared to T cells from other groups of mice (Fig. 12C). Further, a significant number of CD4+ T cells from CD80−/− DC recipient mice proliferated in response to ex vivo antigen challenge as compared to T cells from mice that received CD86−/− DCs (Fig. 12D). Although CD80/CD86−/− DC recipients demonstrated less severe insulitis as compared to the control group, these mice did not show a significant increase in the number of TGF-β1+ T cells, or IFN-γ, IL-10 or TGF-β1 secretion, or T cell proliferative response upon exposure to immunodominant peptides. This suggests that the ability of CD86−/− and CD80/CD86−/−DCs to suppress insulitis and delay hyperglycemia are dependent on different mechanisms.
Discussion
Earlier studies including from our laboratory have demonstrated similarities and differences in the T cell co-stimulatory properties of CD80 and CD86 (12,13,19-21). We have shown that CD80 binds to CTLA-4 with higher avidity as compared to CD86 and plays an important role in regulating T cell response (12). Although earlier studies have shown that antigen presentation in the presence or absence of CD80 and CD86 can produce varying outcomes, the phenotype and function of T cells from these cultures were not well understood. Therefore, in this study, we examined the differences in the effects of co-stimulation by CD80 and CD86 on effector/memory T cells, and the functional properties of T cells resulting from dominant co-stimulation by CD80 or CD86. Here, we show that dominant interaction with CD80 on APCs in the absence, or reduced levels, of CD86 rendered T cell hypoproliferative.
We found differences between CD80 and CD86 in their abilities to elicit activation of antigen-specific T cells by BMDCs. Consistent with earlier reports (12,19-21), we observed that antigen presentation in the presence of blocking Ab against CD86, but not CD80, resulted in significantly lower effector T cell proliferation as compared to controls. In addition, while selective co-stimulation by CD86 resulted in a minor increase in IFN-γ and IL-2 responses by T cells, co-stimulation by CD80 resulted in significantly lower IFN-γ and IL-2, but enhanced IL-10 and IL-4 responses by T cells as compared to controls. This suggested that upon blockade of co-stimulation by CD86, CD80 predominantly engages CTLA-4 and suppresses IL-2 and IFN-γ responses, and enhances IL-10 response. It has been recently demonstrated that over-expression of CTLA-4 on human CD8+ T cells results in down-regulation of CD28 expression on the surface upon activation (22). However, our observation that CD4+ T cells co-stimulated preferentially either by CD80 orCD86, or both had comparable levels of CD28 and CTLA-4 on their surface (not shown). This suggested that dominant CD80 co-stimulation mediated suppression of proliferative and inhibitory cytokine responses is achieved perhaps through active engagement of CTLA-4, but not through reduced CD28 signaling.
T cells obtained from CD86 blockade culture appeared to be hyporesponsive in terms of their pro-inflammatory cytokine and proliferative responses. While antigen presentation in the presence of IL-10 or by IL-10 exposed DCs are known to induce TGF-β1 producing T cells, TGF-β1 is known to induce Foxp3+ and IL-10+ Tregs (23,24). What is responsible for the induction of TGF-β1+ T cell upon of antigen presentation in the presence of dominant co-stimulation by CD80? While IL-10 levels remained more or less the same after 36 h, significant level of TGF-β1 was detected only after 72 h. This led us to assume that IL-10 produced by these T cells upon CTLA-4 ligation by CD80 at the early phase of T cell:APC interaction might be responsible for inducing T cells that can produce TGF-β1. This was substantiated when TGF-β1 production by T cells was completely abrogated in the presence of neutralizing anti-IL-10 Ab in cultures where anti-CD86 Ab was also present.
We examined if IL-10 and TGF-β1 producing cells can suppress antigen specific proliferation of effector T cells. In fact, T cells from CD86 blockade culture suppressed the proliferation of antigen specific CD4+ and CD8+ effector T cells and indicated their immunoregulatory properties. Studies have shown that, unlike the homogenous naturally existing CD4+CD25+ Tregs that express the suppressor cytokine TGF-β1 and the transcription factor Foxp3, adaptive Tregs are heterogeneous and can express Foxp3, IL-10 and/or TGF-β1 (25-29), and can function through several mechanisms. Secreted cytokines such as IL-10 and TGF-β1 or surface bound TGF-β1 have been considered as major mediators of suppression used by adaptive Tregs (25-29). Our observation that T cells from CD86 blockade culture secreted large amounts of IL-10 and TGF-β1 suggested that these cytokines could be critical for their Treg function. Interestingly, neutralization of TGF-β1, but not IL-10 completely reversed the suppressive effect of T cells, and enhanced the IFN-γ and IL-2 responses significantly in CD86 blockade culture. In addition, as reported earlier (15,16,30,31), experiments using enriched T cells with surface bound TGF-β1+ suggested that the ability of T cells from CD86 blockade cultures to suppress effector T cells is mediated by both membrane bound and secreted forms of TGF-β1.
Since TGF-β1 lacks a transmembrane domain, it is believed that it anchors to yet unidentified surface molecules (32,33). Although many studies have demonstrated that CD4+CD25− T cells can produce significant amounts of TGF-β1 depending on the type of signal they receive (34,35), activated CD4+CD25+ Tregs are considered the primary natural T cell source of TGF-β1 (36,37). Hence, the source of TGF-β1 produced upon dominant co-stimulation by CD80 was tested. To our surprise, majority of TGF-β1+ T cells were not only found to be CD4+CD25−, but depletion of CD4+CD25+ population from the T cell preparation had no effect in the overall frequency of CD4+CD25− T cells with surface bound TGF-β1. This demonstrated that “effector T cell population” itself produces TGF-β1 upon CTLA-4 ligation by CD80 in the absence, or reduced levels, of co-stimulation by CD86.
One of the key observations of our study is that blockade of CD86, but not CD80 alone or CD80 and CD86 simultaneously, produced enhanced IL-10, TGF-β1 and regulatory T cell responses. This indicates that ligation of CTLA-4 and/or CD28 by CD80 plays a dominant immunoregulatory role. Considering that CD80 can bind to CTLA-4 with a higher avidity and that anti-CTLA-4 FAb blocked the TGF-β1 inducing effect of dominant co-stimulation by CD80 clearly indicated that CD80-CTLA-4 interaction is important for the induction of suppressor cytokines and the regulatory phenotype of T cells. Previous studies demonstrating that signaling through CTLA-4 using agonistic Abs can induce IL-10 response (15,16,38) also corroborate this notion. Addition of anti-CD28 FAb along with anti-CD86 or anti-CD80 Ab not only resulted in the suppression of T cell proliferation, but also inhibited both inflammatory and suppressor cytokine responses (not shown) suggesting that initial activation of T cells through CD28 is critical in the Treg inducing effect of dominant co-stimulation by CD80.
Earlier studies on the differential effects of CD80 and CD86 mediated co-stimulation have shown that blockade of CD86, but not CD80, can prevent autoimmune diseases (39-41). Treatment of young NOD mice with anti-CD86 Ab delayed type 1 diabetes (T1D) (39). While continuous treatment using anti-CD86 Ab beginning at a young age profoundly delayed T1D in NOD mice, treatment using anti-CD80 Ab advanced hyperglycemia by several weeks. Similarly, use of CD80 and CD86 deficient mouse models has also shown different outcomes in different autoimmune disease models (16,40-44). However, the basic mechanism that caused the suppression of, or delay in the, disease when CD86 was blocked, or absent, was not entirely clear. Studies using CD86 deficient NOD mice have shown that priming of autoreactive T cells against pancreatic β-cell antigen is controlled by this co-stimulatory ligand (42). Although some studies have concluded that CD80 and CD86 mediated co-stimulation can differentially affect Th1 and Th2 responses, this notion has been contradicted by careful multi-parameter studies. These studies have postulated that the differences in the abilities of CD80 and CD86 to induce different cytokines and T cell responses are primarily dependent on the ligand intensity and their expression dynamics on APCs, and strength of antigenic stimulus (45-47).
Our experiments show that β cell antigen pulsed CD86−/− DCs, but not CD80−/− or wild-type DCs, upon adoptive transfer could delay onset of hyperglycemia in pre-diabetic NOD mice. Importantly, while mice that were treated with antigen pulsed CD80−/− DCs showed significantly higher number of effector T cells proliferating against the antigen, T cells from mice that received antigen pulsed CD86−/− DCs were not only less proliferative but produced significant levels of IL-10 and TGF-β1 compared to controls. This indicates that TGF-β1 and IL-10 mediated suppression of autoreactive T cells, resulting from dominant co-stimulation by CD80 in NOD mice, may be playing a critical role in the disease suppression. Notably, DCs deficient in both CD80 and CD86 were more effective in delaying the onset of T1D. T cells from these recipients, unlike CD86−/− DC recipients, failed to significantly proliferate or produce cytokines and suggested that a different mechanism such as induction of anergic T cells or deletion of antigen specific T cells may be involved in the suppression of insulitis in these mice. In this context, it is important to realize that although co-stimulation is not essential for recall proliferative response of T cells to antigen, optimum activation and expansion of effector T cells can occur only in the presence of sufficient co-stimulatory help (48-50). Further, detection of TGF-β1+ T cells in CD86−/− DC recipient mice, in conjunction with observations from our in vitro studies, suggests that these T cells could be important in the disease suppression observed in CD86−/− DC recipients. Therefore, this study, in conjunction with a previous report demonstrating the induction of TGF-β1+ T cells and suppression of T1D in NOD mice by DNA co-vaccination with pancreatic islet antigen and a CTLA-4 specific ligand B7.1wa (51), demonstrates the therapeutic potential of approaches to selectively engage CTLA-4 in suppressing autoimmunity.
Although additional studies are required to further understand how CD80 and CD86 induce different cytokines and whether CD80 engagement of CTLA-4 and/or CD28 has a direct role in initiating TGF-β1 response, our current study demonstrates that preferential engagement of CTLA-4 on activated T cells by CD80 triggers IL-10 response that in turn leads to TGF-β1 response. Interestingly, a recent study has shown that CD80 can bind to PD-L1 expressed by T cells to send downstream inhibitory signal (52). Although, blockade of CTLA-4 signaling alone could abolish the effect of preferential co-stimulation by CD80 in our study, the possibility that the interaction of CD80 with PD-L1 on T cells could be contributing to the T cell negative regulatory effect of CD80 cannot be ruled out. Additional studies are needed to understand the possible role of CD80 ligation induced PD-L1 negative signaling in promoting IL-10 and/or TGF-β1 production by T cells upon dominant co-stimulation by CD80.
Earlier, we have shown that CTLA-4 has higher affinity for its ligands compared to CD28 (12). Further, CD86 is known to have faster association and dissociation rates with its receptors compared to CD80 (10,11). The ability of CD80 to exist in a dimeric form helps its high avidity interaction with both CD28 and CTLA-4 at the immune synapse through ordered lattice formation (11). Although CD80 and CD86 have same receptor specificities, preferentially CD80, and not CD86, regulates T cell activation through CTLA-4 ligation. Importantly, our observations clearly demonstrate that CD80 interaction induced CTL-4 signaling triggers generation of adaptive Tregs. Although a role for CTLA-4 signaling in naturally existing Treg generation in the thymus is not well understood, we and others have demonstrated its ability to induce adaptive Treg populations (14,15,51,53,54). We have shown that ligation of CTLA-4 in vitro and in vivo using an agonistic Ab can induce TGF-β1+ and/or Foxp3+ CD62Llow adaptive Tregs (14,15,53). Other studies have also demonstrated that CTLA-4 signaling is required for TGF-β1 dependent Foxp3+ adaptive Treg induction (54). Yet another study has demonstrated that in vivo delivery of a CTLA-4 specific ligand along with a self-antigen through DNA vaccination approach results in the induction of CD4+CD25− adaptive Tregs with membrane bound TGF-β1 (51). In spite of these observations, it is not known whether CTLA-4 signaling has a direct role in the adaptive Treg generation. Based on our observations, we believe that CTLA-4 signaling alone may not lead to the conversion of effector T cells into Tregs. However, CTLA-4 engagement alters cytokine milieu depending on the signaling strength and/or other receptor-ligand interactions, and perhaps the resultant “appropriate cytokine milieu” promotes the generation of adaptive Treg populations.
In summary, our observations show that CD80, but not CD86, is the preferential ligand for CTLA-4 and co-stimulation/co-inhibition by CD80 in the absence, or reduced levels, of CD86 can lead to induction of hypoproliferative T cells that produce both IL-10 and TGF-β1 and act as adaptive Tregs. Our study not only contributes to the understanding of co-stimulatory/co-inhibitory differences between CD80 and CD86, but also, for the first time, demonstrates the involvement of CD80 in inducing adaptive Tregs.
Acknowledgments
This work was supported by the National Institutes of Health (NIH) grant R21 AI069848 and Juvenile Diabetes Research Foundation regular grant 1−2005−27 to CV, NIH KO8 AI001821 to MJH, and NIH RO1 AI058190 to BSP. We thank Dr. Margalit Mokyr (UIC) for helpful comments on the manuscript.
Abbreviations
- BM
Bone marrow
- BMDCs
bone marrow derived dendritic cells
- Tregs
regulatory T cells
- Foxp3
foxhead box p3 transcription factor
- TGF-β1
transforming growth factor 1 beta
- T1D
Type 1 diabetes
- OVA
ovalbumin
Footnotes
Address Correspondence and reprint request to: Chenthamarakshan Vasu, Department of Surgery, University of Illinois at Chicago, 909 S. Wolcott, COMRB #7113, M/C790, Chicago, Illinois-60612. Phone: 312−996−2431. Fax: 312−355−2146. Email: chenta@uic.edu
REFERENCE
- 1.Lenschow DJ, Walunas TL, Bluestone JA. CD28/B7 system of T cell costimulation. Annu. Rev. Immunol. 1996;14:233–258. doi: 10.1146/annurev.immunol.14.1.233. [DOI] [PubMed] [Google Scholar]
- 2.Yi-qun Z, Lorre K, de Boer M, Ceuppens JL. B7-blocking agents, alone or in combination with cyclosporin A, induce antigen-specific anergy of human memory T cells. J. Immunol. 1997;158:4734–4740. [PubMed] [Google Scholar]
- 3.Gimmi CD, Freeman GJ, Gribben JG, Gray G, Nadler LM. Human T-cell clonal anergy is induced by antigen presentation in the absence of B7 costimulation. Proc. Natl. Acad. Sci. USA. 1993;90:6586–6590. doi: 10.1073/pnas.90.14.6586. [DOI] [PMC free article] [PubMed] [Google Scholar]
- 4.Walunas TL, Lenschow DJ, Bakker CY, Linsley PS, Freeman GJ, Green JM, Thompson CB, Bluestone JA. CTLA-4 can function as a negative regulator of T cell activation. Immunity. 1994;1:405–413. doi: 10.1016/1074-7613(94)90071-x. [DOI] [PubMed] [Google Scholar]
- 5.Tivol EA, Borriello F, Schweitzer AN, Lynch WP, luestone JAB, Sharpe AH. Loss of CTLA-4 leads to massive lymphoproliferation and fatal multiorgan tissue destruction, revealing a critical negative regulatory role of CTLA-4. Immunity. 1995;3:541–547. doi: 10.1016/1074-7613(95)90125-6. [DOI] [PubMed] [Google Scholar]
- 6.Schweitzer AN, Borriello F, Wang RC, Abbas AK, Sharpe AH. Role of co-stimulators in T cell differentiation: studies using antigen-presenting cells lacking expression of CD80 or CD86. J. Immunol. 1997;158:2713–2752. [PubMed] [Google Scholar]
- 7.Kuchroo VK, Das MP, Brown JA, Ranger AM, Zamvil SS, Sobel RA, Weiner HL, Nabavi N, Glimcher LH. B7−1 and B7−2 co-stimulatory molecules activate differentially the Th1/Th2 developmental pathways: application to autoimmune disease therapy. Cell. 1995;80:707–718. doi: 10.1016/0092-8674(95)90349-6. [DOI] [PubMed] [Google Scholar]
- 8.Manzotti CN, Liu MK, Burke F, Dussably L, Zheng Y, Sansom DM. Integration of CD28 and CTLA-4 function results in differential responses of T cells to CD80 and CD86. Eur J Immunol. 2006;36:1413–1422. doi: 10.1002/eji.200535170. [DOI] [PubMed] [Google Scholar]
- 9.Stamper CC, Zhang Y, Tobin JF, Erbe DV, Ikemizu S, Davis SJ, Stahl ML, Seehra J, Somers WS, Mosyak L. Crystal structure of the B7−1/CTLA-4 complex that inhibits human immune responses. Nature. 2001;410:608–611. doi: 10.1038/35069118. [DOI] [PubMed] [Google Scholar]
- 10.Ikemizu S, Gilbert RJ, Fennelly JA, Collins AV, Harlos K, Jones EY, Stuart DI, Davis SJ. Structure and dimerization of a soluble form of B7−1. Immunity. 2000;12:51–60. doi: 10.1016/s1074-7613(00)80158-2. [DOI] [PubMed] [Google Scholar]
- 11.Schwartz JC, Zhang X, Fedorov AA, Nathenson SG, Almo SC. Structural basis for co-stimulation by the human CTLA-4/B7−2 complex. Nature. 2001;410:604–608. doi: 10.1038/35069112. [DOI] [PubMed] [Google Scholar]
- 12.Vasu C, Wang A, Gorla SR, Kaithamana S, Prabhakar BS, Holterman MJ. CD80 and CD86 C domains play an important role in receptor binding and co-stimulatory properties. Int Immunol. 2003;15:167–175. doi: 10.1093/intimm/dxg017. [DOI] [PubMed] [Google Scholar]
- 13.Pentcheva-Hoang T, Egen JG, Wojnoonski K, Allison JP. B7−1 and B7−2 selectively recruit CTLA-4 and CD28 to the immunological synapse. Immunity. 2004;21:401–13. doi: 10.1016/j.immuni.2004.06.017. [DOI] [PubMed] [Google Scholar]
- 14.Li R, Perez N, Karumuthil-Melethil S, Prabhakar BS, Holterman MJ, Vasu C. Enhanced Engagement of CTLA-4 Induces Antigen-Specific CD4+CD25+Foxp3+ and CD4+CD25 TGF-beta1+ Adaptive Regulatory T Cells. J. Immunol. 2007;179:5191–5203. doi: 10.4049/jimmunol.179.8.5191. [DOI] [PubMed] [Google Scholar]
- 15.Vasu C, Prabhakar BS, Holterman MJ. Targeted CTLA-4 engagement induces CD4+CD25+CTLA-4high T regulatory cells with target (allo) antigen specificity. J. Immunol. 2004;173:2866–2876. doi: 10.4049/jimmunol.173.4.2866. [DOI] [PubMed] [Google Scholar]
- 16.Girvin AM, Dal Canto MC, Rhee L, Salomon B, Sharpe A, Bluestone JA, Miller SD. A critical role for B7/CD28 costimulation in experimental autoimmune encephalomyelitis: a comparative study using costimulatory molecule-deficient mice and monoclonal antibody blockade. J Immunol. 2000;164:136–43. doi: 10.4049/jimmunol.164.1.136. [DOI] [PubMed] [Google Scholar]
- 17.Salomon B, Lenschow DJ, Rhee L, Ashourian N, Singh B, Sharpe A, Bluestone JA. B7/CD28 costimulation is essential for the homeostasis of the CD4+CD25+ immunoregulatory T cells that control autoimmune diabetes. Immunity. 2000;12:431–40. doi: 10.1016/s1074-7613(00)80195-8. [DOI] [PubMed] [Google Scholar]
- 18.Li R, Perez N, Karumuthil-Melethil S, Vasu C. Bone marrow is a preferential homing site for autoreactive T-cells in type 1 diabetes. Diabetes. 2007;56:2251–2259. doi: 10.2337/db07-0502. [DOI] [PubMed] [Google Scholar]
- 19.Manzotti CN, Liu MK, Burke F, Dussably L, Zheng Y, Sansom DM. Integration of CD28 and CTLA-4 function results in differential responses of T cells to CD80 and CD86. Eur J Immunol. 2006;36:1413–22. doi: 10.1002/eji.200535170. [DOI] [PubMed] [Google Scholar]
- 20.Manzotii CN, Tipping H, Perry LC, Mead KI, Blair PJ, Zheng Y, Sansom DM. Inhibition of human T cell proliferation by CTLA-4 utilizes CD80 and requires CD25+ regulatory T cells. Eur J Immunol. 2002;32:2888–2896. doi: 10.1002/1521-4141(2002010)32:10<2888::AID-IMMU2888>3.0.CO;2-F. [DOI] [PubMed] [Google Scholar]
- 21.Lang TJ, Nguyen P, Peach R, Gause WC, Via CS. In vivo CD86 blockade inhibits CD4+ T cell activation, whereas CD80 blockade potentiates CD8+ T cell activation and CTL effector function. J Immunol. 2002;168:3786–3792. doi: 10.4049/jimmunol.168.8.3786. [DOI] [PubMed] [Google Scholar]
- 22.Berg M, Zavazava N. Regulation of CD28 expression on CD8+ T cells by CTLA-4. J Leukoc Biol. 2007 Dec 27; doi: 10.1189/jlb.0107065. [Epub ahead of print] [DOI] [PubMed] [Google Scholar]
- 23.Kapp JA, Honjo K, Kapp LM, Goldsmith K, Bucy RP. Antigen, in the presence of TGF-beta, induces up-regulation of FoxP3gfp+ in CD4+ TCR transgenic T cells that mediate linked suppression of CD8+ T cell responses. J Immunol. 2007;179:2105–2114. doi: 10.4049/jimmunol.179.4.2105. [DOI] [PubMed] [Google Scholar]
- 24.Kitani A, Fuss I, Nakamura K, Kumaki F, Usui T, Strober W. Transforming growth factor (TGF)-beta1-producing regulatory T cells induce Smad-mediated interleukin 10 secretion that facilitates coordinated immunoregulatory activity and amelioration of TGF-beta1-mediated fibrosis. J Exp Med. 2003;198:1179–1188. doi: 10.1084/jem.20030917. [DOI] [PMC free article] [PubMed] [Google Scholar]
- 25.Bluestone JA, Abbas AK. Natural versus adaptive regulatory T cells. Nat Rev Immunol. 2003;3:253–257. doi: 10.1038/nri1032. [DOI] [PubMed] [Google Scholar]
- 26.Zheng SG, Wang JH, Gray JD, Soucier H, Horwitz DA. Natural and induced CD4+CD25+ cells educate CD4+CD25− cells to develop suppressive activity: the role of IL-2, TGF-β , and IL-10. J. Immunol. 2004;172:5213–5221. doi: 10.4049/jimmunol.172.9.5213. [DOI] [PubMed] [Google Scholar]
- 27.Kulkarni AB, Huh CC, Becker D, Geiser A, Lyght M, Flanders KC, Roberts AB, Sporn MB, Ward JM, Karlsson S. Transforming growth factor β1 null mutation in mice causes excessive inflammatory response and early death. Proc. Natl. Acad. Sci. USA. 1993;90:770–774. doi: 10.1073/pnas.90.2.770. [DOI] [PMC free article] [PubMed] [Google Scholar]
- 28.You S, Leforban B, Garcia C, Bach JF, Bluestone JA, hatenoud LC. Adaptive TGF-beta-dependent regulatory T cells control autoimmune diabetes and are a privileged target of anti-CD3 antibody treatment. Proc Natl Acad Sci. USA. 2007;104:6335–6340. doi: 10.1073/pnas.0701171104. [DOI] [PMC free article] [PubMed] [Google Scholar]
- 29.Ito T, Yang M, Wang YH, Lande R, Gregorio J, Perng OA, Qin XF, Liu YJ, Gilliet M. Plasmacytoid dendritic cells prime IL-10-producing T regulatory cells by inducible costimulator ligand. J Exp Med. 2007;204:105–115. doi: 10.1084/jem.20061660. [DOI] [PMC free article] [PubMed] [Google Scholar]
- 30.Ochi H, Abraham M, Ishikawa H, Frenkel D, Yang K, Basso AS, Wu H, Chen ML, Gandhi R, Miller A, et al. Oral CD3-specific antibody suppresses autoimmune encephalomyelitis by inducing CD4+CD25− LAP+ T cells. Nat. Med. 2006;12:627–635. doi: 10.1038/nm1408. [DOI] [PubMed] [Google Scholar]
- 31.Nakamura K, Kitani A, Strober W. Cell contact-dependent immunosuppression by CD4+CD25+ regulatory T cells is mediated by cell surface-bound transforming growth factor-β. J. Exp Med. 2001;194:629–644. doi: 10.1084/jem.194.5.629. [DOI] [PMC free article] [PubMed] [Google Scholar]
- 32.Letterio JJ, Roberts AB. Regulation of immune responses by TGF-β. Annu. Rev. Immunol. 1988;16:137–161. doi: 10.1146/annurev.immunol.16.1.137. [DOI] [PubMed] [Google Scholar]
- 33.Crawford SE, Stellmach V, Murphy-Ullrich JE, Ribeiro SM, Lawler J, Hynes RO, Boivin GP, Bouck N. Thrombospondin-1 is a major activator of TGF-β1 in vivo. Cell. 1998;93:1159–1170. doi: 10.1016/s0092-8674(00)81460-9. [DOI] [PubMed] [Google Scholar]
- 34.Zheng SG, Gray JD, Ohtsuka K, Yamagiwa S, Horwitz DA. Generation ex vivo of TGF-beta-producing regulatory T cells from CD4+CD25− precursors. J Immunol. 2002;169:4183–4189. doi: 10.4049/jimmunol.169.8.4183. [DOI] [PubMed] [Google Scholar]
- 35.Cottrez F, Groux H. Regulation of TGF-beta response during T cell activation is modulated by IL-10. J Immunol. 2001;167:773–778. doi: 10.4049/jimmunol.167.2.773. [DOI] [PubMed] [Google Scholar]
- 36.Nakamura K, Kitani A, Fuss I, Pedersen A, Harada N, Nawata H, Strober W. TGF-beta1 plays an important role in the mechanism of CD4+CD25+ regulatory T cell activity in both humans and mice. J Immunol. 2004;172:834–842. doi: 10.4049/jimmunol.172.2.834. [DOI] [PubMed] [Google Scholar]
- 37.Nakamura K, Kitani A, Strober W. Cell contact-dependent immunosuppression by CD4+CD25+ regulatory T cells is mediated by cell surface-bound transforming growth factor-beta. J. Exp. Med. 2001;194:629–644. doi: 10.1084/jem.194.5.629. [DOI] [PMC free article] [PubMed] [Google Scholar]
- 38.Jovasevic VM, Gorelik L, Bluestone JA, Mokyr MB. Importance of IL-10 for CTLA-4-mediated inhibition of tumor-eradicating immunity. J Immunol. 2004;172:1449–1454. doi: 10.4049/jimmunol.172.3.1449. [DOI] [PubMed] [Google Scholar]
- 39.Lenschow DJ, Ho SC, Sattar H, Rhee L, Gray G, Nabavi N, Herold KC, Bluestone JA. Differential effects of anti-B7−1 and anti-B7−2 monoclonal antibody treatment on the development of diabetes in the nonobese diabetic mouse. J Exp Med. 1995;181:1145–1155. doi: 10.1084/jem.181.3.1145. [DOI] [PMC free article] [PubMed] [Google Scholar]
- 40.Peterson KE, Sharp GC, Tang H, Braley-Mullen H. B7.2 has opposing roles during the activation versus effector stages of experimental autoimmune thyroiditis. J Immunol. 1999;162:1859–1867. [PubMed] [Google Scholar]
- 41.Nakajima A, Azuma M, Kodera S, Nuriya S, Terashi A, Abe M, Hirose S, Shirai T, Yagita H, Okumura K. Preferential dependence of autoantibody production in murine lupus on CD86 costimulatory molecule. Eur J Immunol. 1995;25:3060–3069. doi: 10.1002/eji.1830251112. [DOI] [PubMed] [Google Scholar]
- 42.Yadav D, Judkowski V, Flodstrom-Tullberg M, Sterling L, Redmond WL, Sherman L, Sarvetnick N. B7−2 (CD86) controls the priming of autoreactive CD4 T cell response against pancreatic islets. J Immunol. 2004;173:3631–3639. doi: 10.4049/jimmunol.173.6.3631. [DOI] [PubMed] [Google Scholar]
- 43.Furukawa Y, Mandelbrot DA, Libby P, Sharpe AH, Mitchell RN. Association of B7−1 co-stimulation with the development of graft arterial disease. Studies using mice lacking B7−1, B7−2, or B7−1/B7−2. Am J Pathol. 2000;157:473–484. doi: 10.1016/S0002-9440(10)64559-2. [DOI] [PMC free article] [PubMed] [Google Scholar]
- 44.Chang TT, Jabs C, Sobel RA, Kuchroo VK, Sharpe AH. Studies in B7-deficient mice reveal a critical role for B7 co-stimulation in both induction and effector phases of experimental autoimmune encephalomyelitis. J Exp Med. 1999;190:733–740. doi: 10.1084/jem.190.5.733. [DOI] [PMC free article] [PubMed] [Google Scholar]
- 45.MacPhee IA, Turner DR, Yagita H, Oliveira DB. CD80 (B7.1) and CD86 (B7.2) do not have distinct roles in setting the Th1/Th2 balance in autoimmunity in rats. Scand J Immunol. 2001;54:486–494. doi: 10.1046/j.1365-3083.2001.00998.x. [DOI] [PubMed] [Google Scholar]
- 46.Suvas S, Singh V, Sahdev S, Vohra H, Agrewala JN. Distinct role of CD80 and CD86 in the regulation of the activation of B cell and B cell lymphoma. J Biol Chem. 2002;277:7766–7775. doi: 10.1074/jbc.M105902200. [DOI] [PubMed] [Google Scholar]
- 47.Tao X, Constant S, Jorritsma P, Bottomly K. Strength of TCR signal determines the costimulatory requirements for Th1 and Th2 CD4+ T cell differentiation. J Immunol. 1997;159:5956–5963. [PubMed] [Google Scholar]
- 48.London CA, Lodge MP, Abbas AK. Functional responses and costimulator dependence of memory CD4+ T cells. J Immunol. 2000;164:265–272. doi: 10.4049/jimmunol.164.1.265. [DOI] [PubMed] [Google Scholar]
- 49.Croft M, Bradley LM, Swain SL. Naive versus memory CD4 T cell response to antigen. Memory cells are less dependent on accessory cell co-stimulation and can respond to many antigen-presenting cell types including resting B cells. J Immunol. 1994;152:2675–2685. [PubMed] [Google Scholar]
- 50.Dubey C, Croft M, Swain SL. Naive and effector CD4 T cells differ in their requirements for T cell receptor versus costimulatory signals. J Immunol. 1996;157:3280–3290. [PubMed] [Google Scholar]
- 51.Glinka Y, Chang Y, Prud'homme GJ. Protective regulatory T cell generation in autoimmune diabetes by DNA covaccination with islet antigens and a selective CTLA-4 ligand. Mol Ther. 2006;14:578–587. doi: 10.1016/j.ymthe.2006.03.021. [DOI] [PubMed] [Google Scholar]
- 52.Butte MJ, Keir ME, Phamduy TB, Sharpe AH, Freeman GJ. Programmed death-1 ligand 1 interacts specifically with the B7−1 costimulatory molecule to inhibit T cell responses. Immunity. 2007;27:111–122. doi: 10.1016/j.immuni.2007.05.016. [DOI] [PMC free article] [PubMed] [Google Scholar]
- 53.Vasu C, Gorla SR, Prabhakar BS, Holterman MJ. Targeted engagement of CTLA-4 prevents autoimmune thyroiditis. Int Immunol. 2003;15:641–654. doi: 10.1093/intimm/dxg061. [DOI] [PubMed] [Google Scholar]
- 54.Zheng SG, Wang JH, Stohl W, Kim KS, Gray JD, Horwitz DA. TGF-beta requires CTLA-4 early after T cell activation to induce FoxP3 and generate adaptive CD4+CD25+ regulatory cells. J. Immunol. 2006;176:3321–3329. doi: 10.4049/jimmunol.176.6.3321. [DOI] [PubMed] [Google Scholar]