Abstract
Chromatin influences gene expression by restricting access of DNA binding proteins to their cognate sites in the genome1–3. Large-scale characterization of nucleosome positioning in Saccharomyces cerevisiae has revealed a stereotyped promoter organization in which a nucleosome-free region (NFR) is present within several hundred base pairs upstream of the translation start site4,5. Many transcription factors bind within NFRs and nucleate chromatin remodelling events which then expose other cis-regulatory elements6–9. However, it is not clear how transcription-factor binding and chromatin influence quantitative attributes of gene expression. Here we show that nucleosomes function largely to decouple the threshold of induction from dynamic range. With a series of variants of one promoter, we establish that the affinity of exposed binding sites is a primary determinant of the level of physiological stimulus necessary for substantial gene activation, and sites located within nucleosomal regions serve to scale expression once chromatin is remodelled. Furthermore, we find that the S. cerevisiae phosphate response (PHO) pathway exploits these promoter designs to tailor gene expression to different environmental phosphate levels. Our results suggest that the interplay of chromatin and binding-site affinity provides a mechanism for fine-tuning responses to the same cellular state. Moreover, these findings may be a starting point for more detailed models of eukaryotic transcriptional control.
When cells sense changes in environmental inorganic phosphate (Pi), the activity of the transcription factor Pho4 is modulated by phosphorylation10: Pho4 is phosphorylated on four sites, cytoplasmic, and inactive when cells are grown in Pi-rich medium; it is phosphorylated selectively on one site and localized to the nucleus in intermediate Pi (about 100 μM) conditions; and it is unphosphorylated, nuclear and fully active in Pi starvation11,12. The co-activator Pho2 interacts with unphosphorylated Pho4 and is required for induction of many PHO genes13,14; however, it is not thought to be regulated in response to Pi availability12. Despite being controlled by the same activators, the target gene PHO5 is expressed at a low level in intermediate Pi conditions, whereas PHO84 is significantly induced14. Although both promoters contain a combination of high- and low-affinity Pho4-binding sites15–17, more Pho4 is recruited to PHO84 in intermediate Pi conditions than to PHO514. We hypothesized that chromatin may influence gene expression by differentially regulating the accessibility of Pho4 sites in the PHO5 and PHO84 promoters.
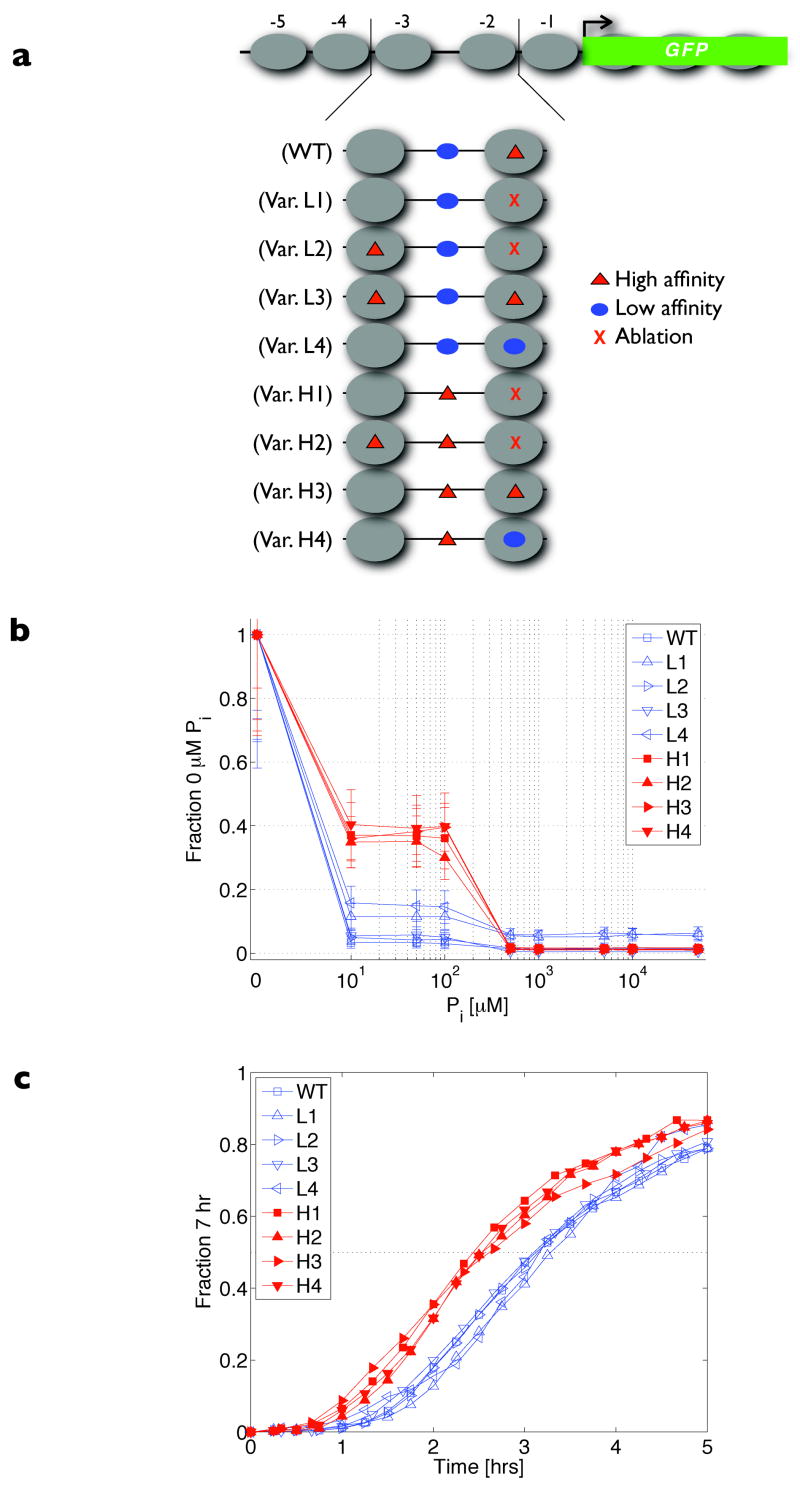
To test this hypothesis, we constructed variants of the PHO5 promoter controlling transcription of a green fluorescent protein (GFP) reporter gene (Fig. 1a). The PHO5 promoter contains five positioned nucleosomes (numbered −5 to −1), a low-affinity Pho4 site (CACGTTt) and a Pho2 site in the NFR, and a high-affinity Pho4 site (CACGTGg) and distal Pho2 sites occluded under nucleosome −216–20. The difference in affinity between these two Pho4 sites is estimated to be about 3-fold by electrophoretic mobility shift assay21, and about 13-fold by a recent high-throughput fluorescence-based assay22. The Pho4 site in the NFR is required for transcriptional induction: Pho4 binds this site and recruits ATP-dependent chromatin remodelling complexes that displace nucleosomes to expose additional cis-regulatory elements23,24. We manipulated the accessibility of Pho4 sites by relocating motifs into and/or out of nucleosomal regions and verified that our genetic perturbations have minimal impact on PHO5 chromatin structure (Supplementary Figs 1 and 2)5.
Figure 1. PHO5 promoter variants and quantitative expression behaviour.
a, Schematic of all PHO5 promoter variants controlling expression of yeGFP1. Large grey ovals represent nucleosomes, red triangles the high-affinity Pho4 motif (CACGTGg), blue ovals the low-affinity Pho4 motif (CACGTTt), and X the motif ablations. b, Physiological transcriptional response to extracellular inorganic phosphate (Pi) measured by flow cytometry. Data points represent median steady-state expression levels normalized to the median observed in Pi starvation. Error bars represent interquartile ranges, which were observed to encompass the medians of at least three independent measurements. c, Induction kinetics in Pi starvation. Data points represent median fluorescence levels scaled between the promoter-specific expression minimum at 0 h and maximum at 7 h. For b and c, red traces designate variants with an exposed high-affinity site, and blue traces variants with an exposed low-affinity site.
To assess the effects of these alterations quantitatively, we assayed the steady-state expression of PHO5 promoter variants grown in different concentrations of Pi. We observed surprisingly stereotyped behaviour when the output profile for each variant was normalized to its maximum expression. When grown in intermediate (10–100 μM) Pi concentrations, variants containing a low-affinity motif in the NFR induce slightly (5 ± 4% of maximum levels), whereas variants with an exposed high-affinity motif induce significantly (37 ± 2% of maximum levels) (Fig. 1b). This response is a function of the accessible Pho4 site and is independent of the number or placement of occluded Pho4 motifs: similar behaviour is observed when the high-affinity Pho4 site normally occluded by nucleosome −2 is transplanted or added under nucleosome −3 (variants L2, L3), or when there is a single accessible Pho4 site (variants L1, H1).
Based on our steady-state measurements, we expect promoter variants with an exposed high-affinity site to induce when cells reach the intermediate Pi range, whereas we expect promoters with an exposed low-affinity site to remain essentially repressed until near the zero Pi state. Indeed, we observe a difference in induction kinetics when the promoters are scaled to their particular dynamic range (Fig. 1c): the time-to-half-maximal induction of the high-affinity class is 146–157 min, whereas that of the low-affinity class is 186–197 min (Supplementary Table 1, interpolated values). The average 40 min lag observed in the low-affinity variants is not solely a result of inherently slower promoter activation; the kinetic difference is reduced by disabling the vacuolar phosphate buffer which accelerates the transition to the zero Pi state (Supplementary Fig. 3 and Supplementary Table 1)25. Rather, the lag is a consequence of how the affinity of the exposed site mediates a different response to the same upstream Pho4 signal in intermediate Pi conditions. Thus, the affinity of the transcription-factor binding site(s) in the NFR also influences the apparent kinetics of gene expression.
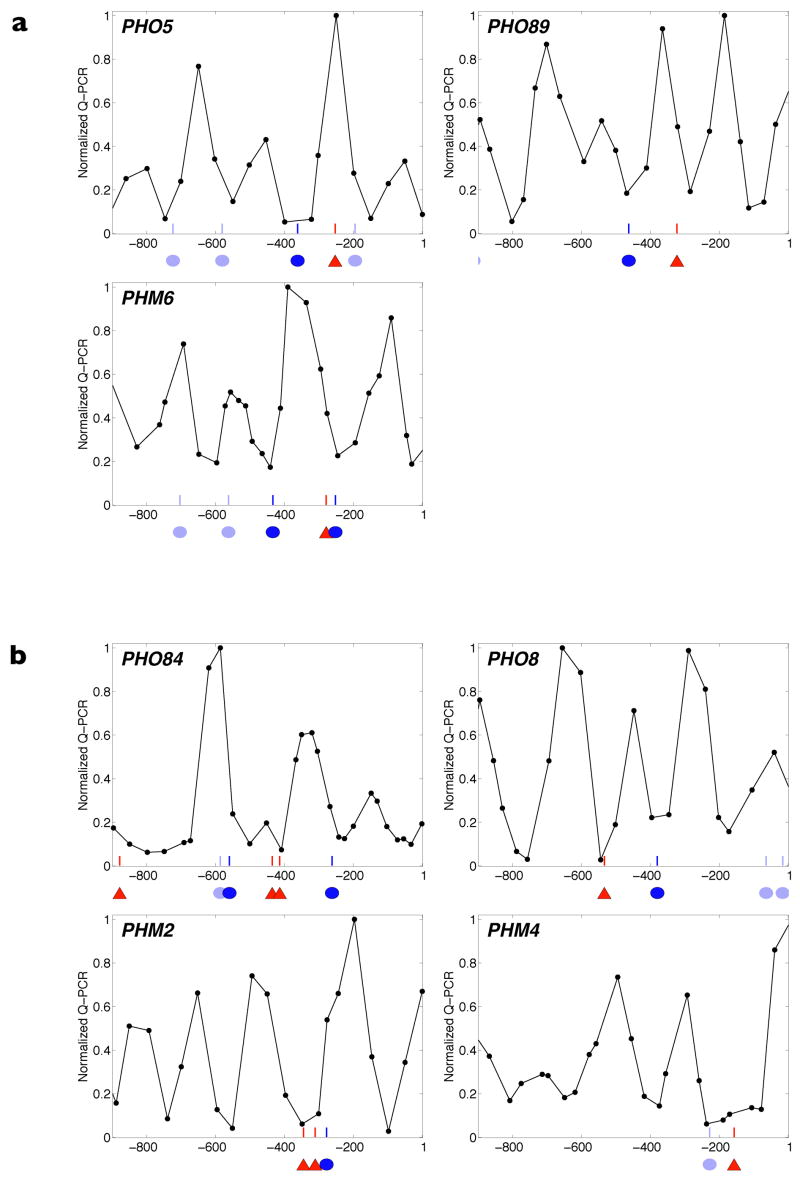
To assess the generality of this promoter design principle, we asked if binding-site coordinates and affinities, in combination with nucleosome positions, would allow quantitative prediction of promoter response profiles and kinetics. As a test set, we selected and mapped promoter chromatin (Supplementary Fig. 1) for PHO84 and five additional Pho4 targets that are highly induced by Pi starvation and have a combination of high- and low-affinity motifs for Pho4 (Supplementary Figs 4 and 5). PHO89 and PHM6 exhibit nucleosomal arrays that, like PHO5, expose only a low-affinity Pho4 motif(s) in the repressed state (Fig. 2a). The remaining four genes (PHO84, PHO8, PHM2 and PHM4) have promoters containing at least one accessible high-affinity motif (Fig. 2b). Although many of these promoters likely contain Pho2 sites (which are difficult to recognize by sequence owing to AT-rich composition and degeneracy), in intermediate and high Pi conditions these sites may not have a large influence on Pho4 recruitment because Pho4 is phosphorylated and unable to interact efficiently with Pho212.
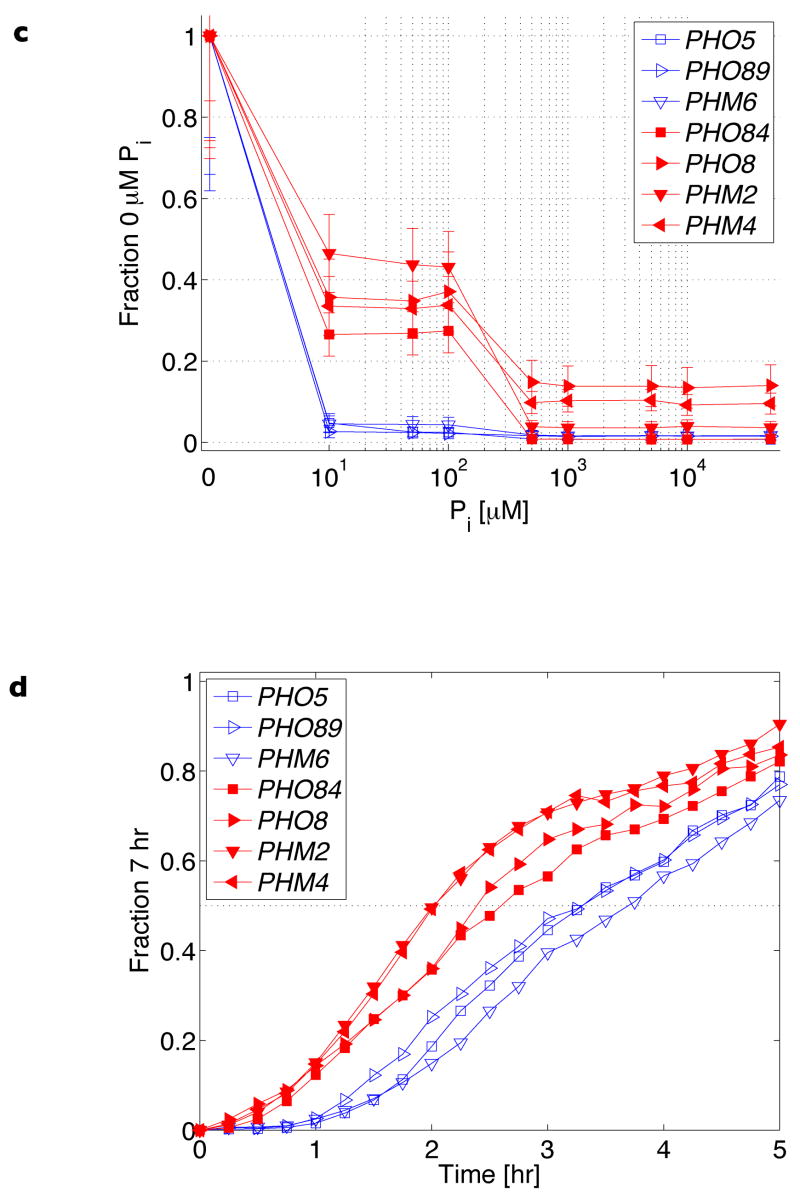
Figure 2. Promoter architecture and quantitative expression behaviour of representative PHO genes.
a, b, Promoter architecture schematized by superimposing nucleosome positions measured in repressing (10 mM Pi) conditions onto Pho4-binding sites identified through bioinformatic analysis (Supplementary Fig. 4). Red triangles represent evolutionarily conserved high-affinity motifs (CACGTG consensus), dark-blue ovals represent evolutionarily conserved low-affinity motifs (deviations from the high-affinity motif), light-blue ovals represent low-affinity motifs that are not evolutionarily conserved (Supplementary Fig. 5), and the x axis units reference promoter coordinates with respect to translation start (ATG = 1). In a are PHO promoters with an accessible low-affinity Pho4 site; in b are promoters with at least one accessible high-affinity Pho4 site. c, Steady-state transcriptional response of PHO target genes to Pi. Error bars are interquartile ranges (see Fig. 1b). d, Induction kinetics in Pi starvation.
We expected PHO89 and PHM6 to behave similarly to PHO5, exhibiting low-level expression in intermediate Pi and slow induction in Pi starvation, and promoters containing at least one exposed high-affinity site (PHO84, PHO8, PHM2 and PHM4) to exhibit substantial expression and rapid induction. We created GFP transcriptional reporter strains and, consistent with our expectations, observed that PHO89 and PHM6 induce minimally in intermediate Pi conditions (3 ± 1% of maximum) whereas PHO84, PHO8, PHM2 and PHM4 induce significantly (34 ± 5% of maximum) (Fig. 2c). Additionally, when starved for Pi, we observed that genes with an exposed high-affinity motif reach half-maximal induction in 121–156 min compared with 198–222 min for the low-affinity class (Fig. 2d and Supplementary Table 2, interpolated values). Therefore, the affinity of the accessible Pho4 site is sufficient to define a promoter threshold from which steady-state and kinetic behaviour follow.
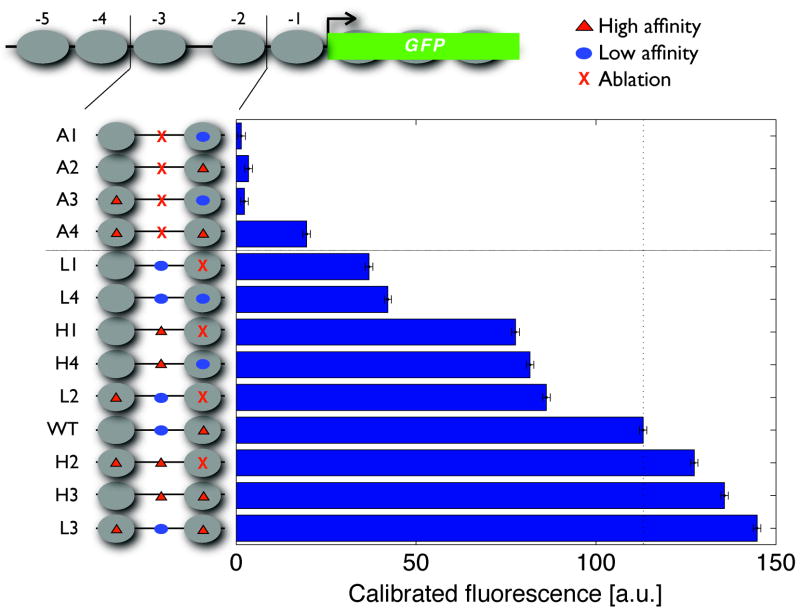
Nucleosome mapping and sequence analysis reveal that about 50% of the evolutionarily conserved Pho4 sites in our selection of PHO promoters are inaccessible in the repressed state and become exposed when chromatin is remodelled in response to Pi starvation (Fig. 2a, b and Supplementary Fig. 5). To assess the influence of these sites on quantitative gene expression in a controlled sequence background, we analysed the maximum induction levels of the PHO5 promoter variants (Fig. 3 and Supplementary Table 3). Consistent with the role of the accessible site in the nucleation of remodelling, variants lacking exposed motifs (A1–A4) are uninducible or severely crippled. Otherwise, maximum transcriptional output differs by a factor of about four to seven and correlates with the number, affinity and placement of Pho4 sites, irrespective of their accessibility in the repressed state. Thus, chromatin enables significant decoupling of the determinants of promoter threshold from determinants of expression capacity.
Figure 3. Maximum expression of PHO5 promoter variants.
Maximal induction levels of PHO5 promoter variants measured from strains containing a deletion of the PHO80 gene. The dotted vertical line references the expression output of the wild-type promoter. Data points represent mean ± s.d. from triplicate measurements. a.u., arbitrary units.
Collectively, our observations are consistent with a model whereby nucleosomes compete with Pho4 for binding DNA, and nucleosome occupancy is dynamic and determined by a balance of assembly and disassembly activities26–28. The chromatin maps and range of promoter outputs observed in different Pi conditions (Figs 1b, 2a–c, 3, Supplementary Fig. 6 and Supplementary Table 3) likely reflect the different extents of chromatin remodelling resulting from a competition between Pho4 binding and nucleosome re-assembly. Even the A4 PHO5 promoter variant containing two high-affinity sites occluded by nucleosomes can be induced to a reasonable level (Fig. 3). This observation is consistent with the model that chromatin is dynamic, and that multiple buried high-affinity sites are sufficient for Pho4 to compete successfully with nucleosomes.
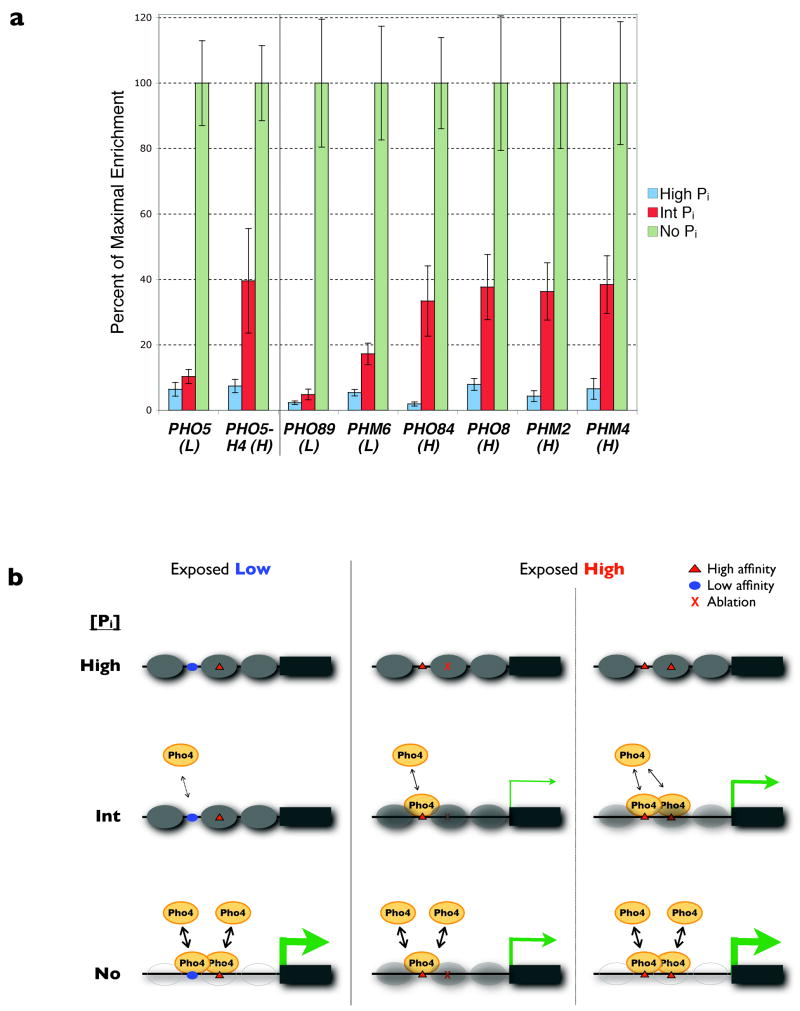
At the sub-maximal Pho4 activity (that is, nuclear concentration and/or phosphorylation state14,29) associated with intermediate Pi conditions, the occupancy of Pho4 at an exposed high-affinity site may be sufficient to nucleate substantial chromatin remodelling such that regulatory sequences that were previously nucleosomal now become more accessible, allowing for appreciable transcription. However, promoters with an exposed low-affinity motif likely do not achieve similar Pho4 occupancy until Pi starvation. Indeed, in vivo Pho4 occupancy is substantially higher in intermediate Pi conditions at PHO promoters containing accessible high-affinity sites than at promoters with exposed low-affinity sites (Fig. 4a). Tuning Pho4 activity such that only promoters with exposed high-affinity sites are substantially induced in intermediate Pi is physiologically relevant: the products of first-response genes like PHO84 and PHM4 allow the cell to take up environmental Pi and mobilize internal reserves before a second-order energy commitment is made in starvation conditions to upregulate PHO5 and other Pi scavenging components14. Chromatin renders the signal required for promoter induction sensitive to fewer sites (that is, those exposed), while allowing nucleosomal sites to influence maximum transcriptional output once the promoter becomes open (Fig. 4b). The threshold of activation and dynamic range thus become functionally decoupled, which would not be the case if all binding sites were exposed.
Figure 4. Pho4 binding in vivo to PHO promoters, and model of threshold-dynamic range decoupling.
a, Chromatin immunoprecipitation of Pho4 to PHO target genes and the H4 PHO5 promoter variant (see Fig. 1a) shows differential occupancy in intermediate Pi conditions at promoters with an exposed high- (H) versus low (L)-affinity site. Data points represent mean ± s.d. from at least three independent experiments. b, Schematic depicting a possible mechanism that decouples promoter induction threshold from dynamic range. In high Pi (top row), nucleosomes are fully assembled; in intermediate Pi (middle row), substantial Pho4 occupancy occurs only at promoters with exposed high-affinity sites, resulting in chromatin remodelling and transcription commensurate to the total Pho4 recruited; and in Pi starvation (bottom row), saturating Pho4 activity results in remodelling and maximum expression at all promoters. Nucleosome occupancy is indicated by the opacity of grey ovals, Pho4 by yellow ovals, and the amount of transcription by the thickness of the green arrows. See text for description.
These observations indicate that the interplay between chromatin structure and binding-site affinity may allow different eukaryotic promoters regulated by the same factor to interpret and respond to cellular signals uniquely. One implication of this finding is that future models of gene expression will require knowledge both of motifs and nucleosome positions. Additionally, the behaviour of PHO genes—largely a function of a single transcription factor—will likely prove simple compared with combinatorially controlled genes. But even with the nonlinearities created by multiple transcription factors, it will be fascinating to ascertain if similar architectural principles of promoter chromatin are conserved in other pathways and organisms as a mechanism for quantitatively configuring gene expression.
METHODS SUMMARY
Promoter variants
Pho4-binding sites or motif ablations were introduced into haploid S. cerevisiae at the chromosomal PHO5 locus. Additionally, the PHO5 coding region was completely substituted with the yeast-enhanced green fluorescent protein (yeGFP1)30 reporter using targeted gene replacement. To assess maximal induction levels, a derivative series of strains was created harbouring both the PHO5 promoter mutations and a deletion of the PHO80 gene.
Heterozygous transcriptional reporters
For representative PHO genes (except PHO84, where PHO84pr–yeGFP1 was placed ectopically), one allele in diploid S. cerevisiae was replaced with yeGFP1 at the chromosomal locus.
Growth conditions
For dose–response profiles, strains were grown in 0–50 mM extracellular Pi for 18 h to reach steady-state expression. For induction kinetics, strains grown overnight in 10 mM Pi were subjected to time-course measurements after transfer into 0 mM Pi. For measurements of maximum induction levels, pho80Δ strains were grown 18 h in 10 mM Pi to optical density (OD600) 0.05–0.1.
Flow cytometry
Fluorescence distributions were read using a Becton, Dickinson LSR II with 488 nm laser and calibrated to fluorescent polystyrene microspheres to control for experimental variation. Autofluorescence was assessed in all experiments by inclusion of a strain lacking yeGFP1. Data analysis was done using MATLAB.
Promoter chromatin maps
Mononucleosome-length DNA purified from micrococcal nuclease treated spheroplasts was assayed by quantitative polymerase chain reaction using primer sets that tile approximately 1 kilobase of each promoter region.
Chromatin immunoprecipitation
Cells were grown in high (10 mM), intermediate (100 μM) or no (0 μM) Pi medium for 2.5 h, and fixed in 1% formaldehyde. Pho4 fold enrichment over POL1 in segments including the nucleosome-free region of each promoter was measured by quantitative polymerase chain reaction, and further re-normalized to the maximal fold enrichment observed in no Pi.
METHODS
Identification of Pho4 motifs
Analysis by position-specific scoring matrix was used to identify systematically Pho4-binding sites among our selection of chromatin-mapped PHO promoters. From the 256 ΔΔGfull values measured by Maerkl and Quake of Pho4 binding to their NNNNGTG DNA oligonucleotide library22, the corresponding probabilities of binding were computed to produce an initial position-specific scoring matrix for the four base positions representing the E-box 5′ half-site and flanking base (that is, permuted positions only). To reflect the homodimeric nature of Pho4 binding to DNA31 and the optimality of palindromic motifs22, these base probabilities were reverse-complemented to fill the 3′ half-site plus flanking position to produce a full octameric position-specific scoring matrix.
Based on the resulting binding-probability profiles of PHO5, PHO84 and PHO8 (Supplementary Fig. 4a, d, e, respectively), whose Pho4-promoter interactions have been characterized by in vitro DNase I protection assays15,17,24,32, a noise threshold for likely Pho4 regulatory elements was determined by selecting the weakest probability matching an experimentally verified footprint. To distinguish high- from low-affinity motifs, a second threshold was established by comparing the binding profiles of PHO5 and PHO84 with in vitro competition footprinting experiments from the literature15,17, and selecting the most stringent probability necessary to recapitulate validated high-affinity sites. Finally, putative Pho4 sites were plotted on multiple alignments of Saccharomyces orthologues to assess evolutionary conservation (Supplementary Fig. 5) on the assumption that conserved sites indicate a higher likelihood of function33,34.
Flow cytometry analysis
To control for day-to-day instrument variation, a five-point calibration sample of fluorescent polystyrene microspheres was read at the start and end of each experiment. A weighted least-squares fit to the calibration points established a standard curve spanning an approximate 1,000-fold dynamic range that allowed for accurate quantitative comparison across different experiments. Signal area data from the fluorescein channel (FITC-A) for 10,000 cells were collected from all samples and interpolated off these standard curves before further analysis. Any reference to ‘calibrated fluorescence’ in this study refers to these standardized units.
Although samples were sonicated before flow cytometry to reduce cell aggregation, simple rectangular gating in the forward-scatter and side-scatter channels was performed to further reduce variability. An automated approach was implemented whereby data points outside the 0.1 and 0.85 quantiles in either forward scatter and side scatter were eliminated. This worked well empirically to eliminate debris and any remaining cell aggregates.
Although autofluorescence was minimized in all synthetic media experiments by the addition of supplementary adenine and tryptophan, a wild-type strain lacking yeGFP1 was included in all experiments to assess the level of fluorescence specific to gene expression. Instead of doing subtraction with fitted distribution parameters estimated from the yeGFP1− and transcriptional reporter samples, a randomly permuted vector subtraction of autofluorescence from the transcriptional reporter distributions was performed instead. This numerical approach was deemed more unbiased as assumptions of normality or distribution symmetry would not have to be made, and may have been particularly suited in situations where population behaviour was highly skewed (for example, during induction in Pi starvation conditions).
Two approaches were taken to estimate times of half-maximal induction (Supplementary Tables 1 and 2). The first was a simple linear interpolation of the time needed to reach a level halfway between the median expression observed at 0 and 7 h (Figs 1c and 2d). However, as interpolated half-times are highly sensitive to maximal induction levels, a second approach was taken for comparison where the unscaled kinetic data were subjected to a nonlinear least squares fit of a Hill equation with three freely varying parameters: n (Hill coefficient), Ymax (asymptotic maximal value) and Thalf (half maximal time). Because Ymax is a freely varying parameter, Thalf is not constrained to an arbitrary maximum and is free to adopt the value that best approximates the continuous underlying behaviour. In general, the fits gave normally distributed residuals centred around zero and low root mean squared errors (fit standard errors), indicating that the Hill model described the kinetic data well.
Supplementary Material
Supplementary Information is linked to the online version of the paper at www.nature.com/nature.
Acknowledgments
S. J. Maerkl and S. R. Quake for sharing Pho4-binding data; J. S. Weissman, H. Li, R. Losick, B. Stern and present and former members of the O’Shea laboratory for discussion and commentary on the manuscript; B. S. Margolin for strain EY1995 and assistance with cell sorting; and B. E. Shakhnovich for assistance with motif analysis. Support was provided by the National Institutes of Health, the Howard Hughes Medical Institute, the David and Lucile Packard Foundation (E.K.O.), and the Burroughs Wellcome Fund (F.H.L.).
Footnotes
Reprints and permissions information is available at www.nature.com/reprints.
References
- 1.Kornberg RD, Lorch Y. Twenty-five years of the nucleosome, fundamental particle of the eukaryote chromosome. Cell. 1999;98:285–294. doi: 10.1016/s0092-8674(00)81958-3. [DOI] [PubMed] [Google Scholar]
- 2.Narlikar GJ, Fan HY, Kingston RE. Cooperation between complexes that regulate chromatin structure and transcription. Cell. 2002;108:475–487. doi: 10.1016/s0092-8674(02)00654-2. [DOI] [PubMed] [Google Scholar]
- 3.Khorasanizadeh S. The nucleosome: from genomic organization to genomic regulation. Cell. 2004;116:259–272. doi: 10.1016/s0092-8674(04)00044-3. [DOI] [PubMed] [Google Scholar]
- 4.Yuan GC, et al. Genome-scale identification of nucleosome positions in S. cerevisiae. Science. 2005;309:626–630. doi: 10.1126/science.1112178. [DOI] [PubMed] [Google Scholar]
- 5.Sekinger EA, Moqtaderi Z, Struhl K. Intrinsic histone–DNA interactions and low nucleosome density are important for preferential accessibility of promoter regions in yeast. Mol Cell. 2005;18:735–748. doi: 10.1016/j.molcel.2005.05.003. [DOI] [PubMed] [Google Scholar]
- 6.Buck MJ, Lieb JD. A chromatin-mediated mechanism for specification of conditional transcription factor targets. Nature Genet. 2006;38:1446–1451. doi: 10.1038/ng1917. [DOI] [PMC free article] [PubMed] [Google Scholar]
- 7.Liu X, Lee CK, Granek JA, Clarke ND, Lieb JD. Whole-genome comparison of Leu3 binding in vitro and in vivo reveals the importance of nucleosome occupancy in target site selection. Genome Res. 2006;16:1517–1528. doi: 10.1101/gr.5655606. [DOI] [PMC free article] [PubMed] [Google Scholar]
- 8.Workman JL. Nucleosome displacement in transcription. Genes Dev. 2006;20:2009–2017. doi: 10.1101/gad.1435706. [DOI] [PubMed] [Google Scholar]
- 9.Miller JA, Widom J. Collaborative competition mechanism for gene activation in vivo. Mol Cell Biol. 2003;23:1623–1632. doi: 10.1128/MCB.23.5.1623-1632.2003. [DOI] [PMC free article] [PubMed] [Google Scholar]
- 10.Kaffman A, Herskowitz I, Tjian R, O’Shea EK. Phosphorylation of the transcription factor PHO4 by a cyclin-CDK complex, PHO80–PHO85. Science. 1994;263:1153–1156. doi: 10.1126/science.8108735. [DOI] [PubMed] [Google Scholar]
- 11.O’Neill EM, Kaffman A, Jolly ER, O’Shea EK. Regulation of PHO4 nuclear localization by the PHO80–PHO85 cyclin–CDK complex. Science. 1996;271:209–212. doi: 10.1126/science.271.5246.209. [DOI] [PubMed] [Google Scholar]
- 12.Komeili A, O’Shea EK. Roles of phosphorylation sites in regulating activity of the transcription factor Pho4. Science. 1999;284:977–980. doi: 10.1126/science.284.5416.977. [DOI] [PubMed] [Google Scholar]
- 13.Magbanua JP, Fujisawa K, Ogawa N, Oshima Y. The homeodomain protein Pho2p binds at an A/T-rich segment flanking the binding site of the basic-helix–loop-helix protein Pho4p in the yeast PHO promoters. Yeast. 1997;13:1299–1308. doi: 10.1002/(SICI)1097-0061(199711)13:14<1299::AID-YEA178>3.0.CO;2-A. [DOI] [PubMed] [Google Scholar]
- 14.Springer M, Wykoff DD, Miller N, O’Shea EK. Partially phosphorylated Pho4 activates transcription of a subset of phosphate-responsive genes. PLoS Biol. 2003;1:E28. doi: 10.1371/journal.pbio.0000028. [DOI] [PMC free article] [PubMed] [Google Scholar]
- 15.Ogawa N, et al. Structure and distribution of specific cis-elements for transcriptional regulation of PHO84 in Saccharomyces cerevisiae. Mol Gen Genet. 1995;249:406–416. doi: 10.1007/BF00287102. [DOI] [PubMed] [Google Scholar]
- 16.Vogel K, Horz W, Hinnen A. The two positively acting regulatory proteins PHO2 and PHO4 physically interact with PHO5 upstream activation regions. Mol Cell Biol. 1989;9:2050–2057. doi: 10.1128/mcb.9.5.2050. [DOI] [PMC free article] [PubMed] [Google Scholar]
- 17.Ogawa N, Hayashi N, Saito H, Noguchi K, Yamashita Y. In: Phosphate in Microorganisms: Cellular and Molecular Biology. Torriani-Gorini A, Yagil E, Silver S, editors. American Society for Microbiology; Washington DC: 1994. pp. 56–62. [Google Scholar]
- 18.Almer A, Rudolph H, Hinnen A, Horz W. Removal of positioned nucleosomes from the yeast PHO5 promoter upon PHO5 induction releases additional upstream activating DNA elements. EMBO J. 1986;5:2689–2696. doi: 10.1002/j.1460-2075.1986.tb04552.x. [DOI] [PMC free article] [PubMed] [Google Scholar]
- 19.Barbaric S, Munsterkotter M, Goding C, Horz W. Cooperative Pho2-Pho4 interactions at the PHO5 promoter are critical for binding of Pho4 to UASp1 and for efficient transactivation by Pho4 at UASp2. Mol Cell Biol. 1998;18:2629–2639. doi: 10.1128/mcb.18.5.2629. [DOI] [PMC free article] [PubMed] [Google Scholar]
- 20.Korber P, Luckenbach T, Blaschke D, Horz W. Evidence for histone eviction in trans upon induction of the yeast PHO5 promoter. Mol Cell Biol. 2004;24:10965–10974. doi: 10.1128/MCB.24.24.10965-10974.2004. [DOI] [PMC free article] [PubMed] [Google Scholar]
- 21.Fisher F, Goding CR. Single amino acid substitutions alter helix–loop–helix protein specificity for bases flanking the core CANNTG motif. EMBO J. 1992;11:4103–4109. doi: 10.1002/j.1460-2075.1992.tb05503.x. [DOI] [PMC free article] [PubMed] [Google Scholar]
- 22.Maerkl SJ, Quake SR. A systems approach to measuring the binding energy landscapes of transcription factors. Science. 2007;315:233–237. doi: 10.1126/science.1131007. [DOI] [PubMed] [Google Scholar]
- 23.Svaren J, Schmitz J, Horz W. The transactivation domain of Pho4 is required for nucleosome disruption at the PHO5 promoter. EMBO J. 1994;13:4856–4862. doi: 10.1002/j.1460-2075.1994.tb06812.x. [DOI] [PMC free article] [PubMed] [Google Scholar]
- 24.Venter U, Svaren J, Schmitz J, Schmid A, Horz W. A nucleosome precludes binding of the transcription factor Pho4 in vivo to a critical target site in the PHO5 promoter. EMBO J. 1994;13:4848–4855. doi: 10.1002/j.1460-2075.1994.tb06811.x. [DOI] [PMC free article] [PubMed] [Google Scholar]
- 25.Thomas MR, O’Shea EK. An intracellular phosphate buffer filters transient fluctuations in extracellular phosphate levels. Proc Natl Acad Sci USA. 2005;102:9565–9570. doi: 10.1073/pnas.0501122102. [DOI] [PMC free article] [PubMed] [Google Scholar]
- 26.Boeger H, Griesenbeck J, Strattan JS, Kornberg RD. Nucleosomes unfold completely at a transcriptionally active promoter. Mol Cell. 2003;11:1587–1598. doi: 10.1016/s1097-2765(03)00231-4. [DOI] [PubMed] [Google Scholar]
- 27.Adkins MW, Howar SR, Tyler JK. Chromatin disassembly mediated by the histone chaperone Asf1 is essential for transcriptional activation of the yeast PHO5 and PHO8 genes. Mol Cell. 2004;14:657–666. doi: 10.1016/j.molcel.2004.05.016. [DOI] [PubMed] [Google Scholar]
- 28.Adkins MW, Tyler JK. Transcriptional activators are dispensable for transcription in the absence of Spt6-mediated chromatin reassembly of promoter regions. Mol Cell. 2006;21:405–416. doi: 10.1016/j.molcel.2005.12.010. [DOI] [PubMed] [Google Scholar]
- 29.Dhasarathy A, Kladde MP. Promoter occupancy is a major determinant of chromatin remodeling enzyme requirements. Mol Cell Biol. 2005;25:2698–2707. doi: 10.1128/MCB.25.7.2698-2707.2005. [DOI] [PMC free article] [PubMed] [Google Scholar]
- 30.Cormack BP, et al. Yeast-enhanced green fluorescent protein (yEGFP)a reporter of gene expression in Candida albicans. Microbiology. 1997;143:303–311. doi: 10.1099/00221287-143-2-303. [DOI] [PubMed] [Google Scholar]
- 31.Shimizu T, et al. Crystal structure of PHO4 bHLH domain–DNA complex: flanking base recognition. EMBO J. 1997;16:4689–4697. doi: 10.1093/emboj/16.15.4689. [DOI] [PMC free article] [PubMed] [Google Scholar]
- 32.Barbaric S, Fascher KD, Horz W. Activation of the weakly regulated PHO8 promoter in S. cerevisiae: chromatin transition and binding sites for the positive regulatory protein PHO4. Nucleic Acids Res. 1992;20:1031–1038. doi: 10.1093/nar/20.5.1031. [DOI] [PMC free article] [PubMed] [Google Scholar]
- 33.Kellis M, Patterson N, Endrizzi M, Birren B, Lander ES. Sequencing and comparison of yeast species to identify genes and regulatory elements. Nature. 2003;423:241–254. doi: 10.1038/nature01644. [DOI] [PubMed] [Google Scholar]
- 34.Kent WJ, et al. The human genome browser at UCSC. Genome Res. 2002;12:996–1006. doi: 10.1101/gr.229102. [DOI] [PMC free article] [PubMed] [Google Scholar]
Associated Data
This section collects any data citations, data availability statements, or supplementary materials included in this article.
Supplementary Materials
Supplementary Information is linked to the online version of the paper at www.nature.com/nature.


