

Abstract
Several lines of evidence suggest that ovarian hormones influence glucose homeostasis, although their exact role in humans has not been clearly defined. In the present study, we sought to test the hypothesis that ovarian hormones regulate glucose homeostasis by examining the effect of pharmacologically-induced ovarian hormone deficiency on glucose disposal and insulin secretion. Young, healthy women with regular menstrual patterns were studied during the follicular and luteal phases of their cycle at baseline and after two months of treatment with gonadotropin-releasing hormone agonist (GnRHa; n=7) or placebo (n=6). Using hyperglycemic clamps, in combination with stable isotope-labeled (i.e., 13C and 2H) glucose tracers, we measured glucose disposal and insulin secretion. Additionally, we assessed body composition and regional fat distribution using radiologic imaging techniques, as well as glucoregulatory hormones. Ovarian hormone suppression with GnRHa did not alter body composition, abdominal fat distribution or thigh tissue composition. There was no effect of ovarian suppression on total, oxidative or non-oxidative glucose disposal expressed relative to plasma insulin level. Similarly, no effect of ovarian hormone deficiency was observed on first- or second phase insulin secretion or insulin clearance. Finally, ovarian hormone deficiency was associated with an increase in circulating adiponectin levels, but no change in leptin concentration. Our findings suggest that a brief period of ovarian hormone deficiency in young, healthy eugonadal women does not alter glucose disposal index or insulin secretion, supporting the conclusion that ovarian hormones play a minimal role in regulating glucose homeostasis. Our data do, however, support a role for ovarian hormones in the regulation of plasma adiponectin levels.
INTRODUCTION
Tissue insulin sensitivity and pancreatic ∃-cell responsiveness decrease with age (1, 25), contributing to worsening glucose tolerance and, in some individuals, development of Type II diabetes. In women, these age-related changes may accelerate following menopause (30, 37, 56, 57), leading to the hypothesis that ovarian hormone deficiency impairs insulin secretion and/or action. Supporting this notion are studies demonstrating that replacement of ovarian hormones in postmenopausal women enhances glucoregulation (4, 10, 18, 29, 30, 54). In fact, large clinical trials have shown that postmenopausal hormone replacement reduces the risk of developing diabetes (26, 31, 41). Collectively, these findings suggest that ovarian hormones regulate glucose homeostasis in a manner that may confer protection against the subsequent development of diabetes.
There is a considerable amount of evidence, however, that contradicts this conclusion. For instance, some investigations comparing pre- and postmenopausal women have found no differences in insulin sensitivity (47) or greater insulin sensitivity in postmenopausal women (56). Moreover, other studies have shown either no effect or deleterious effects of ovarian hormone replacement therapy on glucose homeostasis in postmenopausal women (17, 21, 42, 43, 53, 55) that is corrected upon cessation of therapy (43). Finally, studies performed at different times of the menstrual cycle that correspond with relative ovarian hormone deficiency and excess have suggested detrimental effects of ovarian hormones on glucose homeostasis (13, 38, 50). The reason(s) for differing results among studies are not clear, but probably relate to the variety of experimental paradigms employed, the nature of the hormonal stimulus (e.g., endogenous vs. exogenous) and differences in the populations studied with respect to age, adiposity, activity level and other factors. Regardless of an explanation for these disparities, on balance, there is no clear consensus that emerges regarding the role of ovarian hormones in the regulation of glucose homeostasis.
The primary goal of this study was to examine the role of ovarian hormones in the regulation of glucose disposal and insulin secretion. To accomplish this objective, we studied young, healthy, non-obese women with normal menstrual cyclicity before and after two months of treatment with gonadotropin-releasing hormone agonist (GnRHa) or placebo. GnRHa administration down-regulates the production and release from the pituitary of luteinizing hormone and follicle-stimulating hormone, rapidly inducing a state of hypogonadotropic hypogonadism with consequent reductions in ovarian hormones to postmenopausal levels. This experimental paradigm provides the unique opportunity of studying the effects of ovarian hormone deficiency using a within-subjects design. We chose a short treatment period of two months to minimize the effects of ovarian hormone deficiency on other physiologic/metabolic systems, such as blood flow (8) or adiposity (49), that might confound our ability to detect an effect of the hormones on glucose homeostasis. Insulin secretion and clearance and intracellular pathways of glucose disposal were measured during hyperglycemic clamps from insulin and c-peptide levels, stable isotope labeled glucose tracer kinetics and indirect calorimetry. We hypothesized that ovarian hormone suppression with GnRHa would reduce glucose disposal by decreasing flux through the non-oxidative pathway and decrease insulin secretion. In addition, to examine whether ovarian suppression might influence glucose homeostasis through modulation of other hormonal systems, we assessed the effect of GnRHa administration on circulating leptin and adiponectin concentrations--glucoregulatory hormones that are thought to be influenced, in part, by sex steroids (20, 24).
MATERIALS AND METHODS
Materials
D-[U-13C]glucose (98% 13C), D-[6,6-2H2]glucose (98% 13C) and sodium [13C]bicarbonate (99% 13C) were obtained from Cambridge Isotope Laboratories (Andover, MA). Leuprolide acetate (Lupron Depot; 3.75 mg) was obtained from TAP Pharmaceuticals (Lake Forest, IL).
Subjects
Fourteen healthy, young women were recruited and 13 women, ranging in age from 22 to 37 yr (mean ± SE; 29 ± 1 yr), completed the study. Women were non-obese (BMI<28 kg/m2; 23.4 ± 0.8 kg/m2), had a stable body weight (±2 kg) for 6 months prior to study, were healthy based on medical history, physical exam and routine blood tests, were glucose tolerant (glucose <7.77 mmol/L 2 h following 75 g oral glucose load), had no history of tobacco use and were not on any medication that could affect glucose metabolism or ovarian/reproductive function. None of the volunteers had been exposed to any form of hormone-based contraceptive therapy for at least 6 months prior to study and reported having at least 2 spontaneous cycles in the 3 months prior to recruitment and a cycle length of between 25 and 32 days. The nature, purpose and possible risks of the study were explained to each subject before she gave written consent to participate. The experimental protocol was approved by the Committee on Human Research at the University of Vermont.
Experimental protocol
Each volunteer underwent an outpatient screening visit at which time medical history, physical examination, biochemical laboratory tests, an exercise stress test and an oral glucose tolerance test were performed. Volunteers that met the eligibility criteria were randomized using a stratified (age and body mass index) block approach to receive the GnRHa leuprolide acetate (n=7; Lupron Depot; 3.75 mg IM; 28 ± 2 yr) or placebo (n=7; 0.9% saline; 30 ± 2; P=0.439). Prior to study, each volunteer=s menstrual cycle was monitored for at least 2 cycles using menstrual diaries, ovulation prediction kits (Ovu-Quick One-Step; Quidel Co; San Diego, CA) and mid-luteal phase blood draws to discern length of the cycle and follicular and luteal phases.
Each woman underwent metabolic testing on three occasions: two prior to treatment and one following treatment. Baseline testing occurred during the early- to mid-follicular phase (cycle day 3 to 8) and during the mid-luteal phase (cycle day 19 to 25). The order of baseline metabolic testing with respect to cycle phase (follicular-luteal or luteal-follicular) was randomized. Following baseline testing, GnRHa or placebo was administered by intramuscular injection during the mid-luteal phase. On average, the second injection was given 30 d following the first injection in the GnRHa group and 29 d following the first injection in the placebo group. Post-treatment metabolic testing was performed on average 56 d following the first injection in the GnRHa group and 58 d following the first injection in the placebo group. Post-treatment testing in the placebo group was performed during the same phase of the cycle as the 2nd baseline testing period. Women in the placebo group underwent evaluations in one of two testing orders: follicular-luteal-luteal or luteal-follicular-follicular. Thus, post-treatment testing was randomized in volunteers in the placebo group in accordance with baseline testing order. Directly preceding each bout of metabolic testing, volunteers were provided 3 d of a weight-maintenance, standardized diet (20% protein, 25% fat and 55% carbohydrate) by the General Clinical Research Center (GCRC) Metabolic Kitchen. The diet was designed to provide at least 1 g of protein per kilogram of body weight and 200 g of carbohydrate per day and was identical for each bout of testing.
Insulin secretion and glucose metabolism measurements were performed under hyperglycemic conditions the morning following an overnight visit to the General Clinical Research Center. Volunteers were fasted after 1900 h the evening of admission. At approximately 0600 h, catheters were placed in an antecubital vein for infusion and retrograde in a dorsal hand vein for blood draws. Baseline blood and breath samples were taken and primed (3.46 mg/kg and 0.131 mg/kg), continuous (0.048 mg/kg/min and 1.82 ug/kg/min) infusions of [6,6-2H2] and [U-13C]glucose were started and maintained for 240 min. The bicarbonate pool was primed (10.6:mol/kg) with sodium [13C]bicarbonate. At 120 min, a variable rate priming dose of 20% dextrose was started (120 to 140 min), followed by a variable rate infusion (140 to 240 min), with the goal of obtaining a steady-state plasma glucose level of 125 mg/dL above fasting glucose level. Both [6,6-2H2] and [U-13C]glucose were added to the 20% dextrose infusate prior to the study to preserve steady-state plasma enrichments. Plasma glucose level was monitored every 2 minutes during the first 20 minutes of the clamp and every 5 minutes thereafter and the dextrose infusion rate adjusted to achieve the hyperglycemic target. All infusions were stopped at 240 min except for the dextrose infusion, which was continued and tapered until no longer required to maintain normal glycemia. Problems with IV access in one patient in the placebo group during luteal phase and post-treatment testing rendered portions or all of her clamp study data unusable for analysis. Because of this, the final sample sizes were n=6 for placebo and n=7 for GnRHa for all analyses.
Blood and breath samples were drawn at 90, 100, 110 and 120 min for measurement of basal and at 210, 220, 230 and 240 min for measurement of clamp glucose kinetics. Blood samples were drawn at 2 minute intervals from 120 to 140 minutes and then at 15 minute intervals thereafter for the determination of plasma insulin and c-peptide levels. Oxygen consumption and carbon dioxide production rates were determined at 60 and 210 min using the ventilated hood technique (DeltaTrac, Yorba Linda, CA). Oxygen consumption data were not available on two volunteers during the baseline clamp measurements (1 during follicular and 1 during luteal phase evaluation) because of technical problems.
Body composition
Body mass was measured on a metabolic scale (Scale-Tronix, Inc.; Wheaton, IL). Fat mass, fat-free mass and bone mineral mass were each measured by dual energy x-ray absorptiometry using a GE Lunar Prodigy densitometer (GE Lunar Co, Madison, WI). Bone mineral mass data are not presented.
Computed tomography
Abdominal adipose tissue areas and mid-thigh fat and muscle areas were measured by computed tomography with a Phillips Brilliance 40 or 64 computed tomography scanner (Phillips Medical Systems, Cleveland, OH), as described previously (48). For the mid-thigh scan, the mid-point between the anterior superior illiac crest and the proximal aspect of the patella was measured using external landmarks and the midpoint marked on the patients thigh. For all scans, the mark for the mid-thigh scan was placed at the same point. Images from these scans were analyzed using NIH Image software (Image J 1.36b) to determine adipose tissue and muscle areas, as described previously (48). Mid-thigh tissue composition measurements were not performed in two patients (1 in each group) post-treatment because of logistical problems.
Analytical methods
Serum insulin was measured by radioimmunoassay (Linco; St. Louis, MO). The intra- and inter-assay coefficients of variation (CV) for insulin were 3.2% and 4%, respectively. Plasma c-peptide levels were determined by radioimmunoassay (Linco; St. Charles, MO). The intra- and inter-assay CV were 4.6% and 4.9%, respectively. Plasma glucose concentrations were measured by a glucose analyzer (Yellow Springs Instruments; Yellow Springs, OH).
Plasma [6,6-2H2]glucose enrichment was measured by electron impact ionization gas chromatography mass spectrometry (model 5971A, Hewlett-Packard, Palo Alto, CA), as described previously (19). Prior to measurement, glucose was derivatized to the butylboronate acetate derivative. Injections of butylboronate acetyl glucose were made isothermally while monitoring the [M-57]+ ions at a mass to charge ratio (m/z) of 297 and 299 for unlabeled and [6,6-2H2]glucose, respectively.
For plasma glucose 13C measurements, following precipitation and removal of plasma proteins, the methylboronate glucose derivative was prepared (52), as described previously (23). The methylboronate acetate glucose derivatives were measured for 13C content by gas chromatography-combustion-isotope ratio mass spectrometry (23) using a DELTA-Plus instrument with a GCC-III unit (Thermo-Fisher Finnigan, Bremen, Germany) and these data were transformed into mole fraction abundance of 13C, as described (23). Enrichment of 13C was calculated as the difference between the F13C of the sample minus the F13C of a baseline sample taken prior to administration of the isotope and was adjusted for the number of carbons added to the glucose by the derivatization procedure.
The enrichment of expired CO2 was measured by isotope ratio mass spectrometry (PDZ Europa 20/20 ABCA-NT; Crewe, Cheshire, UK).
Calculations
Glucose tracers were used in this study to monitor endogenous glucose production ([6,6-2H2]glucose) and glucose oxidation ([U-13C]glucose). The following section details calculations used to derive these two estimates from tracer kinetic data.
The rate of appearance of glucose (Ra) can be calculated from the [6,6-2H2] tracer as:
| (1) |
where i is the rate of the [6,6-2H2] tracer infusion, Ei is the enrichment of the glucose tracer in the infusate, and Ep is the mean enrichment of the glucose tracer in plasma. During the hyperglycemic clamp, the above equation must be modified to account for the fact that the glucose tracer was infused into the body from two sources: the [6,6-2H2]glucose tracer infusion and the 20% dextrose infusion. Thus, rate of appearance of glucose during the clamp (Ra2H) from the [6,6-2H2]glucose tracer is calculated as:
| (2) |
where i, Ei and Ep are as defined above, EiDEX is the enrichment of [6,6-2H2]glucose in the 20% dextrose infusate, Epclamp is the enrichment of the tracer in the plasma and iDEX is the infusion rate of the 20% dextrose. The glucose Ra data derived from the [6,6-2H2]glucose tracer during the clamp was used to determine endogenous glucose production during the clamp. Total glucose disposal during the clamp was calculated from data collected during 210–240 min as the 20% dextrose infusion rate plus the Ra2H from the [6,6-2H2]glucose tracer. Total glucose disposal was then expressed relative to plasma insulin concentration during the same time period and is referred to as the glucose disposal index.
Using the [U-13C]glucose tracer, we partitioned glucose disposal into oxidative and non-oxidative pathways. To accomplish this, the fraction of [U-13C]glucose tracer infused that was oxidized during the last 30 min of the hyperglycemic clamp (foxclamp) was calculated as:
| (3) |
where F13CO2 clamp is the rate of 13CO2 excretion calculated as the breath 13CO2 enrichment times the carbon dioxide production rate derived from indirect calorimetry, i13C is the infusion rate of the 13C from the [U-13C]glucose tracer and 20% dextrose infusate and 6 is a constant that accounts for the fact that there are 6 13C labels in the [U-13C]glucose tracer. The bicarbonate retention factor for the 13C tracer was assumed to be 1.0 during the hyperglycemic clamp. The foxclamp was then multiplied by the Ra for the [U-13C]glucose tracer (Ra13C) to derive the rate of glucose oxidation during the clamp. Ra13C was calculated as:
| (4) |
where i13C is the infusion rate of the [U-13C6]glucose tracer, Ei13C is the enrichment of the [U-13C6]glucose infusate, iDEX is as defined above, EDEX is the enrichment of the [U-13C6]glucose in the 20% dextrose infusate, and Ep13C is the plasma enrichment of [U-13C6]glucose. As with total glucose disposal, oxidative and non-oxidative disposal were expressed relative to plasma insulin levels.
Insulin secretion was calculated by deconvolution according to the method of van Cauter et al. (51), using c-peptide concentrations. First phase insulin secretion was defined from 120 to 128 min and second phase secretion from 128 to 240 min and is expressed as the area under the curve during these time periods. Insulin clearance was calculated as the ratio of insulin secretion rate to the corresponding plasma insulin concentration from 140 to 240 min and is expressed as the mean of the ratios at each timepoint.
Hormone measurements
Serum levels of estrone, estradiol, testosterone, androstendione and dehydroepiandrosterone were measured by radioimmunoassay. Prior to measurement, steroids were extracted from serum with hexane:ethyl acetate (3:2). Androstendione, dehydroepiandrosterone and testosterone were then separated by Celite column partition chromotography using increasing concentrations of toluene in trimethylpentane. Estrone and estradiol were separated in a similar fashion using ethyl acetate in trimethylpentane. Dehydroepiandrosterone sulfate and sex-hormone binding globulin were measured by direct chemiluminescent immunoassays using the Immulite analyzer (Diagnostic Products Co., Inglewood, CA). Free estradiol and testosterone were calculated using their respective total serum concentration, sex-hormone binding globulin levels and an assumed constant for albumin in a validated algorithm (44). Intra- and interassay CV for steroid hormones and their binding proteins varied from 4 to 8% and 8 to 13%, respectively. The limit of detection for each hormone was as follows: estrone: 4 pg/ml; estradiol: 3 pg/ml; testosterone: 15 pg/ml; DHEA: 30 pg/ml; DHEA-S: 30 ng/ml; androstendione: 30 pg/ml; sex-hormone binding globulin: 0.2 nmol/L. Plasma leptin was measured by ELISA (Linco; St. Charles, MO). The intra- and inter-assay CV for leptin were 5% and 4.9%, respectively. Plasma adiponectin levels were determined by ELISA (R&D systems; Minneapolis, MN). This assay detects total plasma adiponectin levels, which includes, but does not distinguish between, all molecular weight species. The inter-assay CV ranges from 9–13%.
Statistics
Paired t tests were used to compare data between baseline follicular and luteal phase measurements in the entire cohort. For comparison with post-treatment data, follicular and luteal phase measurements were averaged and are referred to as >baseline= values. A 2×2 repeated measures analysis of variance (RMANOVA) model was used with treatment group (GnRHa vs. placebo) as the between subjects factor and time (baseline vs. post-treatment values) as the within-subjects factor. If a significant group X time interaction effect was found, a post hoc analysis was performed to assess the unique effect of time within each group through an analysis of the simple effects. For steroid hormone data, several variables (estrone, estradiol, testosterone) were not normally distributed (Shapiro Wilk test; P<0.05) and remained so after attempts at transformation (e.g., log10). Thus, we evaluated the normality of the distribution of the difference in steroid hormone data between baseline and post-treatment evaluations. For all calculated differences, the assumption of normality was fulfilled. Thus, the calculated difference was compared between groups using an unpaired t test. In addition, Wilcoxon signed rank tests were used to test the difference of estrone and estradiol levels from the each menstrual cycle phase at baseline to post-treatment. All analyses were conducted with SPSS software (SPSS v 15.0; Chicago, IL).
RESULTS
Baseline and post-treatment body composition and fat distribution data are shown in Table 1. Comparing average baseline values between the two groups, women in the placebo group tended (P=0.09) to weigh more than those in the GnRHa group due to the fact that they tended (P=0.07) to be taller (GnRHa: 161 ± 3 vs. placebo: 171 ± 3 cm). No differences were found, however, in body mass index (GnRHa: 23.0 ± 1.2 vs. placebo: 23.9 ± 1.3 kg/m2; P=0.64). Similarly, no differences were found between GnRHa and placebo groups in any index of whole body or regional composition at baseline. Groups were similar at baseline for peak aerobic capacity on an absolute basis (GnRHa: 2.33 ± 0.18 vs. placebo: 2.45 ± 0.22 L/min; P=0.68) or when statistically adjusted for fat-free mass (GnRHa: 2.43 ± 0.17 vs. placebo: 2.33 ± 0.18 L/min; P=0.72). Similarly, there was no effect of time on body mass in either group when considered across all three evaluations (GnRHa: 59.8 ± 3.2 vs. 60.6 ± 3.4 vs. 60.0 ± 3.3 kg; P=0.81 and placebo: 69.3 ± 3.4 vs. 69.1 ± 3.6 vs. 69.6 ± 3.8 kg; P=0.321 for follicular, luteal and post-treatment evaluations, respectively). Finally, comparing baseline and post-treatment data, no group X time interaction effects were found for any whole body or regional tissue composition measure.
Table 1.
Effect of GnRHa administration on total and regional body composition.
| Baseline | Post-treatment | |||
|---|---|---|---|---|
| GnRHa | Placebo | GnRHa | Placebo | |
| Weight (kg) | 60.2 ± 3.3 | 69.2 ± 3.5 | 60.0 ± 3.3 | 69.6 ± 3.8 |
| Fat mass (kg) | 17.4 ± 2.5 | 22.5 ± 1.9 | 17.9 ± 2.6 | 22.9 ± 2.4 |
| Body fat (%) | 28.7 ± 3.0 | 33.5 ± 2.0 | 29.9 ± 2.9 | 33.5 ± 2.4 |
| Fat-free mass (kg) | 41.3 ± 1.2 | 44.7 ± 2.5 | 40.5 ± 1.3 | 45.0 ± 2.6 |
| Appendicular fat-free mass (kg) | 17.6 ± 0.6 | 19.2 ± 1.2 | 17.2 ± 0.6 | 19.5 ± 1.2 |
| Total abdominal fat area (cm2) | 243 ± 45 | 299 ± 35 | 253 ± 45 | 303 ± 37 |
| Subcutaneous abdominal fat area (cm2) | 194 ± 42 | 249 ± 33 | 199 ± 43 | 251 ± 36 |
| Intra-abdominal fat area (cm2) | 48 ± 4 | 50 ± 7 | 54 ± 6 | 52 ± 7 |
| Mid-thigh fat area (cm2) | 113 ± 18 | 153 ± 22 | 127 ± 24 | 150 ± 24 |
| Mid-thigh muscle area (cm2) | 111 ± 6 | 118 ± 10 | 107 ± 6 | 116 ± 11 |
Data are mean ± SE. Baseline data represent the average of follicular and luteal phase evaluations. Sample sizes are n=7 and n=6 for GnRHa and placebo groups, respectively, except for mid-thigh tissue composition data, where sample sizes are n=6 and n=5, respectively.
As expected, there were differences in estrone (55 ± 13 vs. 104 ± 14 pg/ml; P<0.01) and estradiol (92 ± 30 vs. 223 ± 27 pg/ml; P<0.01) levels between the follicular and luteal phase of the cycle, respectively. All other hormone levels did not differ significantly with menstrual cycle phase.
The effect of ovarian suppression on serum steroid levels and binding proteins is shown in Table 2. Testosterone, free testosterone and androstenedione decreased with treatment in the GnRHa group compared to placebo (P<0.05); whereas, other hormone levels were unaffected. Because estrone and estradiol differed by menstrual cycle phase, we also evaluated the difference between each hormone measured at follicular and luteal phase evaluations compared to the post-treatment evaluation. In the GnRHa group, post-treatment estrone and estradiol levels were lower than either follicular or luteal phase evaluations (P<0.05 for all). In the placebo group, no difference was found between follicular and post-treatment estrone and estradiol levels (P=0.917 for both); whereas, estrone level was lower post-treatment compared to luteal phase (P<0.05) and estradiol level tended to be lower (P=0.08). Importantly, ovarian suppression was confirmed in all volunteers in the GnRHa group 10 d following the first injection, as indicated by plasma estradiol level <50 pg/ml, and was confirmed at post-treatment testing (range: 4–15 pg/ml).
Table 2.
Effect of GnRHa administration on steroid hormone and binding protein levels.
| Baseline | Post-treatment | |||
|---|---|---|---|---|
| GnRHa | Placebo | GnRHa | Placebo | |
| Estrone (pg/ml) | 69 ± 10 | 92 ± 24 | 19 ± 2 | 60 ± 11 |
| Estradiol (pg/ml) | 129 ± 15 | 190 ± 51 | 9.8 ± 1.4 | 122 ± 28 |
| Free estradiol (pg/ml) | 2.98 ± 0.35 | 4.32 ± 0.98 | 0.24 ± 0.05 | 2.83 ± 0.64 |
| Testosterone (ng/dL) | 38 ± 2 | 36 ± 4 | 20 ± 2 * | 34 ± 8 |
| Free testosterone (ng/dL) | 6.54 ± 0.38 | 6.21 ± 0.59 | 3.87 ± 0.58 * | 6.15 ± 1.47 |
| DHEA (nmol/L) | 6.53 ± 1.24 | 6.46 ± 0.44 | 7.39 ± 2.30 | 5.73 ± 0.70 |
| DHEA-S (μg/dL) | 123 ± 25 | 112 ± 19 | 124 ± 28 | 93 ± 14 |
| Androstenedione (ng/ml) | 1.37 ± 0.05 | 1.27 ± 0.11 | 0.72 ± 0.11 * | 1.06 ± 0.15 |
| Sex hormone binding globulin (nmol/L) | 57 ± 4 | 56 ± 6 | 51 ± 7 | 54 ± 7 |
Data are mean ± SE. DHEA, dehydroepiandrosterone; DHEA-S, dehydroepiandrosterone sulfate. Sample sizes are n=7 for GnRHa and n=6 for placebo.
P<0.05, change with treatment different between GnRHa and placebo groups.
The effect of menstrual cycle phase on glycemia (top), insulin (middle) and c-peptide (bottom) levels during the hyperglycemic clamp are shown for follicular and luteal phase evaluations in Figure 1. No effect of cycle phase was found on the fasting glucose level (follicular (F): 76 ± 1 vs. luteal (L): 76 ± 1 mg/dL; P=0.97), insulin (F: 9.4 ± 1.2 vs. L: 9.2 ± 1.0 :U/mL; P=0.822) or c-peptide (F: 1.8 ± 0.3 vs. 1.8 ± 0.2 ng/mL; P=0.80) level. There was a small, but significant, difference in average plasma glucose level during the final 30 min of the clamp (F: 197 ± 1 vs. L: 192 ± 2 mg/dL; P<0.01).
Figure 1.
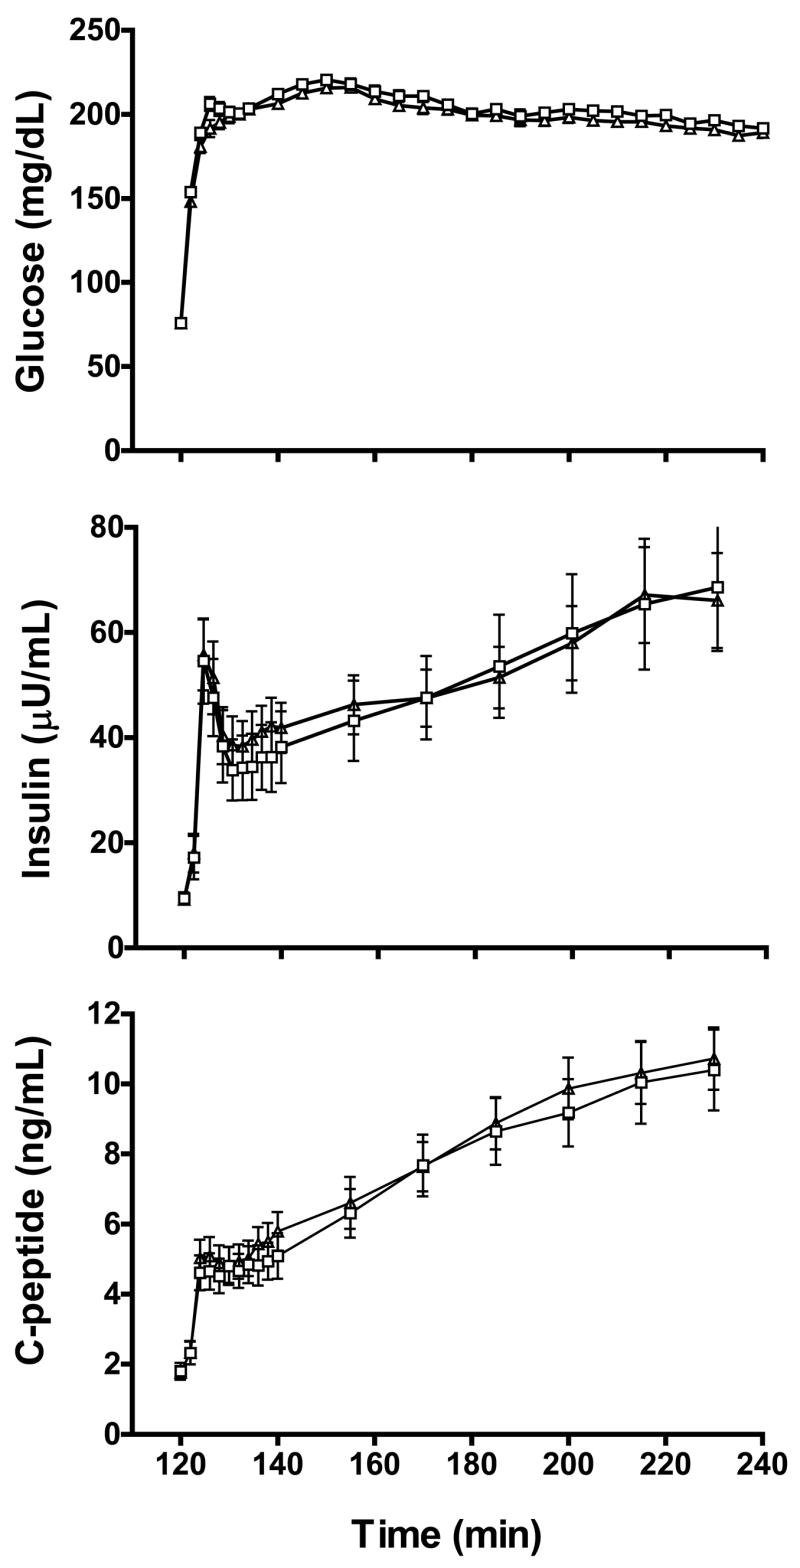
Plasma glucose, insulin and c-peptide levels during the hyperglycemic clamp for follicular (open square) and luteal (open triangle) phases evaluations (n=13). Data are mean ± SE.
Glucose disposal indices and insulin secretion data for follicular and luteal phases of the menstrual cycle are shown in Figure 2. There was no effect of menstrual cycle phase on total glucose disposal normalized to insulin level (F: 12.6 ± 2.2 vs. L: 12.0 ± 1.6 (mg/min)/(:U/mL); P=0.628), or when glucose disposal was not normalized to insulin levels (F: 616 ± 50 vs. 684 ± 63 mg/min; P=0.133). Similarly, there was no effect of cycle phase on residual endogenous glucose production (F: 0.41 ± 0.16 vs. L: 0.40 ± 0.17 (mg/min)/(:U/mL); P=0.903), non-oxidative glucose disposal (F: 11.3 ± 2.2 vs. L: 10.9 ± 1.6 (mg/min)/(:U/mL); P=0.748) or oxidative glucose disposal (F: 1.8 ± 0.5 vs. L: 1.5 ± 0.2 (mg/min)/(:U/mL); P=0.402). Expression of glucose disposal data relative to body mass or fat-free mass yielded no differences between menstrual cycle phases (data not shown). There was a 10% greater area under the curve for the first phase insulin secretory response in the luteal versus the follicular phase of the cycle (F: 3957 ± 554 vs. L: 4420 ± 570 pmol/m2; P<0.01), but no cycle effect on the area under the curve of second phase insulin secretion (F: 47,667 ± 6,243 vs. L: 48,956 ± 4,849 pmol/m2; P=0.552). Because of these cycle-dependent differences, in analyses below, we also examined the effect of GnRHa treatment by comparing post-treatment data to baseline follicular and luteal phase evaluations individually. No effect of cycle phase was found on insulin clearance (F: 1.74 ± 0.19 vs. L: 1.63 ± 0.13 L/min/m2; P=0.33; data not shown in Figure).
Figure 2.
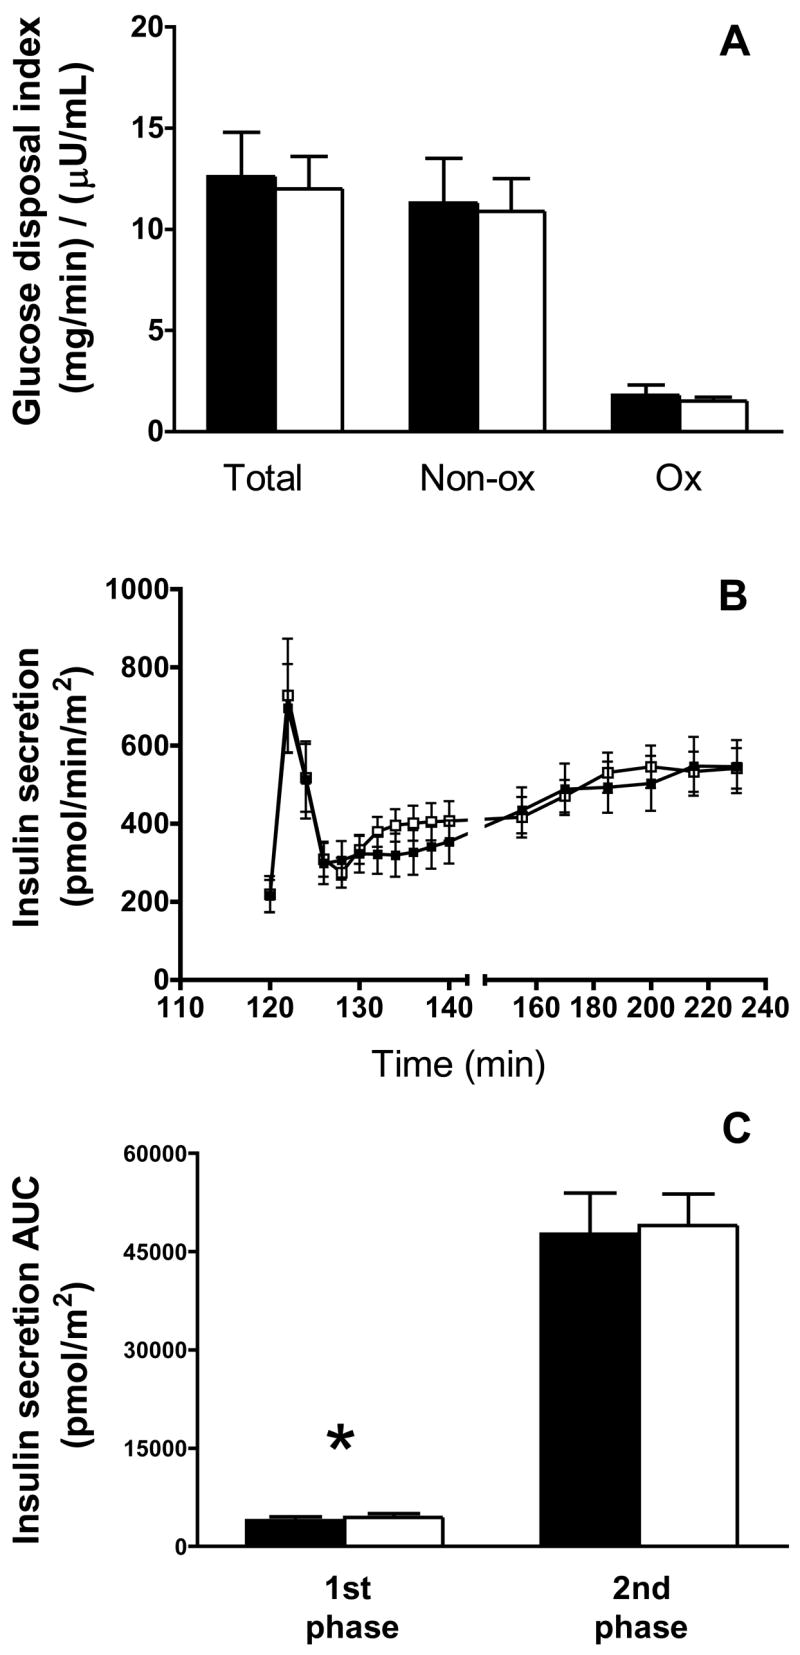
Glucose disposal index (A), insulin secretion (B) and first- and second phase insulin secretory response(C) during follicular (closed bar/symbols) and luteal (open bar/symbols) phase evaluations (n=13). Total glucose disposal data represent the average glucose infusion rate during the last 30 min of the clamp plus residual endogenous glucose disposal derived from [2H2]glucose kinetics and are expressed relative to the average insulin level during the same period. Total glucose disposal was divided into non-oxidative (Non-ox) and oxidative (Ox) disposal pathways. Non-ox was calculated as the difference between total glucose disposal and Ox disposal measured using the [13C6]glucose tracer. For Non-ox and Ox disposal data, n=12 due to the absence of indirect calorimetry data in two patients. Insulin secretory dynamics are calculated from plasma insulin and c-peptide levels, as described in the Materials and Methods. The area under the curve (AUC) was calculated for the first phase (120–128 min) and second phase (128–240 min) insulin secretory responses. Data are mean ± SE. *, P<0.02.
Pre- and post-treatment glucose (top), insulin (middle) and c-peptide (bottom) levels during the hyperglycemic clamp are shown in Figure 3 for GnRHa and placebo groups. There were no group X time interaction effects noted for fasting plasma glucose (GnRHa: 75 ± 2 to 76 ± 1 vs. placebo: 77 ± 1 to 75 ± 2 mg/dL; P= 0.298), insulin (GnRHa: 10 ± 1 to 11± 2 vs. placebo: 8 ± 1 to 10 ± 2 :U/mL; P=0.677), c-peptide (GnRHa: 1.9 ± 0.4 to 1.9 ± 0.3 vs. placebo: 1.7 ± 0.1 to 1.7 ± 0.2 ng/mL; P=0.887) or mean plasma glucose level during the last 30 min of the clamp (GnRHa: 194 ± 1 to 195 ± 2 vs. placebo: 194 ± 5 to 187 ± 6 mg/dL; P=0.238).
Figure 3.
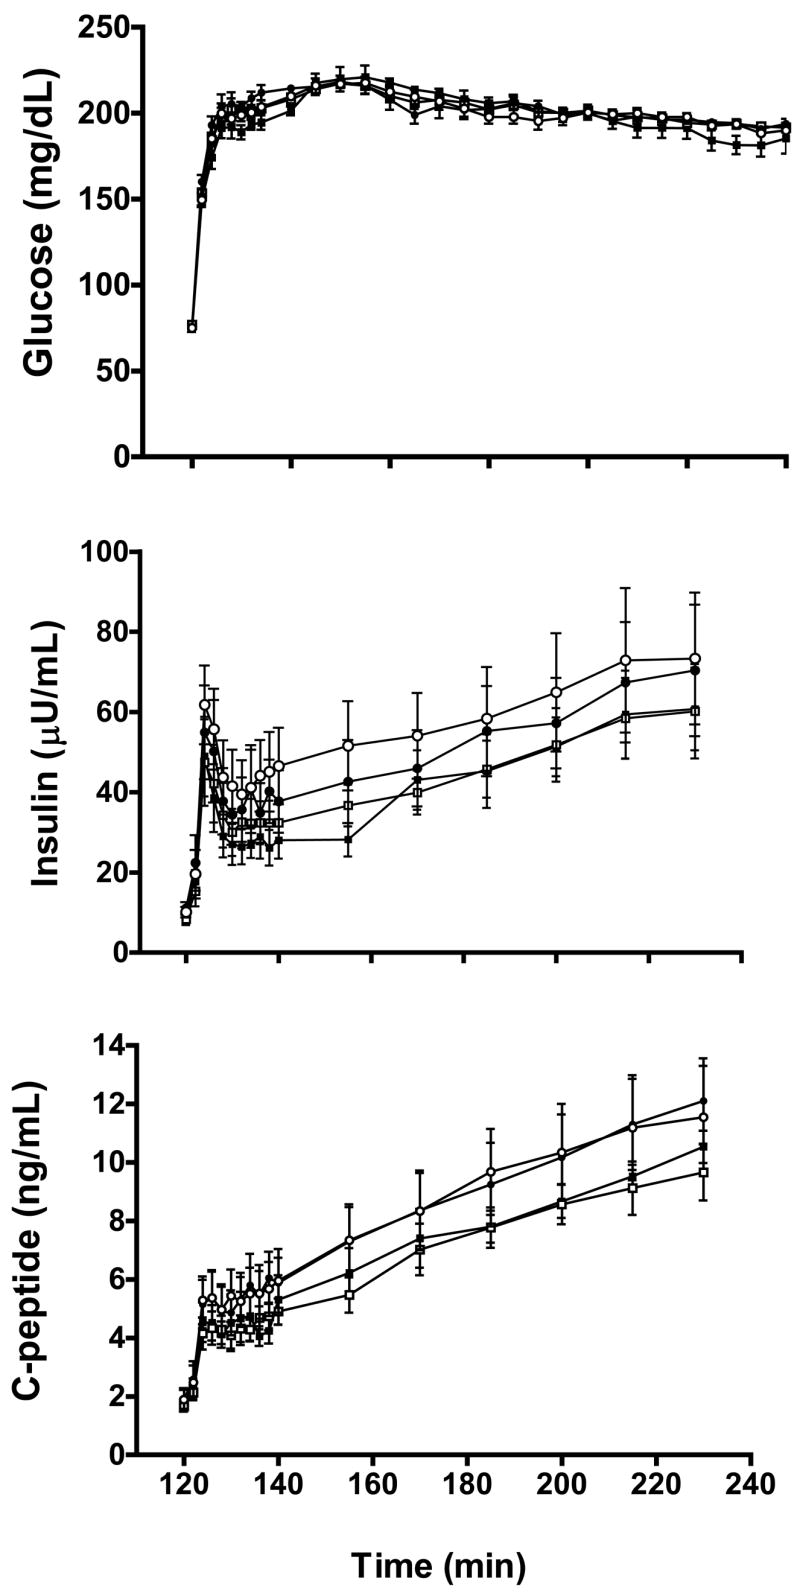
Plasma glucose, insulin and c-peptide levels during the hyperglycemic clamp in GnRHa (circles; n=7) and placebo (squares; n=6) for baseline (open symbols) and post-treatment (closed symbols) evaluations. Data are mean ± SE.
The effect of ovarian suppression on glucose disposal is shown in Figure 4. No group x time interaction effects were noted for total (GnRHa: 11.7 ± 2.5 to 13.4 ± 2.7 vs. placebo: 12.2 ± 2.5 to 13.7 ± 3.4 (mg/min)/(:U/mL); P=0.863), oxidative (GnRHa: 1.36 ± 0.25 to 1.23 ± 0.25 vs. placebo: 1.76 ± 0.38 to 1.68 ± 0.43 (mg/min)/(:U/mL); P=0.783) or non-oxidative (GnRHa: 10.1 ± 2.3 to 12.2 ± 2.5 vs. placebo: 10.5 ± 2.2 to 12.0 ± 3.0 (mg/min)/(:U/mL); P=0.756) glucose disposal expressed relative to plasma insulin level. Similarly, there were no group X time interaction effects for residual endogenous glucose production (GnRHa: 0.33 ± 0.22 to 0.21 ± 0.18 vs. placebo: 0.44 ± 0.20 to 0.54 ± 0.31 (mg/min)/(:U/mL); P=0.514; data not shown in Figure). No group X time interaction effects were found for any glucose disposal data when post-treatment data were compared to either follicular or luteal phase measurements individually (range of P-values: 0.459 to 0.960). Finally, no group X time interaction effects were noted when glucose disposal data were expressed relative to body mass or fat-free mass (data not shown).
Figure 4.
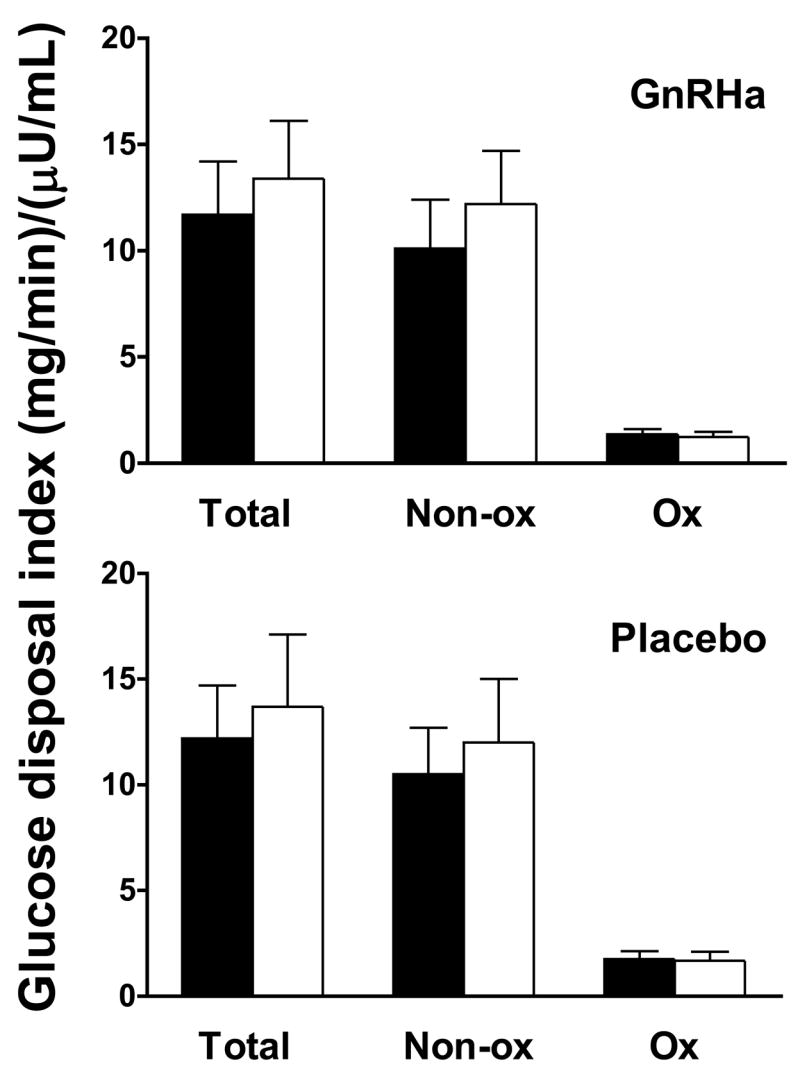
Glucose disposal index (A), insulin secretion (B)and insulin clearance (C) data in GnRHa (n=7) and placebo (n=6) groups for baseline (closed bar/symbols) evaluations. Total glucose disposal data represent the average glucose infusion rate during the last 30 min of the clamp plus residual endogenous glucose disposal derived from [2H2]glucose kinetics and are expressed relative to the average insulin level during the same period. Total glucose disposal during this period was divided into non-oxidative (Non-ox) and oxidative (Ox) disposal pathways. Non-ox was calculated as the difference between total glucose disposal and Ox disposal measured using the [13C6]glucose tracer. Data are mean ± SE.
The effect of GnRHa administration on insulin secretion, first- and second phase insulin secretory responses and insulin clearance are shown in Figure 5. No group X time interaction effect was found for the area under the curve for the first phase (GnRHa: 4745 ± 866 to 4497 ± 849 vs. placebo: 3539 ± 639 to 3687 ± 724 pmol/m2; P=0.201) or second phase (GnRHa: 54327 ± 9412 to 54286 ± 8081 vs. placebo: 41294 ± 3802 to 43905 ± 2905 pmol/m2; P=0.485) insulin secretory response or insulin clearance rates (GnRHa: 1.67 ± 0.16 to 1.87 ± 0.15 vs. placebo: 1.76 ± 0.29 to 2.00 ± 0.38 L/min/m2; P=0.807). Because there were menstrual cycle differences in the first phase insulin secretory response, we also examined the effect of GnRHa administration by comparing the individual menstrual cycle phases to the post-treatment evaluation. However, there was still no group X time interaction effect noted for first phase insulin secretion when post-treatment data were compared to either follicular (P=0.170) or luteal (P=0.385) phases individually.
Figure 5.
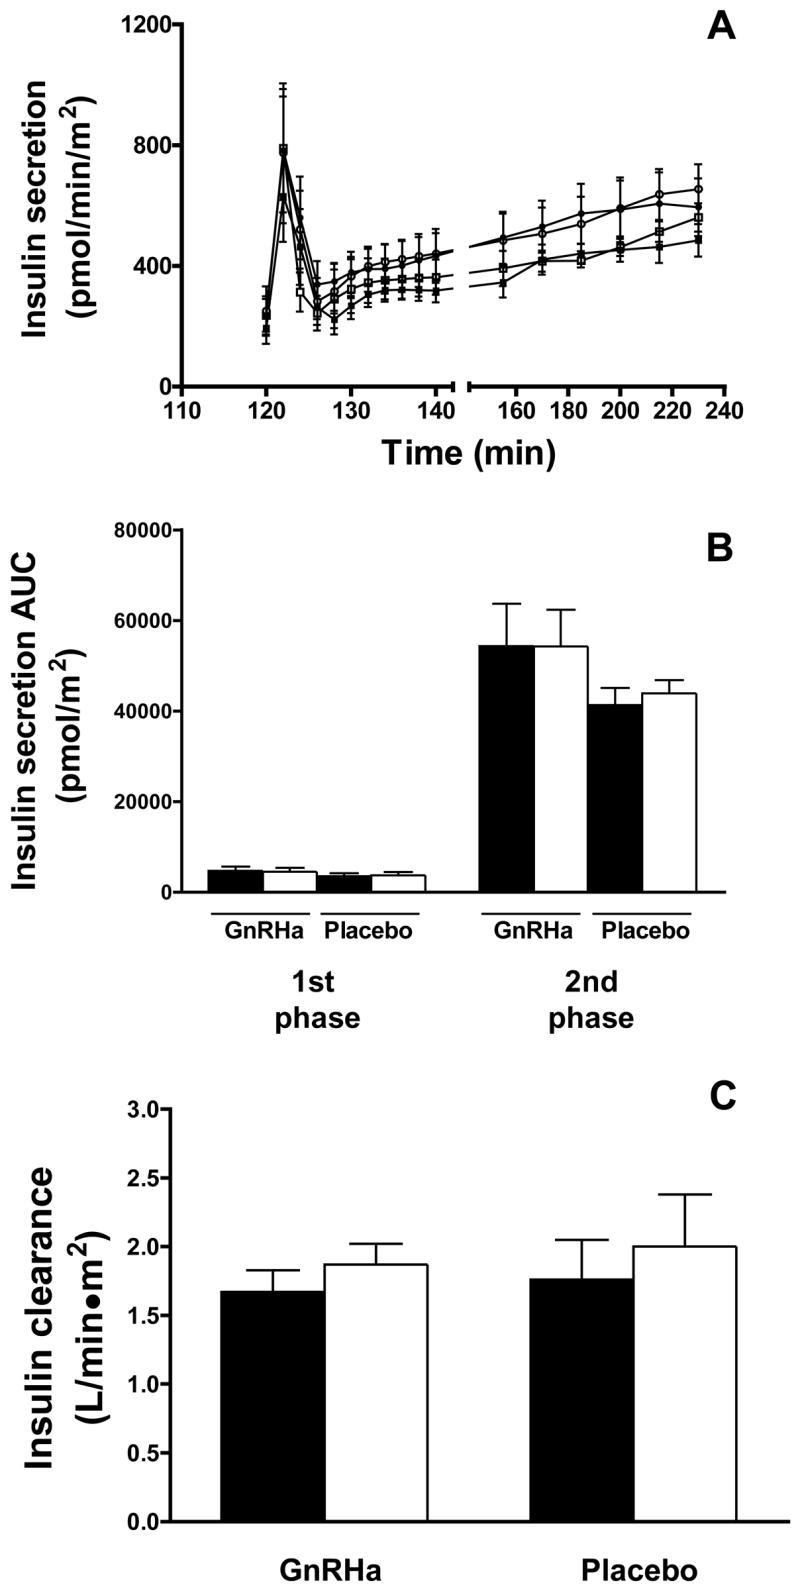
Insulin secretion (A and B) and clearance (C) data in GnRHa (n=7) and placebo (n=6) groups for baseline (open bars/symbols) and post-treatment (closed bar/symbols) evaluations. Insulin secretion data are calculated from plasma c-peptide levels, as described in the Materials and Methods. The area under the curve (AUC) was calculated for the first phase (120–128 min) and second phase (128–240 min) insulin secretory responses. Insulin clearance was calculated as the ratio of insulin secretion rate to the corresponding plasma insulin concentration from 140 to 240 min and is expressed as the mean of the ratios at each timepoint. Data are mean ± SE.
The effects of the menstrual cycle and GnRHa treatment on circulating adipokine levels are shown in Figure 6. No effect of menstrual cycle phase was found on circulating adiponectin (F: 9.54 ± 1.41 vs. L: 10.58 ± 1.98 :g/ml; P=0.269), although a trend towards greater leptin level was observed in the luteal phase (F: 16.00 ± 3.06 vs. L: 18.91 ± 3.02 ng/ml; P=0.09). A significant group X time interaction effect was observed for adiponectin (P<0.01). Further examination of simple effects showed no change in adiponectin in the placebo group (Pre: 9.84 ± 2.17 vs. Post: 8.80 ± 1.80 :g/ml; P=0.154), but a significant increase in the GnRHa group (10.25 ± 2.61 vs. Post: 12.94 ± 2.97 :g/ml; P=0.001). No group X time interaction effect was observed (P=0.786) for leptin when comparing average baseline to post-treatment values (GnRHa: 14.86 ± 3.84 to 14.79 ± 4.67 ng/ml; placebo: 20.58 ± 4.54 to 19.96 ± 4.55 ng/ml), or when follicular or luteal phase evaluations were compared to the post-treatment evaluation individually (P=0.733 and P=0.959, respectively).
Figure 6.
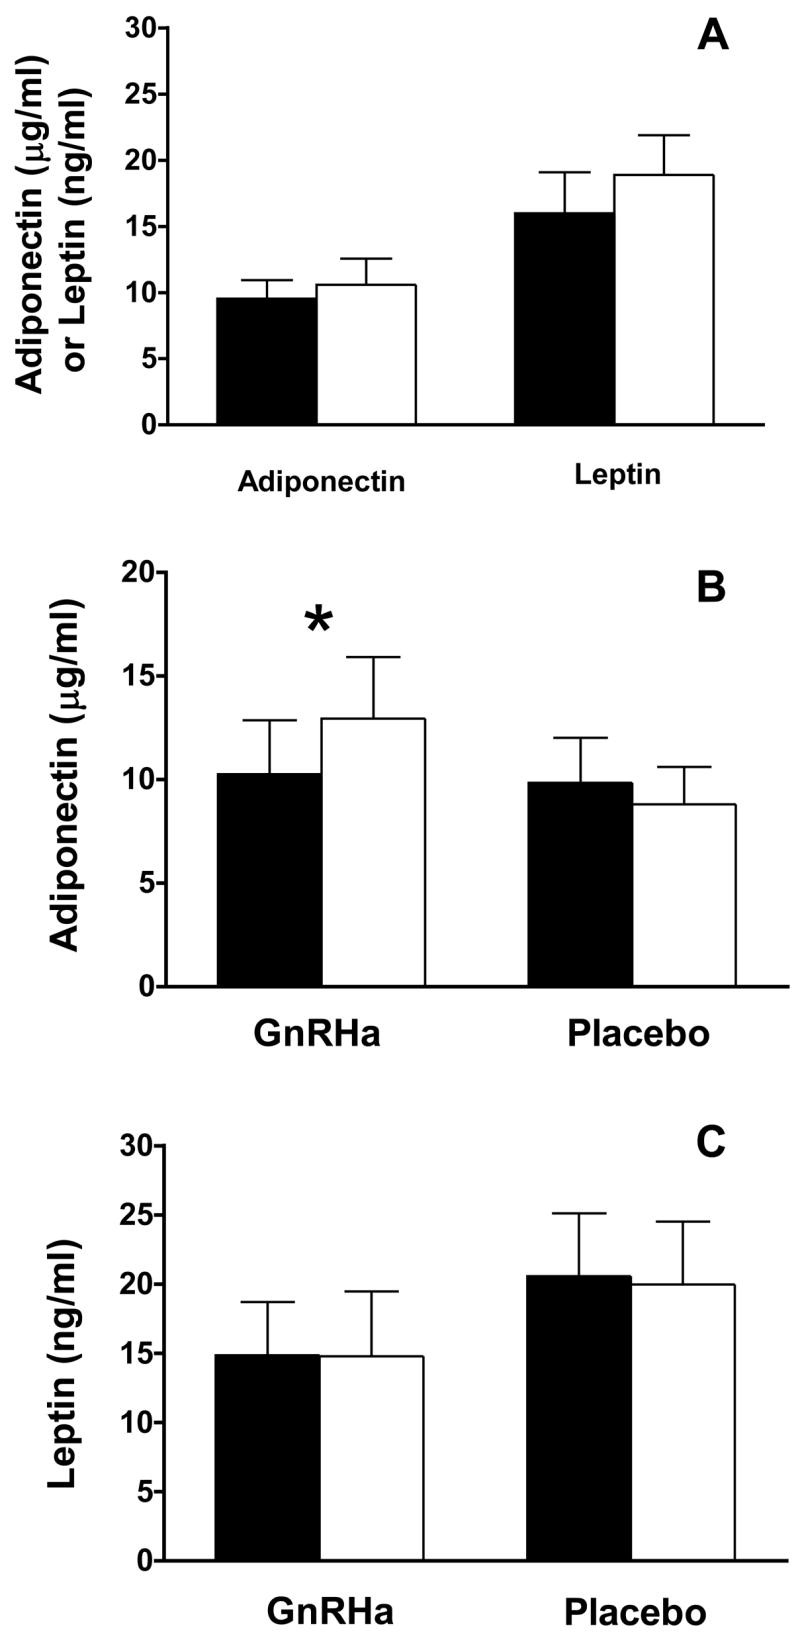
Effect of menstrual cycle phase (A) and GnRHa administration (B and C) on circulating adipokine levels. For all measures, the total sample size is n=13, with n=7 for the GnRHa group and n=6 for the placebo group. A, Follicular phase evaluations are shown as closed bars and luteal phase as open bars. B and C, Baseline are represented by open bars and post-treatment by closed bars. Data are mean ± SE. *, P<0.01 group X time interaction effect; P=0.001 simple effect of time within the GnRHa group.
DISCUSSION
To examine the physiological role of ovarian hormones in the regulation of glucose homeostasis, we measured glucose disposal index and insulin secretion in young, healthy eugonadal women before and after pharmacological suppression of ovarian hormone production with GnRHa. To our knowledge, this is the first study to evaluate, using a randomized, controlled design, the effects of GnRHa treatment on glucose disposal and insulin secretion in healthy, young women with normal menstrual cyclicity. We hypothesized that ovarian suppression would reduce both glucose disposal and insulin secretion. Contrary to this hypothesis, however, we found no effect of two months of GnRHa treatment, and the resulting ovarian hormone deficient state, on either glucose disposal or insulin dynamics in healthy eugonadal women.
GnRHa treatment did not affect glucose disposal index in response to the hyperglycemic clamp stimulus. Our data agree with studies examining the effects of GnRHa on glucose disposal in healthy obese women evaluated using variable hyperglycemic-hyperinsulinemic clamps (15) and in healthy lean women assessed by oral- and intravenous glucose tolerance tests (3). Taken together with our prior results using the hyperinsulinemic clamp (7), these findings suggest that ovarian hormone suppression with GnRHa does not modulate tissue responsiveness to insulin (7) or to the combined effects of insulin and hyperglycemia (3, 15).
Subtle changes in the intracellular pathways of glucose disposal might not be discerned from measurements of total glucose disposal. This is particularly important in the context of ovarian hormones since animal models have shown that hormone deficiency specifically reduces non-oxidative glucose disposal (27, 40). Thus, we partitioned total glucose disposal into oxidative and non-oxidative components using a combination of stable isotope-labeled glucose ([U-13C]glucose) and indirect calorimetry. Similar to total glucose disposal, however, we found no effect of GnRHa on either oxidative or non-oxidative glucose disposal. The reason for disparities between data from humans and animal models is not clear. The effect of ovarian hormones in animals may relate to an indirect effect of ovarian hormone deficiency to induce hyperphagia and, in turn, increase adiposity (39), which would be expected to reduce non-oxidative glucose disposal (28). In contrast, GnRHa treatment in the present study did not alter body weight, adiposity or fat distribution (Table 1), and food intake was controlled for 3 days prior to glucose disposal measurements to eliminate any effects of GnRHa treatment on the antecedent diet. Thus, our results are likely unaffected by either acute or chronic alterations in energy balance. Together with our results using the hyperinsulinemic clamp (7), the current data provide further evidence that a brief period of ovarian hormone deficiency does not alter intracellular pathways of glucose disposal in humans.
GnRHa treatment did not alter first or second phase insulin secretion or insulin clearance. To our knowledge, this is the first study to directly examine the effect of GnRHa treatment on insulin secretion in humans using a controlled, hyperglycemic stimulus. Our results agree with those of Cagnacci et al. (3), who found no effect of one month of GnRHa treatment on plasma insulin and c-peptide responses to either oral or intravenous glucose loads in women. Thus, in healthy women, a brief period of ovarian suppression with GnRHa does not modulate insulin dynamics in response to either oral or intravenous glucose administration.
An important caveat to the present study and others (3, 7, 15) that have used the GnRHa model is that treatment is associated with mild reductions in circulating total and free testosterone, as well as androgenic precursors (Table 2). This complicates the interpretation of our findings if androgens regulate glucose homeostasis. Although pharmacological doses of androgens have minimal effects on insulin secretion, they have been shown to impair glucose disposal in women (11) and endogenous hyperandrogenemia is associated with insulin resistance (16). Moreover, in cross-sectional studies of eugonadal women, variation in serum total and free testosterone within the physiological range is negatively correlated with plasma insulin response during hyperglycemic clamps (22). Thus, one could postulate that our hypothesized effect of GnRHa treatment to reduce glucose disposal and insulin secretion could be masked by a reciprocal effect of reduced androgen levelss to enhance these parameters. Although this scenario is plausible, it is unclear what effect, if any, a reduction in circulating levels of androgens might have on glucoregulation in women with normal androgen levels. In men, GnRHa treatment impairs glucose disposal under hyperglycemic clamp conditions, but has minimal effects on insulin secretion (5). Normal circulating testosterone levels are significantly greater in men and their decline in response to GnRHa (approximately 400 ng/dL) is 20-fold higher than that observed in women in the present study (18 ng/dL). The question then becomes whether such small reductions in testosterone affect glucose disposal and insulin secretion in euandrogenemic women. Preliminary studies from our laboratory have shown, contrary to pharmacological and pathological hyperandrogenemia, that circulating androgens within the physiological range are positively associated with insulin-stimulated glucose disposal in postmenopausal women (Casson et al. unpublished observations); whereas, other studies have shown no relationship between androgen levels and glucose disposal in young, eugonadal women (22). Thus, rather than masking an effect of ovarian hormone deficiency on glucose disposal, GnRHa-induced reductions in testosterone levels may have no effect or could even enhance the suppressive effects of GnRHa treatment on glucose disposal. With respect to insulin secretion, although some studies have shown modest negative correlations between androgen levels and insulin secretion in eugonadal women (22), pharmacological administration of androgens to women has no effect on insulin secretion (11). Moreover, GnRHa treatment in men does not alter plasma insulin response to the hyperglycemic clamp stimulus (5). Based on these data, we believe that androgen levels probably had minimal effects on insulin secretion.
Our results regarding the effect of menstrual cycle phase on glucose metabolism deserve further comment. That menstrual cycle phase did not affect glucose disposal index is at odds with the only other study to use the hyperglycemic clamp to investigate cycle effects on glucose homeostasis, which found reduced glucose disposal during the luteal phase (13). The fact that studies using the hyperinsulinemic clamp from both laboratories (7, 12), as well as others (46, 59), show no effect of menstrual cycle phase on insulin-stimulated glucose disposal suggests that reduced glucose disposal in the luteal phase observed with the hyperglycemic clamp (12) may due to a diminished ability of hyperglycemia to stimulate glucose disposal (i.e., glucose-induced glucose disposal). Unfortunately, no study has directly measured the effect of ovarian hormones on glucose-induced glucose disposal. One study that attempted to experimentally reproduce luteal phase estradiol and progesterone levels by administration of oral micronized estradiol and progesterone failed to find an effect of either hormone alone or in combination on glucose disposal measured under euglycemic and hyperinsulinemic conditions (45), suggesting no effect of these hormones on glucose-induced glucose disposal. Thus, reasons to explain differences between the two studies are not readily apparent. The only notable differences are that the present study had a larger sample size (13 vs. 8) and controlled dietary intake for 3 d prior to the hyperglycemic clamps. With respect to the latter point, the luteal phase of the menstrual cycle is associated with increased energy intake and expenditure (2, 32). If intake exceeds expenditure during the luteal phase, this could result in a brief period of overfeeding that could impair glucose disposal. That this may occur is buttressed by the fact that women are susceptible to impaired glucoregulation in response to short-term energy excess (9). Thus, our attempt to control food intake prior to measurements could have diminished or prevented luteal phase hyperphagia and any corresponding reductions in glucose disposal secondary to energy imbalance. Perhaps most importantly, the absence of reduced glucose disposal index during the luteal phase would not impair our ability to detect an effect of GnRHa on glucose disposal. If anything, the absence of menstrual cycle differences in glucose disposal would enhance, not hinder, our ability to detect an effect of GnRHa.
In addition, we observed a small, but significant, increase in the first phase insulin secretion during the luteal phase. Although to our knowledge no other study has measured insulin secretion rate during the menstrual cycle, our findings differ slightly from other studies that have failed to show altered plasma insulin levels in response to IV glucose (13, 38). Some studies have shown cycle-dependent differences in plasma insulin responses that were similar in magnitude to our study (38), albeit non-significant. Additionally, another study that attempted to experimentally reproduce luteal phase estradiol and progesterone levels by administration of oral micronized estradiol and progesterone found a similar magnitude increase in plasma insulin response to the hyperglycemic clamp (45). Importantly, we should stress that comparison of post-treatment insulin dynamics data to either baseline follicular or luteal phase measurements separately did not reveal an effect of GnRHa, suggesting that any cycle-dependent differences in insulin secretion would not impact the overall conclusions of our study.
A novel result in this study was the increase in plasma adiponectin in women treated with GnRHa. The fact that adiponectin increased in response to GnRHa-induced ovarian suppression is in keeping with cross-sectional data showing a negative relationship between estradiol and adiponectin (20), but contrasts with studies showing that transdermal estradiol increases adiponectin in obese, postmenopausal women with the metabolic syndrome (6). We should note that, as with glucose metabolism, modest decreases in testosterone with GnRHa administration confound the interpretation of our results. Because testosterone decreases circulating adiponectin levels (34, 35, 58), the reduction in circulating testosterone in response to GnRHa could increase adiponectin (35, 58). These inhibitory effects of testosterone on adiponectin, however, have been observed in men, where changes in testosterone (35, 58) are considerably greater than those observed in the present study. If we assume that androgen receptors are present in adipocytes at similar levels in men and women (14) and have similar binding affinities, it seems unlikely that such small changes in androgen levels in women would provoke the observed changes in adiponectin.
Regardless of the hormonal mediator, as adiponectin is believed to sensitize tissues to the effects of insulin, it could be argued that the increase in adiponectin diminished the effect of GnRHa treatment to impair glucose disposal. The relative change in adiponectin in our study, however, was quite modest compared to alterations previously demonstrated to correlate to altered tissue insulin responsiveness (36). Moreover, the effect of adiponectin is thought to derive from alterations in hepatic insulin sensitivity (33, 36); whereas, we found no alterations in the suppression of endogenous glucose production with GnRHa, an index of hepatic insulin sensitivity. Thus, we feel that it is unlikely that changes in adiponectin influenced glucose disposal data.
Our study is limited by small samples sizes. The directionality of some of the observed changes in glucose disposal and insulin secretion, however, were not in accord with our hypotheses. In these instances, our data clearly argue against the notion that ovarian hormone deficiency is of importance for the pathogenesis of glucose intolerance with age. For other variables, such as first phase insulin secretion, the number of volunteers needed to detect a group X time interaction effect concordant with our hypothesis are quite large (>50 per group). In these cases, the question then becomes whether such small changes in outcome variables are physiologically or pathophysiolgically relevant. In other words, if suppression of ovarian hormone concentrations to postmenopausal levels with GnRHa invokes such minor changes in glucose disposal or insulin secretion, one might conclude simply that the hormones play a relatively minor role in the regulation of glucose/insulin homeostasis.
In summary, our study suggests that two months of ovarian hormone deficiency induced by GnRHa administration has no effect on glucose disposal or insulin dynamics. Although we acknowledge the limitation of extrapolating our findings using GnRHa in young, eugonadal women to middle-aged women transitioning to the menopausal state, from a physiological perspective, our data suggest a minor role for endogenous ovarian hormones in the regulation of glucose disposal or insulin secretion. Similarly, we should note that our results are limited to eugonadal women and the lack of effect of GnRHa on glucose metabolism and insulin secretion may not apply to other populations, such as hyperandrogenic women. Our findings do, however, suggest a potential role for ovarian hormones in the regulation of plasma adiponectin levels.
Acknowledgments
The authors would like to thank all the participants who volunteered their time for this study. This work was supported by grants from the NIH (AG-021602; RR-00109).
References
- 1.Basu R, Breda E, Oberg AL, Powell CC, Dalla Man C, Basu AJLV, Klee GG, Puneet A, Jensen MD, Toffolo G, Cobelli C, Rizza RA. Mechanisms of the age-associated deterioration in glucose tolerance: contribution of alterations in insulin secretion, action and clearance. Diabetes. 2003;52:1738–1748. doi: 10.2337/diabetes.52.7.1738. [DOI] [PubMed] [Google Scholar]
- 2.Buffenstein R, Poppitt SD, McDevitt RM, Prentice AM. Food intake and the menstrual cycle: a retrospective analysis, with implications for appetite research. Physiol Behav. 1995;58:1067–1077. doi: 10.1016/0031-9384(95)02003-9. [DOI] [PubMed] [Google Scholar]
- 3.Cagnacci A, Paolletti AM, Arangino S, Melis GB, Volpe A. Effect of ovarian suppression on glucose metabolism of young lean women with and without ovarian hyperandrogenism. Hum Repro. 1999;14:893–897. doi: 10.1093/humrep/14.4.893. [DOI] [PubMed] [Google Scholar]
- 4.Cagnacci A, Soldani R, Carriero PLAMP, Fioretti P, Melis GB. Effects of low doses of trandermal 17beta-estradiol on carbohydrate metabolism in postmenopausal women. J Clin Endocr Metab. 1992;74:1396–1400. doi: 10.1210/jcem.74.6.1317387. [DOI] [PubMed] [Google Scholar]
- 5.Chauhan S, Collens K, Kruger M, Diamond MP. Effect of gonadotropin-releasing -hormone hypogonadism on insulin action as assessed by hyperglycemic clamp studies in men. Fertil Steril. 2004;81:1092–1098. doi: 10.1016/j.fertnstert.2003.08.052. [DOI] [PubMed] [Google Scholar]
- 6.Chu MC, Cosper P, Nakhuda GS, Lobo RA. A comparison of oral and transdermal short-term estrogen therapy in postmenopausal women with metabolic syndrome. Fertil Steril. 2006;86:1669–1675. doi: 10.1016/j.fertnstert.2006.04.043. [DOI] [PubMed] [Google Scholar]
- 7.Cooper BC, Sites CK, Casson PR, Toth MJ. Ovarian suppression with a gonadotropin-releasing hormone agonist does not alter insulin-stimulated glucose disposal. Fertil Steril. 2007;87:1131–1138. doi: 10.1016/j.fertnstert.2006.11.045. [DOI] [PMC free article] [PubMed] [Google Scholar]
- 8.Cooper BC, Sites CK, Fairhurst PA, Toth MJ. Evidence against a role for ovarian hormones in the regulation of blood flow. Fertil Steril. 2006;86:440–447. doi: 10.1016/j.fertnstert.2006.01.017. [DOI] [PubMed] [Google Scholar]
- 9.Cornier MA, Bergman BC, Bessesen DH. The effect of short-term overfeeding on insulin action in lean and reduced-obese individuals. Metab Clin Exp. 2006;55:1207–1214. doi: 10.1016/j.metabol.2006.05.003. [DOI] [PubMed] [Google Scholar]
- 10.Cuccinelli F, aparella P, Soranna L, Barini A, Cinque B, Mancuso S, Lanzone A. Differential effect of transdermal estrogen plus progestagen replacement on insulin metabolism in postmenopasual women: relation to their insulinemic secretion. Eur J Endocrinol. 1999;140:215–223. doi: 10.1530/eje.0.1400215. [DOI] [PubMed] [Google Scholar]
- 11.Diamond MP, Grainger D, Diamond MC, Sherwin RS, DeFronzo RA. Effects of methyltestosterone on insulin secretion and sensitivity in women. J Clin Endocr Metab. 1998;83:4420–4425. doi: 10.1210/jcem.83.12.5333. [DOI] [PubMed] [Google Scholar]
- 12.Diamond MP, Jacob R, Connolly-Diamond M, DeFronzo RA. Glucose metabolism during the menstrual cycle: assessment with the euglycemic, hyperinsulinemic clamp. J Reprod Med. 1993;38:417–421. [PubMed] [Google Scholar]
- 13.Diamond MP, Simonson DC, DeFronzo RA. Menstrual cyclicity has a profound effect on glucose homeostasis. Fertil Steril. 1989;52:204–208. [PubMed] [Google Scholar]
- 14.Dieudonne MN, Pecquery R, Boumediene A, Leneveu MC, Giudicelli Y. Androgen receptors in human preadipocytes and adipocytes: regional specificities and regulation by sex steroids. Am J Physiol. 1998;274:C1645–C1652. doi: 10.1152/ajpcell.1998.274.6.C1645. [DOI] [PubMed] [Google Scholar]
- 15.Dumesic DA, Nielsen MF, Abbott DH, Eisner JR, Nair KS, Rizza RA. Insulin action during variable hyperglycemic-hyperinsulinemic infusions in hyperandrogenic anovulatory patients and healthy women. Fertil Steril. 1999;72:458–466. doi: 10.1016/s0015-0282(99)00265-4. [DOI] [PubMed] [Google Scholar]
- 16.Dunaif A, Segal KR, Futterweit W, Dobrjansky A. Profound peripheral insulin resisance, independent of obesity, in polycystic ovary syndrome. Diabetes. 1989;38:1165–1174. doi: 10.2337/diab.38.9.1165. [DOI] [PubMed] [Google Scholar]
- 17.Duncan AC, Lyall H, Roberts RN, Petrie JR, Perera MJ, Monaghan S, Hart DM, Connell JMC, Lumsden MA. The effect of estradiol and a combined estradiol/progestagen preparation on insulin sensitivity in healthy postmenpausal women. J Clin Endocr Metab. 1999;84:2402–2407. doi: 10.1210/jcem.84.7.5836. [DOI] [PubMed] [Google Scholar]
- 18.Evans EM, Van Pelt RE, Binder EF, Williams DB, Ehsani AA, Kohrt WM. Effects of HRT and exercise training on insulin action, glucose tolerance, and body composition in older women. J Appl Physiol. 2001;90:2033–2040. doi: 10.1152/jappl.2001.90.6.2033. [DOI] [PubMed] [Google Scholar]
- 19.Fong Y, Matthews DE, He W, Marano MA, Moldawer LL, Lowry SF. Whole body and splanchnic leucine, phenylalanine and glucose kinetics during endotoxemia in humans. Am J Physiol. 1994;266:R419–R425. doi: 10.1152/ajpregu.1994.266.2.R419. [DOI] [PubMed] [Google Scholar]
- 20.Gavrilla A, Chan JL, Yiannakouris N, Kontagianni M, Miller LC, Orlova C, Mantzoros CS. Serum adiponectin levels are inversely associated with overall and central fat distribution but are not directly regulated by acute fasting or leptin administration in humans: cross-sectional and interventional studies. J Clin Endocr Metab. 2003;88:4823–4831. doi: 10.1210/jc.2003-030214. [DOI] [PubMed] [Google Scholar]
- 21.Godsland IF, Gangar K, Walton C, Cust MP, Whitehead MI, Wynn V, Stevenson JC. Insulin resistance, secretion, and elimination in postmenopausal women receving oral or transdermal hormone replacement therapy. Metabolism. 1993;42:846–853. doi: 10.1016/0026-0495(93)90058-v. [DOI] [PubMed] [Google Scholar]
- 22.Grainger D, Thornton K, Rossi G, Connoly-Diamond M, DeFronzo RA, Sherwin RS, Diamond MP. Influence of basal androgen lvels in euandrogenic women on glucose homeostasis. Fertil Steril. 1992;58:1113–1118. doi: 10.1016/s0015-0282(16)55553-8. [DOI] [PubMed] [Google Scholar]
- 23.Haisch M, Fukagawa NK, Matthews DE. Oxidation of glutamine by the splanchnic bed in humans. Am J Physiol. 2000;278:E593–E602. doi: 10.1152/ajpendo.2000.278.4.E593. [DOI] [PubMed] [Google Scholar]
- 24.Hardie L, Trayhurn P, Abramovich D, Fowler P. Circulating leptin in women: a longitudinal study in the menstrual cycle and during pregnancy. Clin Endocrinol. 1997;47:101–106. doi: 10.1046/j.1365-2265.1997.2441017.x. [DOI] [PubMed] [Google Scholar]
- 25.Iozzo P, Beck-Nielsen H, Laasko M, Smith U, Yki-Jarvinen H, Ferrannini E. Independent influence of age on basal insulin secretion in nondiabetic humans. J Clin Endocr Metab. 1999;84:863–868. doi: 10.1210/jcem.84.3.5542. [DOI] [PubMed] [Google Scholar]
- 26.Kanaya AM, Herrington D, Vittinghoff E, Lin K, Grady D, Bittner V, Cauley JA, Barrett-Connor E. Glycemic effects of postmenopausal hormone therapy: The Heart and Estrogen/progestin Replacement Study. Ann Intern Med. 2003;138:1–9. doi: 10.7326/0003-4819-138-1-200301070-00005. [DOI] [PubMed] [Google Scholar]
- 27.Kumagai S, Holmang A, Bjorntorp P. The effects of oestrogen and progesterone on insulin sensitivity in female rats. Acta Physiol Scand. 1993;149:91–97. doi: 10.1111/j.1748-1716.1993.tb09596.x. [DOI] [PubMed] [Google Scholar]
- 28.Lillioja S, Mott DM, Zawadzki JK, Young AA, Abbott WG, Bogardus C. Glucose storage is a major determinant of in vivo “insulin resistance” in subjects with normal glucose tolerance. J Clin Endocr Metab. 1986;62:922–927. doi: 10.1210/jcem-62-5-922. [DOI] [PubMed] [Google Scholar]
- 29.Lindheim SR, Duffy DM, Kojima T, Vijod MA, Stanczyk FZ, Lobo RA. The route of administration influences the effect of estrogen on insulin sensitivity in postmenopausal women. Fertil Steril. 1994;62:1176–1180. doi: 10.1016/s0015-0282(16)57181-7. [DOI] [PubMed] [Google Scholar]
- 30.Lindheim SR, presser SC, Ditkoff EC, Vijod MA, Stanczyk FZ, Lobo RA. A possible bimodal effect of estrogen on insulin sensitivity in postmenopausal women and the attenuating effect of added progestin. Fertil Steril. 1993;60:664–667. doi: 10.1016/s0015-0282(16)56218-9. [DOI] [PubMed] [Google Scholar]
- 31.Margolis KL, Bonds DE, Rodabough RJ, Tinker L, Phillips LS, Allen C, Bassford T, Burke G, Torrens J, Howard BV Investigators. ftWsHI. Effect of oestrogen plus progestin on the incidence of diabetes in postmenopausal women: results from the Women’s Health Initiative Hormone Trial. Diabetologia. 2004;47:1175–1187. doi: 10.1007/s00125-004-1448-x. [DOI] [PubMed] [Google Scholar]
- 32.Melanson KJ, Saltzman E, Russell RG, Roberts SB. Postabsorptive and postprandial energy expenditure and substrate oxidation do not change during the menstrual cycle in young women. J Nutr. 1996;126:2531–2538. doi: 10.1093/jn/126.10.2531. [DOI] [PubMed] [Google Scholar]
- 33.Nawrocki AR, Rajala MW, Tomas E, Pajvani UB, Trumbauer ME, Pang Z, Chen AS, Ruderman NB, Chen H, Rossetti L, Scherer PE. Mice lacking adiponectin show decreased hepatic insulin sensitivity and reduced responsiveness to peroxisome proliferator-activated receptor gamma agonists. J Biol Chem. 2006;281:2654–2660. doi: 10.1074/jbc.M505311200. [DOI] [PubMed] [Google Scholar]
- 34.Nishizawa H, Shimomura I, Kishida K, Maeda N, Kuriyama H, Nagaretani H, Matsuda M, Kondo H, Furuyama N, Kihara S, Nakamura T, Tochino Y, Funahashi T, Matsuzawa Y. Androgens decrease plasma adiponectin, an insulin-sensitizing adipocyte-derived protein. Diabetes. 2002;51:2734–2741. doi: 10.2337/diabetes.51.9.2734. [DOI] [PubMed] [Google Scholar]
- 35.Page ST, Herbst KL, Amory JK, Coviello AD, Anawalt BD, Matsumoto AM, Bremner WJ. Testosterone administration supresses adiponectin levels in men. J Androl. 2005;26:85–92. [PubMed] [Google Scholar]
- 36.Pajvani UB, Hawkins M, Combs TP, Rajala MW, Doebber T, Berger JP, Wagner JA, Wu MJ, Knopps A, Xiang AH, Utschneider KM, Kahn SE, Olefsky JM, Buchanan TA, Scherer PE. Complex distribution, not absolute amount of adiponectin, correlates with thiazolidinedione-mediated improvement in insulin sensitivity. J Biol Chem. 2004;279:12152–12162. doi: 10.1074/jbc.M311113200. [DOI] [PubMed] [Google Scholar]
- 37.Proudler AJ, Felton CV, Stevenson JC. Ageing and the response of plasma insulin, glucose and C-peptide concentrations to intravenous glucose in postmenopausal women. Clin Sci. 1992;83:489–494. doi: 10.1042/cs0830489. [DOI] [PubMed] [Google Scholar]
- 38.Pulido JME, Salazar MA. Changes in insulin sensitivity, secretion and glucose effectiveness during the menstrual cycle. Arch Med Res. 1999;30:19–22. doi: 10.1016/s0188-0128(98)00008-6. [DOI] [PubMed] [Google Scholar]
- 39.Richard D. Effects of ovarian hormones on energy balance and brown adipose tissue thermogenesis. Am J Physiol. 1986;250:R245–R249. doi: 10.1152/ajpregu.1986.250.2.R245. [DOI] [PubMed] [Google Scholar]
- 40.Rincon J, Holmang A, Wahlstrom EO, Lonnroth P, Bjorntorp P, Zierath JR, Wallberg-Henriksson H. Mechanisms behind insulin resistance in rat skeletal muscle after oophorectomy and additional testosterone treatment. Diabetes. 1996;45:615–621. doi: 10.2337/diab.45.5.615. [DOI] [PubMed] [Google Scholar]
- 41.Rossi R, Origliani G, Modena MG. Transdermal 17-beta-estradiol and risk of developing type 2 diabetes in a population of healthy, nonobese postmenopausal women. Diabetes Care. 2004;27:645–649. doi: 10.2337/diacare.27.3.645. [DOI] [PubMed] [Google Scholar]
- 42.Ryan AS, Nicklas BJ, Berman DM. Hormone replacement therapy, insulin sensitivity, and abdominal obesity in postmenopausal women. Diabetes Care. 2002;25:127–133. doi: 10.2337/diacare.25.1.127. [DOI] [PubMed] [Google Scholar]
- 43.Sites CK, L’Hommedieu GD, Toth MJ, Brochu M, Cooper BC, Fairhurst PA. The effect of hormone replacement therapy on body composition, body fat distribution, and insulin sensitivity in menopausal women: a randomized, double-blind, placebo-controlled trial. J Clin Endocrinol Metab. 2005;90:2701–2707. doi: 10.1210/jc.2004-1479. [DOI] [PubMed] [Google Scholar]
- 44.Sodergard R, Backstrom T, Shanbhag V, Carstensen H. Calculation of free and bound fractions of testosterone and estradiol-17beta to human plasma protein at body temperature. J Steriod Biochem. 1982;26:801–810. doi: 10.1016/0022-4731(82)90038-3. [DOI] [PubMed] [Google Scholar]
- 45.Thornton KL, DeFronzo RA, Sherwin RS, Diamond MP. Micronized estradiol and progesterone: effects on carbohydrate metabolism in reproductive-age women. J Soc Gynecol Invest. 1995;2:643–652. doi: 10.1016/1071-5576(95)00012-4. [DOI] [PubMed] [Google Scholar]
- 46.Toth EL, Suthijumroon A, Crockford PM, Ryan EA. Insulin action does not change during the menstrual cycle in normal women. J Clin Endocr Metab. 1987;64:74–80. doi: 10.1210/jcem-64-1-74. [DOI] [PubMed] [Google Scholar]
- 47.Toth MJ, Eltabbakh GH, Sites CK, Poehlman ET. Effect of menopausal status on insulin-stimulated glucose disposal. Diabetes Care. 2000;23:801–806. doi: 10.2337/diacare.23.6.801. [DOI] [PubMed] [Google Scholar]
- 48.Toth MJ, Sites CK, Cefalu WT, Matthews DE, Poehlman ET. Determinants of insulin-stimulated glucose disposal in middle-aged, premenopausal women. Am J Physiol. 2001;281:E113–E121. doi: 10.1152/ajpendo.2001.281.1.E113. [DOI] [PubMed] [Google Scholar]
- 49.Toth MJ, Tchernof A, Sites CK, Poehlman ET. Effect of menopausal status on body composition and abdominal fat distribution. Int J Obes. 2000;24:226–231. doi: 10.1038/sj.ijo.0801118. [DOI] [PubMed] [Google Scholar]
- 50.Valdes C, Elkind-Hirsch K. Intravenous glucose tolerance test-derived insulin sensitivity changes during the menstrual cycle. J Clin Endocr Metab. 1991;72:642–646. doi: 10.1210/jcem-72-3-642. [DOI] [PubMed] [Google Scholar]
- 51.Van Cauter E, Mestrez F, Sturis J, Polonsky KS. Estimation of insulin secretion rates from c-peptide levels: comparison of individual and standard kinetic paramters for c-peptide clearance. Diabetes. 1992;41:368–377. doi: 10.2337/diab.41.3.368. [DOI] [PubMed] [Google Scholar]
- 52.van Dongen BE, Schouten S, Damste JS. Gas chromatography/combustion/isotope-ratio-monitoring mass spectrometric analysis of methylboronic derivatives of monosaccharides: a new method for determining natural 13C abundance of carbohydrates. Rapid Commun Mass Spectrom. 2001;15:496–500. doi: 10.1002/rcm.259. [DOI] [PubMed] [Google Scholar]
- 53.van Genugten RE, Utzschneider KM, Tong J, Gerchman F, Zraika S, Udayasankar J, Boyko EJ, Fujimoto WY, Kahn SE Group. atADAGS. Effects of sex and hormone replacement therapy use on the prevalence of isolated impaired fasting glucose and isolated impaired glucose tolerance in subjects with a family history of type 2 diabetes. Diabetes. 2006;55:3529–3535. doi: 10.2337/db06-0577. [DOI] [PubMed] [Google Scholar]
- 54.Van Pelt RE, Gozansky WS, Schwartz RS, Kohrt WM. Intravenous estrogens increase insulin clearance and action in postmenopausal women. Am J Physiol. 2003;285:E311–E317. doi: 10.1152/ajpendo.00490.2002. [DOI] [PMC free article] [PubMed] [Google Scholar]
- 55.Vehkavaara S, Westerbacka J, Hakala-Ala-Pietila T, Virkamaki A, Hovatta O, Yki-Jarvinen H. Effect of estrogen replacement therapy on insulin sensitivity of glucose metabolism and preresistance and resistance vessel function in healthy postmenopausal women. J Clin Endocr Metab. 2000;85:4663–4670. doi: 10.1210/jcem.85.12.7034. [DOI] [PubMed] [Google Scholar]
- 56.Walton C, Godsland IF, Proudler AJ, Wynn V, Stevenson JC. The effects of the menopause transition on insulin sensitivity, secretion and elimination in non-obese, healthy women. Eur J Clin Invest. 1993;23:466–473. doi: 10.1111/j.1365-2362.1993.tb00792.x. [DOI] [PubMed] [Google Scholar]
- 57.Wu S-I, Chou P, Tsai S-T. The impact of years since menopause on the development of impaired glucose tolerance. J Clin Epidemiol. 2001;54:117–120. doi: 10.1016/s0895-4356(00)00284-5. [DOI] [PubMed] [Google Scholar]
- 58.Xu A, Chan KW, Hoo RLC, Wang Y, Tan KCB, Zhang J, Chen B, Lam MC, Tse C, Cooper GJS, Lam KSL. Testosterone selectively reduces the high molecular weight form of adiponectin by inhibiting its secretion from adipocytes. J Biol Chem. 2005;280:18073–18080. doi: 10.1074/jbc.M414231200. [DOI] [PubMed] [Google Scholar]
- 59.Yki-Jarvinen H. Insulin sensitivity during the menstrual cycle. J Clin Endocr Metab. 1984;59:350–353. doi: 10.1210/jcem-59-2-350. [DOI] [PubMed] [Google Scholar]