

Abstract
The ends of human chromosomes are protected from the degradation associated with cell division by 15-20 kb long segments of hexameric repeats of 5′-TTAGGG-3′ termed telomeres. In normal cells telomeres lose up to 300 bp of DNA per cell division that ultimately leads to senescence; however, most cancer cells bypass this lifespan restriction through the expression of telomerase. hTERT, the catalytic subunit essential for the proper function of telomerase, has been shown to be expressed in approximately 90% of all cancers. In this study we investigated the hTERT inhibiting effects of (-)-epigallocatechin-3-gallate (EGCG), the major polyphenol found in green tea catechins, in MCF-7 breast cancers cells and HL60 promyelocytic leukemia cells. Exposure to EGCG reduced cellular proliferation and induced apoptosis in both MCF-7 and HL60 cells in vitro, although hTERT mRNA expression was decreased only in MCF-7 cells when treated with EGCG. Furthermore, down-regulation of hTERT gene expression in MCF-7 cells appeared to be largely due to epigenetic alterations. Treatment of MCF-7 cells with EGCG resulted in a time-dependent decrease in hTERT promoter methylation and ablated histone H3 Lys9 acetylation. In conjunction with demethylation, further analysis showed an increase in hTERT repressor E2F-1 binding at the promoter. From these findings, we propose that EGCG is effective in causing cell death in both MCF-7 and HL60 cancer cell lines and may work through different pathways involving both anti-oxidant effects and epigenetic modulation.
Keywords: telomerase, epigenetics, EGCG, DNA methylation, histone acetylation, E2F-1
Telomeres are specialized structures located at the ends of chromosomes responsible for maintaining chromosomal stability by preventing attrition, end-to-end fusions and chromosomal rearrangements. Human telomeric DNA is usually about 15-20 kb in length and is composed of repetitive 5′-TTAGGG-3′ sequences [Zakian, 1995]. Because the “end replication problem of linear chromosomes” results in the incomplete copying of telomeric DNA, 150-300 bp of DNA is lost with each replication and once a critical length is reached normal human cells enter a senescent state and cease to divide. Telomerase is a ribonucleoprotein enzyme complex required to preserve the length of telomeres in rapidly dividing cells. Human telomerase reverse transcriptase (hTERT) is the catalytic subunit of telomerase and utilizes an RNA component containing a sequence complementary to the telomeric repeat as a primer to elongate telomeres [Meyerson et al., 1997]. Although most normal human somatic cells exhibit very little telomerase activity, highly proliferative cells such as germline cells, hematopoetic cells and up to 95% of cancer cells express telomerase to varying degrees [Ahmed and Tollefsbol, 2003]. The near exclusivity of hTERT expression to cancer cells makes this an attractive target for chemoprevention and other alternative therapies.
Among the various aspects of gene control, epigenetic modulation has been the focus of many recent studies. DNA methylation of the promoter region of a gene has been shown to be an important factor in its ability to bind different transcription factors [Campanero et al., 2000; Perini et al., 2005]. In most cases, hypermethylation of the regulatory region of a gene can inhibit its expression. For example, the p16 promoter becomes methylated inhibiting its expression during tumorogenesis [Lee et al., 2003]. There are three major DNA methyltransferases (DNMTs) responsible for the establishment of the patterns of DNA methylation present in the genome. DNMT3a and DNMT3b are mainly involved in de novo methylation while DNMT1 maintains the methylation pattern during cellular replication. Knockout of each of these is associated with a vast loss of genomic methylation and is embryonic-lethal in mice [Okano et al., 1999]. Interestingly, hTERT regulation by DNA methylation goes against the paradigm and hypermethylation of its promoter leads to increased expression in cancer cells [Guilleret and Benhattar, 2004; Quante et al., 2005], possibly by inhibition of the binding of methylation-sensitive transcription factors such as E2F-1. The full mechanism by which DNA methylation influences hTERT gene expression remains to be elucidated. Another prevalent epigenetic mechanism influencing gene transcription is histone modification. Many alterations can be made to the N-terminal tails of histones that can either increase or inhibit gene transcription. Histones and histone-associated proteins are responsible for maintaining chromatin in either an accessible or inaccessible state. The addition of an acetyl group to a lysine residue in an N-terminal tail results in the loss of the positive charge allowing for loose association to the DNA [Krajewski, 2002]. This more open conformation provides access for transcription factors to DNA, increasing gene transcription in that region. Methylation of the lysine residues may also occur and it has been shown that mono- and di-methylation at histone 3-lysine 9 (H3-lys9) is associated with an inactive chromatin conformation [Rice et al., 2003]. Similar to changes in DNA methylation by DNMTs, histone modifications can be made by certain modifiers such as histone deacetylases (HDACs), histone methyl-transferases (HMTases), and histone acetyl-transferases (HATs) [Berger, 2002]. Despite our knowledge of histone modifications, hTERT gene regulation by changes in chromatin structure has yet to be fully elucidated.
Tea is one of the most widely consumed beverages worldwide and has recently been the focus of many studies aimed at discovering the purported health benefits of the polyphenolic compounds prevalent in green tea [Nakachi et al., 2003; Lee et al., 2006]. The major polyphenols found in green tea include (-)-epigallatecatechin (EGC), (-)-epicatechin-3-gallate (ECG), (-)-epicatechin (EC), and (-)-epigallocatechin-3-gallate (EGCG). Of these, EGCG accounts for more than 50% of the total polyphenol content in green tea [Lin and Liang, 2000]. Several studies show that EGCG exhibits the ability to suppress cancer cell growth, induce apoptosis, and inhibit tumor angiogenesis. Therefore, it is likely that EGCG imparts its anticancer effects through many different mechanisms [Fassina et al., 2004; Huh et al., 2004]. One mechanism includes the inhibition of DNMT1 leading to demethylation and reactivation of methylation-silenced genes. Treatment of human esophageal KYSE 510 and 150 cells with EGCG has been shown to lower DNMT1 activity and lead to hypomethylation and re-expression of genes including RARβ and hMLH1 [Fang et al., 2003]. More recently, it has been observed that EGCG can specifically inhibit both SssI and DNMT1 methylation in vitro [Jon et al., 2005]. Taken together, these findings indicate that EGCG may have an effect on gene regulation through an epigenetic pathway.
MATERIALS AND METHODS
Cell Culture Conditions, Kinetics of Cell Growth, and Morphological Studies Following EGCG Treatment
MCF-7 breast cancer and HL60 leukemia cells were obtained from the American Type Culture Collection (ATCC, Rockville, MD). Briefly, MCF-7 cells were routinely cultured in Dulbecco’s modified Eagle’s medium (DMEM) supplemented with 10% fetal bovine serum (FBS), 25 mM l-glutamine, and 10 μg/ml anti-biotics (amphotericin B, penicillin, and streptomycin; APS). HL60 cells were grown in Iscove’s DMEM supplemented with 10% FBS, 25 mM l-glutamine, 10 μg/ml APS, and 1% sodium pyruvate (all products from Mediatech, Inc., Herndon, VA). EGCG (Sigma, St. Louis, MO) was added to the media for a final concentration of 100 μM for treatment of MCF-7 cells and 50 μM for treatment of HL60 cells based on optimal dose-response analyses (data not shown). Treated and untreated control cells were grown at 37°C in a humidified atmosphere containing 5% CO2. EGCG solutions were made fresh and cells were re-treated and fed each day for the duration of the exposure. All treatments included experimental as well as non-treated controls without EGCG for each assayed time point as we have done previously [Mittal et al., 2004]. Cells were counted using a Neubauer hemocytometer and trypan blue (0.25%). Standard error was measured from counts taken in three separate experiments. Morphological changes were recorded using a Nikon Coolpix 990 (Nikon, Tokyo, Japan).
Gene Expression Assays
Cells were harvested every 3 days and total cellular RNA was purified using the RNeasy Mini Kit (Qiagen, Valencia, CA). Two micro-grams of RNA was reverse-transcribed using the Superscript First Strand synthesis system for conversion to cDNA (Invitrogen, Carlsbad, CA). An aliquot from this reaction (3 μl) was used as the template for a PCR amplification with a primer set specific to a 509 bp region of the hTERT gene: sense, 5′-AGAACGTTCCGCAGAGAAAA-3′ and anti-sense, 5′-AAGCGTAGGAAGACGTCGAA-3′. Amplification of β-actin mRNA was performed as a positive/loading control using primers specific to a 649 bp region: sense, 5′-AGAAAATCTGGCACCACACC-3′ and anti-sense, 5′-AGCACTGTGTTGGCGTACAG-3′. Amplification was performed in a standard thermocycler beginning with an initial heating at 94°C for 1 min followed by 30 cycles of 94°C for 15 s, 52°C for 30 s and 72°C for 2 min. PCR products were resolved on a 1% agarose gel visualized with ethidium bromide staining exposed to UV light. Gel quantifications were made using Kodak 1D image analysis software (Eastman Kodak, Rochester, NY).
Detection of Apoptosis by In Situ Fluorescein Labeling and Fluorescence-Activated Cell Sorting
Apoptosis in EGCG treated and non-treated control cells was assayed using the ApopTag® fluorescein direct in situ apoptosis detection kit (Chemicon International, Inc., Temecula, CA). Briefly, cells were fixed using 1% paraformaldehyde and post-fixed in ethanol/acetic acid and cytospun using a technique developed in this lab: Post-fixed cells were spread on an 18 mm × 18 mm coverslip placed inside a 50 ml centrifuge tube and supported by a small piece of Styrofoam. The tubes were then spun in a Beckman TJ-6 centrifuge for ∼2 min at 400g. Following cytospining, cells were washed in 1×phosphate buffered saline and labeled with digoxigenin-dNTPs using the terminal deoxy-nucleotidyl transferase (TdT) enzyme at 37°C for 1 h to stain for apoptosis. Cells were counter stained using Vectashield containing anti-fade and DAPI (Vector Laboratories, Burlingame, CA). Stained cells were visualized using a Leitz fluorescence microscope (Leitz Wetzler, Germany) and photographed with a CoolSNAP-Pro camera (Media Cybernetics, Silver Springs, MD) at 100× magnification. Further examination of apoptosis in response to EGCG treatment was measured using the Vybrant™ Apoptosis Assay Kit No. 2 (Molecular Probes, Carlsbad, CA) as we have done previously [Mittal et al., 2004]. Briefly, cells were washed with cold phosphate buffered saline and stained with both Alexa Fluor® 488 annexin V and propidium iodide according to the manufacturer’s protocol. Cells were sorted using a FACSCalibur cell sorter and results were analyzed using CELLQuest software (Becton, Dickinson, Franklin Lakes, NJ).
Sodium Bisulphite Analysis
Methylation of the hTERT promoter was analyzed using the MethylEasy™ DNA bisulphite modification kit (Human Genetic Signatures, Macquarie Park, Australia) as performed regularly. In brief, DNA from EGCG-treated and non-treated controls was extracted using the DNeasy Tissue Kit (Qiagen). Up to 4 μg of DNA were treated with 3 M NaOH and incubated at 37°C for 15 min. Bisulphite modification was carried out at 55°C overnight to ensure complete conversion of non-methylated cytosines [Liu et al., 2004]. Samples were subjected to nested PCR for two rounds using the following primers specific for a 646 bp region of the hTERT promoter: First round sense, 5′-ATTTGGAGGTAGTTTTGGGTT-3′; first round anti-sense, 5′-AACCACCAACTCCTTCAAA-3′; for second round PCR amplification sense, 5′-GTTTTTAGGGTTTTTATATTATGG-3′ and second round anti-sense, 5′-CACACCAAACACTAAACCACCA-3′. PCR was performed under the following conditions: 95°C for 3 min followed by 30 cycles of 95°C for 15 s, 50°C for 2 min, and 72°C for 2 min with a hold at 72°C for 10 min. Amplified DNA was purified using the QIA-quick PCR purification kit (Qiagen). Amplified segments were sequenced using the 3730 DNA Sequencer (Applied Biosystems, Foster City, CA).
Chromatin Immunoprecipitation Analysis
In order to assess the histone acetylation status at the hTERT promoter, the EZ Chromatin Immunoprecipitation (EZ ChIP™) assay was used (Upstate Biotech, Charlottesville, VA) as we have done previously. Briefly, treated and non-treated controls were crosslinked using fresh 1% paraformaldehyde, harvested and lysed in 20% SDS lysis buffer. Crosslinked DNA was sheared using model 150 V/T Ultrasonic Homogenizer (Biologics, Inc., Manassas, VA) to ∼200-1000 bp in length. Sheared lysate was pre-cleared with a 50% Protein G agarose slurry and 10% of the supernatant was removed to serve as the input control. The pre-cleared lysate was incubated with antibodies specific for acetylated histone H3 at lysine 9 or E2F-1 (Upstate Biotech) overnight at 4°C with rotation. Antibody/antigen/DNA complex was collected using the Protein G agarose slurry and washed with salt buffers included in the kit. Protein/DNA complexes were eluted in elution buffer containing 1 M NaHCO3, 20% SDS lysis buffer, and distilled water [Liu et al., 2004]. Protein/DNA crosslinks were reversed in 5 M NaCl at 65°C for 4 h. DNA was purified according to the protocol using spin columns provided in the kit (Upstate Biotech). Purified DNA was amplified by standard PCR with primers specific for a 553 bp fragment in the hTERT promoter: sense, 5′-CTCCGTCCTCCCCTTCAC-3′ and anti-sense, 5′-CAGCGCTGCCTGAAACTC-3′. PCR was performed under the following conditions: 94°C for 1 min followed by 30 cycles of 94°C for 15 s, 52°C for 30 s, and 72°C for 2 min.
RESULTS
Morphological Effects and Reduction in Proliferation
We investigated both cellular proliferation kinetics and morphological alterations in cells exposed to EGCG. As shown in Figure 1, EGCG treatment inhibited cell growth in both MCF-7 breast cancer cells and HL60 promyelocytic leukemia cells (Fig. 1A,B, respectively), as well as inducing morphological changes indicative of an increase in apoptosis (Fig. 1C,D). By day 6 MCF-7 cells showed a severe reduction in cell growth (∼88%) and an enhanced amount of membrane blebbing associated with apoptosis (Fig. 1C). As illustrated in Figure 1B, HL60 cells also underwent a decline in cell proliferation in a time-dependent manner (∼33% by day 6 and ∼60% by day 9). Morphologically, HL60 cells exhibited signs of apoptosis and necrosis as evidenced by the swelling of the cells in both day 6 and 12 (Fig. 1D). The morphological evidence for necrosis and apoptosis in HL60 cells and the lack of morphological evidence for necrotic cells in MCF-7 cells indicate that induction of cell death by EGCG may occur through different pathways for the two cell types.
Fig. 1.
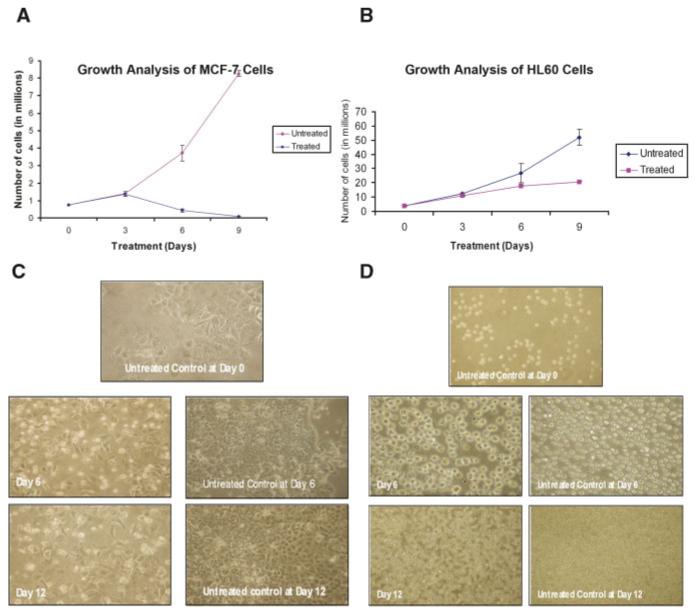
Growth analysis and morphological studies of MCF-7 breast cancer cells and HL60 promylocytic leukemia cells in response to EGCG treatment. Based on dose response analyses (data not shown), MCF-7 cells (A) were grown either in the presence or absence of 100 μM EGCG and HL60 cells (B) were grown in the presence or absence of 50 μM EGCG. Cells were counted using trypan blue staining. Morphological data were recorded at 3-day intervals for both MCF-7 (C) and HL60 cells (D). Cells were visualized at 100× magnification. [Color figure can be viewed in the online issue, which is available at www.interscience.wiley.com.]
Apoptotic Effects of EGCG on Cancer Cells
To further investigate apoptosis in EGCG-treated cells, apoptosis-associated cleaved DNA was labeled using the enzyme TdT. During apoptosis, cellular DNA is cleaved leaving 3′-OH groups exposed. These ends were labeled with digoxigenin-dNTPs using the TdT enzyme and visualized through fluorescent microscopy. Apoptosis associated with EGCG treatment increased progressively in both cell lines (Fig. 2). As illustrated in Figure 2B, by day 9 there was a marked induction of apoptosis in HL60 cells treated with EGCG when compared to untreated controls. At day 9 MCF-7 cells also show high apoptosis levels when compared to untreated controls (Fig. 2D). In addition to fluorescent labeling, apoptosis was measured using fluorescence activated cell sorting (FACS) as described above. At 9 days of treatment there is an increase of apoptotic HL60 cells (>2-fold) when compared to untreated control cells grown for the same time period (Fig. 2E). Similarly, in Figure 2E, MCF-7 cells show an even greater increase in apoptosis by day 9 (>11-fold). The difference in the levels of apoptosis in MCF-7 cells and HL60 cells may indicate that the mechanism by which EGCG induces apoptosis in HL60 cells is more direct, perhaps through an oxidant pathway or up-regulation of pro-apoptotic genes [Mittal et al., 2004] and that EGCG may utilize both an antioxidant pathway and one involving telomerase inhibition in MCF-7 cells. These results collectively indicate that EGCG induces programmed cell death in cancer cells with dissimilar origins. Since it has been shown that cancer cells often have shortened telomeres despite the presence of high levels of telomerase expression [Liu et al., 2004], we further tested whether the induction of apoptosis could be attributed to the down-regulation of hTERT in these cell lines.
Fig. 2.
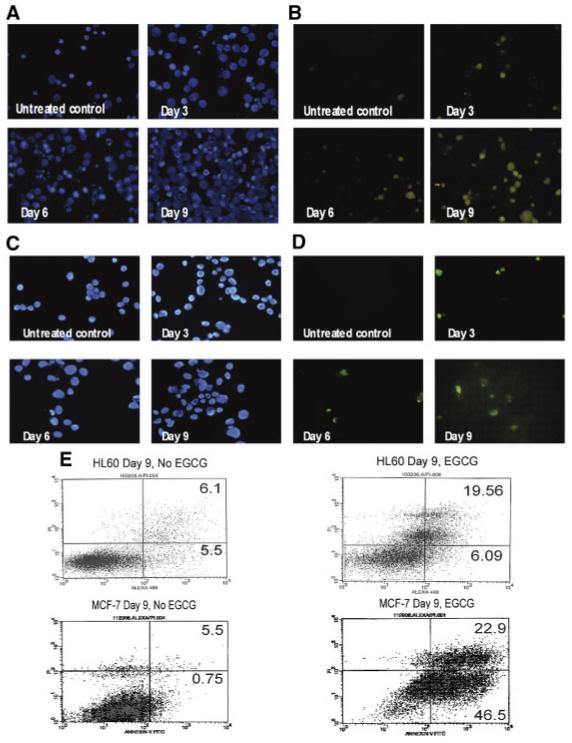
Time-dependent apoptosis induction in HL60 and MCF-7 cells by EGCG. HL60 and MCF-7 cells were treated with 50 and 100 μM EGCG, respectively for 9 days. Apoptosis was assayed by the Apoptag® Fluorescein Direct In Situ Apoptosis Detection Kit. A: HL60 nuclear DAPI stains (blue) and (B) HL60 TdT apoptosis stains (green) for untreated controls and cells treated through day 9. C: MCF-7 nuclear DAPI stains (blue) and (D) TdT apoptosis stains (green) for treated and untreated MCF-7 cells through day 9. Fluorescence activated cell sorting was used to further study apoptosis induced by EGCG (E). Levels of apoptosis were calculated using values for early apoptosis (lower right quadrant) and late apoptosis (upper right quadrant). [Color figure can be viewed in the online issue, which is available at www.interscience.wiley.com.]
Reduction in hTERT mRNA Production in Breast Cancer Cells
In previous reports, apoptosis has been shown to be associated with hTERT mRNA down-regulation and follows siRNA knockdown of the telomerase gene [Roy et al., 2005; Shammas et al., 2005; Lin et al., 2006]. We investigated whether the apoptosis described above is correlated with the reduction in hTERT mRNA levels. Side-by-side comparison with untreated control cultures reveals a clear time-dependent inhibition of hTERT mRNA production in MCF-7 cells (Fig. 3A). At day 6 of exposure hTERT gene expression is reduced by ∼23% when compared to the untreated control grown in the absence of EGCG for the same time period. Further exposure led to greater reductions at day 9 and day 12 (∼40%, ∼64%, respectively) (Fig. 3A). However, HL60 cells grown in the presence of EGCG exhibited no hTERT gene down-regulation when compared to time-matched untreated control cells (Fig. 3B). The differing expression patterns in response to EGCG treatment may indicate that the polyphenol works through multiple pathways that differ in varying cell types. Regulation of gene expression is not only controlled by changes within the nucleotide sequence, but it is also influenced by epigenetic changes. Since a reduction in hTERT mRNA was shown in MCF-7 cells, we next investigated if this change was due to epigenetic mechanisms.
Fig. 3.
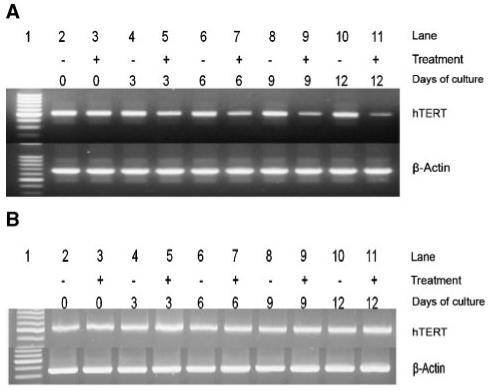
EGCG down-regulates hTERT mRNA expression in MCF-7 cells but not in HL60 cells. Both untreated and cells treated for specific time intervals were assayed for hTERT expression. A: hTERT mRNA expression in treated MCF-7 compared side-by-side with untreated controls and (B) treated HL60 cells presented in a similar fashion. Lane 1 contains 100 bp marker. (+) Denotes cells treated with either 50 μM (for HL60 cells) or 100 μM EGCG (for MCF-7 cells) based on dose response analysis (data not shown) and (-) indicates untreated controls. β-Actin was used as a loading control. For PCR amplification of hTERT, primers used were as follows: 5′-AGAACGTTCCGCAGAGAAAA-3′, sense and 5′-AAGCGTAGGAAGACGTCGAA-3′, anti-sense. Amplification of β-actin was accomplished using primers as follows: 5′-AGAAAATCTGGCACCACACC-3′, sense and 5′-AGCACTGTGTTGGCGTACAG-3′, antisense.
Epigenetic Modifications by EGCG in Cancer Cells
It has been established that hypermethylation of the hTERT promoter region paradoxically induces gene transcription and that demethylation results in lowered expression in most cancers cells [Guilleret and Benhattar, 2003]. In a previous study, we have shown that decreased acetylation on H3 at lysine 9 within the hTERT promoter negatively influences hTERT transcription during retinoid induced differentiation [Liu et al., 2004]. We therefore investigated whether the reduction in hTERT mRNA production seen during EGCG treatment is caused by demethylation of the promoter or deacetylation of histones on the hTERT gene. Figure 4A illustrates a marked reduction in histone acetylation in a time-dependent fashion. Upon treatment, H3 becomes increasingly hypoacetylated when compared to untreated controls, which appear to maintain a steady state of acetylation throughout treatment. At day 6 the amount of acetylated H3 was approximately half as much as its respective untreated control and by day 9 H3 was completely hypoacetylated. There is a marked correlation between the epigenetic mechanisms affected by EGCG treatment and hTERT expression. As both DNA methylation at the hTERT promoter and H3 lys9 acetylation decrease, so does hTERT expression (Fig. 4C).
Fig. 4.
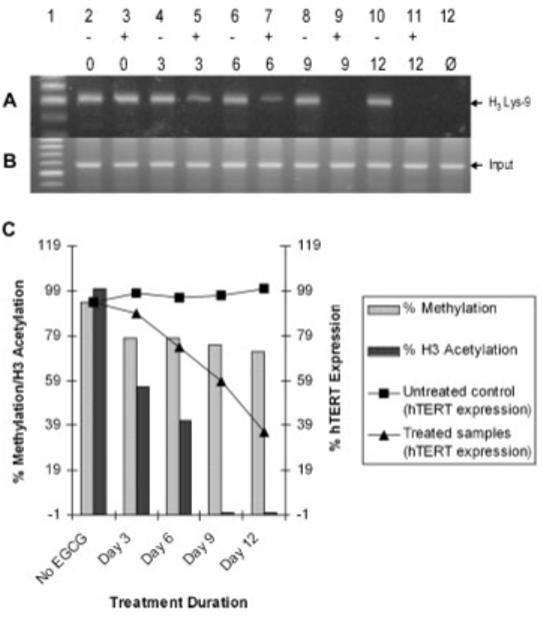
EGCG deacetylates histones at the hTERT promoter and the down-regulation of hTERT expression correlates with associated epigenetic modulation. ChIP analysis of histone H3 acetylation in EGCG treated and untreated MCF-7 cells. A: PCR amplification of ChIP-purified DNA using a rabbit anti-acetylated histone H3 antibody. One sample was incubated with only rabbit IgG to serve as a negative contamination control (Ø) and (B) 1% of the supernatant was removed prior to immunoprecipitation to serve as an input DNA control. Primers specific for the hTERT gene were used for PCR amplification: 5′-CTCCGTCCTCCCCTTCAC-3′, sense and 5′-CAGCGCTGCCTGAAACTC-3′, anti-sense. C: Graph representing the correlation between the epigenetic changes at the hTERT promoter and expression in MCF-7 cells. Percent methylation was obtained by dividing the number of methylated sites by the total number of sites (37) being assayed (see Fig. 5A for site-specific methylation of the hTERT promoter in response to EGCG). Relative hTERT expression was determined by the Kodak photo-imaging system after assigning the most intense band to be 100%.
Demethylation of Key E2F-1 Binding Sites in the hTERT Promoter
It has been previously shown that the cell cycle regulator E2F-1 can act as a tumor suppressor by directly influencing the hTERT promoter [Won et al., 2002], and that E2F-1 binding is inhibited by CpG methylation. Therefore, we analyzed both the methylation status at two putative E2F-1 binding sites within the hTERT core promoter and the binding of E2F-1 to the hTERT promoter. Figure 5A illustrates time-dependent demethylation of the hTERT promoter in MCF-7 cells at key E2F-1 binding sites, with the highest amount of demethylation occurring at day 12.
Fig. 5.
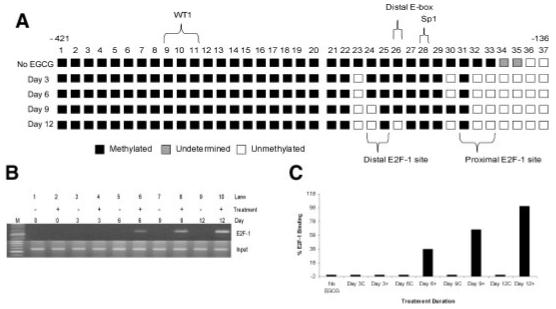
EGCG induces demethylation at E2F-1 binding sites in the hTERT promoter and increases E2F-1 binding capacity. MCF-7 treated cells were assayed for hTERT promoter methylation. Sodium bisulfite conversion was used to study 37 CpG sites within the hTERT promoter (indicated by boxes). Nested PCR using primers specific for converted hTERT DNA were used: first round sense, 5′-ATTTGGAGGTAGTTTTGGGTT-3′; first round anti-sense, 5′-AACCACCAACTCCTTCAAA-3′. For second round sense, 5′-GTTTTTAGGGTTTTTATATTATGG-3′; second round anti-sense, 5′-CACACCAAACACTAAACCACCA-3′. A: As shown, EGCG caused hypomethylation at both the distal and proximal E2F-1 binding sites containing two and three CpG sites, respectively. The gray shaded boxes represent undetermined methylation status and possibly result from partial methylation at these sites. B: Gel electrophoresis showing an increase in E2F-1 binding at the hTERT promoter. C: Histogram illustrating the % binding of E2F-1.
Increased Binding of E2F-1 at Sites Within the hTERT Promoter and a Proposed Mechanism for hTERT Down-Regulation by EGCG
We next studied the binding ability of E2F-1 during EGCG treatment. Using ChIP, we showed that as treatment time increased, so did the binding of E2F-1 (Fig. 5B). From day 6 to 9, E2F-1 binding increased by ∼42%, and from day 6 to 12 increased by ∼62% (Fig. 5B) and is graphically represented in Figure 5C. To serve as an input control, 10% of the sample was removed before immunoprecipitation (Figs. 4 and 5). Figure 6 proposes a model for the correlation between hTERT down-regulation and epigenetic alterations in MCF-7 cells exposed to EGCG. Taken together, these data indicate a possible mechanism by which EGCG down-regulates hTERT gene expression which includes both epigenetic regulation of chromatin and transcription factor binding.
Fig. 6.
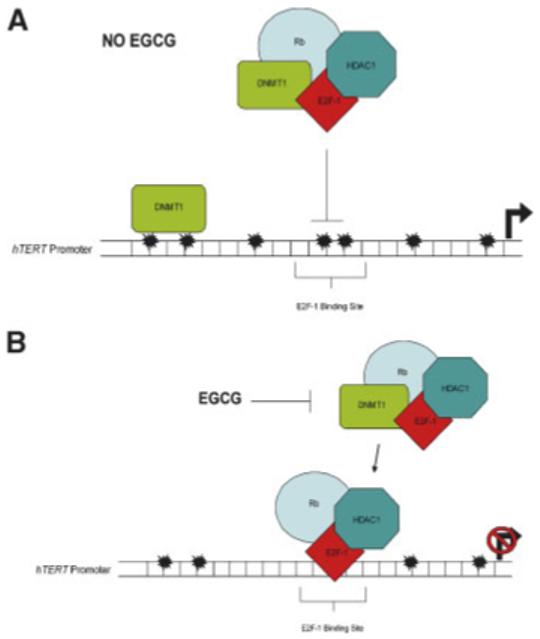
Proposed mechanism of epigenetic gene control alterations by EGCG. A: Under normal growth conditions DNMT1 methylation capacity is not inhibited allowing methylation of the hTERT promoter in cancer cells which may block the binding of the Rb/E2F-1/DNMT1/HDAC1 repressor complex, the results of which include a hypermethylated promoter, acetylated histones and active gene transcription. B: Treatment of EGCG inhibits DNMT1 methylating ability leading to hypomethylation of the hTERT promoter [Fang et al., 2003] including key E2F-1 sites. This may allow the Rb/E2F-1/HDAC1 repressor complex to bind leading to hypoacetylation and reduced hTERT transcription. [Color figure can be viewed in the online issue, which is available at www.interscience.wiley.com.]
DISCUSSION
Molecular mechanisms for the inhibitory effects of tea polyphenols on many types of cancers have been proposed. Our results suggest that treatment of cells with polyphenols can lead to differential cytotoxic effects, and that EGCG-induced cancer cell death may be accomplished through both a telomerase-independent mechanism and a telomerase-dependent mechanism in varying cell types. Despite the differences in genetic mechanisms, our observations indicate that EGCG is capable of inhibiting cell growth and inducing apoptosis in cancers of dissimilar origins. Our results also suggest that the growth inhibiting effects seen in HL60 cells are not due to hTERT down-regulation. It is possible that the induction of apoptosis in this case is the result of an alteration in another apoptotic pathway such as a disturbance in the ratio of Bax to Bcl-2 [Roy et al., 2005] or a direct cytotoxic effect caused by the formation of H2O2 from EGCG in the medium [Weisberg et al., 2004]. It is important to mention that our data establishes a strong correlation between hTERT mRNA reduction and the induction of apoptosis in MCF-7 cells. Loss of hTERT expression may not be the only cause of apoptosis as indicated by the lack of reduction of hTERT mRNA in HL60 cells demonstrating apoptosis. Since the focus of this study is to analyze hTERT down-regulation seen with EGCG treatment, only MCF-7 cells were used to study epigenetic changes caused by the polyphenol. Cells of different origins were chosen to illustrate EGCG’s effects in differentiated and non-differentiated cancers, however further experimentation as to how the origin of the cancer cell relates to the differential effects illustrated by our results is needed. Carcinoma cells of embryonic origin have been shown to follow the traditional paradigm and contain hypomethylated hTERT promoters that are transcriptionally active and become silenced when methylated [Guilleret and Benhattar, 2003]. This would help to explain why hTERT mRNA production is not affected by EGCG in HL60 cells of embryonic origin, since it is the inhibition of the activity of the maintenance methyltransferase DNMT1 that is thought to be the major cause of EGCG-induced promoter hypomethylation [Fang et al., 2003; Jon et al., 2005]. MCF-7 cells are a differentiated cell line which has been shown to contain hypermethylated hTERT promoter CpG sites [Guilleret and Benhattar, 2004] and responds to EGCG treatment [Mittal et al., 2004]. It has been shown recently that hypermethylation of CpG sites within a 150 bp region around the transcription start site decreases hTERT transcription, following the normal paradigm of methylation induced gene silencing [Zinn et al., 2007]. It is possible that EGCG treatment decreased capacity of DNMT1 to maintain methylation, leading to demethylation of the key E2F-1 sites, thus allowing the repressor to bind and block transcription as we have shown. Another possibility is that EGCG-induced demethylation facilitates the loss of methylation at CTCF-binding regions within the first exon, allowing for repression of hTERT as illustrated by a recent study [Renaud et al., 2007]. However the specific effects of EGCG on CTCF-binding requires further elucidation. The findings presented here strongly suggest that EGCG may play an important role in the epigenetic control of hTERT through hypomethylation at specific sites within the hTERT promoter. Not all the CpGs of the hTERT promoter are affected which may be due to competitive binding of transcription factors in those regions. One other explanation may be that DNMT1 preferentially methylates the CpGs contained in the E2F-1 sites and that disruption of DNMT1 activity initially causes a loss of methylation in that area.
The regulation of hTERT gene activity involves mechanisms utilizing both epigenetic and transcriptional control points. Mad1 has been shown to bind to the hTERT promoter at locations termed E-boxes and suppress transcription [Zou et al., 2006] while specific alterations in chromatin structure can influence expression of telomerase [Atkinson et al., 2005]. Our results illustrating progressive hypoacetylation at the hTERT promoter in MCF-7 cells treated with EGCG may be an important factor in the epigenetic mechanisms that lead to decreased hTERT transcription. A proposed mechanism for the down-regulation of hTERT transcription in response to EGCG is illustrated in Figure 6. Under normal conditions, in cancer cells, hypermethylation of the hTERT promoter is maintained by DNMT1 throughout division allowing for continued hTERT transcription (Fig. 6A). However, the down-stream effects of DNMT1 activity inhibition by EGCG may be twofold (Fig. 6B). First, DNMT1 cannot associate with the Rb/E2F-1/HDAC1 complex thought to be formed [Robertson et al., 2000], and second, the absence of DNMT1 in that complex in EGCG-treated cells may allow for the binding of E2F-1 to sites within the hTERT promoter resulting in a decrease in hTERT expression through the deacetylation of nearby histones by HDAC1. Support for the putative mechanism is evidenced by the time-dependent hypoacetylation and elevation in E2F-1 binding seen in this study.
In conclusion, the findings presented in this study help illustrate the diversity of mechanisms by which EGCG can work in cells of varying origin. We have shown that EGCG can inhibit cell growth by inducing apoptosis and that this induction in MCF-7 cells is due to decreased hTERT transcription. These findings show for the first time that EGCG leads to progressive demethylation of the hTERT promoter including E2F-1 binding sites resulting in an increase in binding of this repressor. We have also shown for the first time that EGCG treatment leads to hypoacetylation at H3 lys9, further contributing to hTERT down-regulation. It is important to point out that hTERT gene control is unique and involved and this proposed method of action is not the only way EGCG inhibits cancer cell growth. The concentrations used in this study were 50 and 100 μM and may be high when compared to physiologically achievable amounts in mammary tissue, however, Naasani et al. (1998) illustrated that EGCG can inhibit telomerase and induce apoptosis at doses achievable by drinking a only a few cups of green tea. While this work is aimed at elucidating the mechanism by which EGCG can down-regulate hTERT expression, further confirmation with the concentrations used in this study in vivo is needed. However, the anticancer effects of EGCG seen in this and other studies make it an attractive target for chemoprevention in varying cancer cell types.
ACKNOWLEDGMENTS
Special thanks to Sharla Phipps for critical reading of this manuscript. The authors also wish to thank Leah Strickland and Derek Patterson for maintenance of cell stocks used in this work.
Grant sponsor: National Cancer Institute; Grant number: R21CA114019-OIA1; Grant sponsor: Susan G. Komen Breast Cancer Foundation; Grant number: BCTRO600821; Grant sponsor: Institute for Cancer Research.
Footnotes
Joel B. Berletch and Canhui Liu contributed equally to this work.
REFERENCES
- Ahmed A, Tollefsbol T. Telomeres, telomerase, and telomerase inhibition: Clinical implications for cancer. J Am Geriatr Soc. 2003;51:116–122. doi: 10.1034/j.1601-5215.2002.51019.x. [DOI] [PubMed] [Google Scholar]
- Atkinson P, Hoare S, Glasspool R, Keith W. Lack of telomerase gene expression in alternative lengthening of telomere cells is associated with chromatin remodeling of the hTR and hTERT gene promoters. Cancer Res. 2005;65:7585–7590. doi: 10.1158/0008-5472.CAN-05-1715. [DOI] [PubMed] [Google Scholar]
- Berger SL. Histone modifications in transcriptional regulation. Curr Opin Genet Dev. 2002;12:142–148. doi: 10.1016/s0959-437x(02)00279-4. [DOI] [PubMed] [Google Scholar]
- Campanero MR, Armstrong MI, Flemington EK. CpG methylation as a mechanism for the regulation of E2F activity. Proc Natl Acad Sci USA. 2000;97:6481–6486. doi: 10.1073/pnas.100340697. [DOI] [PMC free article] [PubMed] [Google Scholar]
- Fang MZ, Wang Y, Ai N, Hou Z, Sun Y, Lu H, Welsh W, Yang CS. Tea polyphenol (-)-epigallocatechin-3-gallate inhibits DNA methyltransferase and reactivates methylation-silenced genes in cancer cell lines. Cancer Res. 2003;63:7563–7570. [PubMed] [Google Scholar]
- Fassina G, Venè R, Morini M, Mingheli S, Benelli R, Noonan D, Albini A. Mechanisms of inhibition of tumor angiogenesis and vascular tumor growth by epigallocatechin-gallate. Clin Cancer Res. 2004;10:4865–4873. doi: 10.1158/1078-0432.CCR-03-0672. [DOI] [PubMed] [Google Scholar]
- Guilleret I, Benhattar J. Demethylation of the human telomerase catalytic subunit (hTERT) gene promoter reduced hTERT expression and telomerase activity and shortened telomeres. Exp Cell Res. 2003;289:326–334. doi: 10.1016/s0014-4827(03)00281-7. [DOI] [PubMed] [Google Scholar]
- Guilleret I, Benhattar J. Unusual distribution of DNA methylation within the hTERT CpG island in tissues and cell lines. Biochem Biophys Res Commun. 2004;325:1037–1043. doi: 10.1016/j.bbrc.2004.10.137. [DOI] [PubMed] [Google Scholar]
- Huh SW, Bae SM, Kim YW, Lee JM, Namkoong SE, Lee IP, Kim SH, Kim CK, Ahn WS. Anticancer effects of (-)-epigallocatechin-3-gallate on ovarian carcinoma cell lines. Gynecol Oncol. 2004;49:760–768. doi: 10.1016/j.ygyno.2004.05.031. [DOI] [PubMed] [Google Scholar]
- Jon W, Shim JY, Zhu B. Mechanisms for the inhibition of DNA methyltransferases by tea catechins and bioflavonoids. Mol Pharmacol. 2005;68:1018–1030. doi: 10.1124/mol.104.008367. [DOI] [PubMed] [Google Scholar]
- Krajewski WE. Histone acetylation status and DNA sequence modulate APT-dependant nucleosome repositioning. J Biol Chem. 2002;277:14509–14513. doi: 10.1074/jbc.M107510200. [DOI] [PubMed] [Google Scholar]
- Lee S, Lee HJ, Kim HJ, Lee HS, Jang JJ, Kang GH. Aberrant CpG island hypermethylation along multistep hepatocarcinogenesis. Am J Pathol. 2003;163:1371–1378. doi: 10.1016/S0002-9440(10)63495-5. [DOI] [PMC free article] [PubMed] [Google Scholar]
- Lee AH, Fraser ML, Meng X, Binns CW. Protective effects of green tea against prostate cancer. Expert Rev Anticancer Ther. 2006;6:507–513. doi: 10.1586/14737140.6.4.507. [DOI] [PubMed] [Google Scholar]
- Lin JK, Liang YC. Cancer chemoprevention by tea polyphenols. Proc Natl Sci Counc Repub China B. 2000;24:1–13. [PubMed] [Google Scholar]
- Lin S, Li W, Shih J, Hong K, Pan Y, Lin J. The tea polyphenols EGCG and EGC repress mRNA expression of human telomerase reverse transcriptase (hTERT) in carcinoma cells. Cancer Lett. 2006;236:80–88. doi: 10.1016/j.canlet.2005.05.003. [DOI] [PubMed] [Google Scholar]
- Liu L, Saldanha S, Pate M, Andrews L, Tollefsbol T. Epigenetic regulation of human telomerase reverse transcriptase promoter activity during cellular differentiation. Genes Chromosomes Cancer. 2004;41:26–37. doi: 10.1002/gcc.20058. [DOI] [PubMed] [Google Scholar]
- Meyerson M, Counter CM, Eaton EN, Ellisen LW, Steiner P, Caddle SD, Ziaugra L, Beijersbergen RL, Davidoff MJ, Liu Q, Bacchetti S, Haber DA, Weinberg RA. hEST2, the putative human telomerase catalytic subunit gene, is up-regulated in tumor cells and during immortalization. Cell. 1997;90:785–795. doi: 10.1016/s0092-8674(00)80538-3. [DOI] [PubMed] [Google Scholar]
- Mittal A, Pate M, Wylie R, Tollefsbol TO, Katiyar SK. EGCG down-regulates telomerase in human breast carcinoma MCF-7 cells, leading to suppression of cell viability and induction of apoptosis. Int J Oncol. 2004;24:703–710. [PubMed] [Google Scholar]
- Naasani I, Seimiya H, Tsuruo T. Telomerase inhibition, telomere shortening and senescence of cancer cells by tea catechins. Biochem Biophys Res Commun. 1998;249:391–396. doi: 10.1006/bbrc.1998.9075. [DOI] [PubMed] [Google Scholar]
- Nakachi K, Equchi H, Imai K. Can teatime increase one’s lifetime? Ageing Res Rev. 2003;2:1–10. doi: 10.1016/s1568-1637(02)00047-8. [DOI] [PubMed] [Google Scholar]
- Okano M, Bell DW, Haber DA, Li E. DNA methyltransferases Dnmt3a and Dnmt3b are essential for de novo methylation and mammalian development. Cell. 1999;99:247–257. doi: 10.1016/s0092-8674(00)81656-6. [DOI] [PubMed] [Google Scholar]
- Perini G, Diolaiti D, Porro A, Della Valle G. In vivo transcriptional regulation of N-Myc target genesis controlled by E-box methylation. Proc Natl Acad Sci USA. 2005;102:12117–12122. doi: 10.1073/pnas.0409097102. [DOI] [PMC free article] [PubMed] [Google Scholar]
- Quante M, Heeg S, von Werder A, Goessel G, Fulda C, Doebele M, Nakagawa H, Beijersbergen R, Blum H, Opitz O. Differential transcriptional regulation of human telomerase in a cellular model representing important genetic alterations in esophageal squamous carcinogenesis. Carcinogenesis. 2005;26:1879–1889. doi: 10.1093/carcin/bgi153. [DOI] [PubMed] [Google Scholar]
- Renaud S, Loukinov D, Abullaev Z, Guilleret I, Bosman FT, Lobanenkov V, Benhattar J. Dual role of DNA methylation inside and outside of CTCF-binding regions in the transcriptional regulation of the telomerase hTERT gene. Nucleic Acids Res. 2007 doi: 10.1093/nar/gkl1125. doi:10.1093/nar/gkl1125. [DOI] [PMC free article] [PubMed] [Google Scholar]
- Rice JC, Briggs SD, Ueberheide B, Barber CM, Shabanowitz J, Hunt DF, Shinkai Y, Allis CD. Histone methyltransferases direct different degrees of methylation to define distinct chromatin domains. Mol Cell. 2003;12:1591–1598. doi: 10.1016/s1097-2765(03)00479-9. [DOI] [PubMed] [Google Scholar]
- Robertson K, Ali-Si-Ali S, Yokochi T, Wade P, Jones P, Wolffe A. DNMT1 forms a complex with Rb, E2F1, and HDAC1 and represses transcription from E2F-responsive promoters. Nat Genet. 2000;25:338–342. doi: 10.1038/77124. [DOI] [PubMed] [Google Scholar]
- Roy A, Baliga M, Katiyar SK. Epigallocatechin-3-gallate induces apoptosis in estrogen receptor-negative human breast carcinoma cells via modulation in protein expression of p53 and Bax and caspase-3 activation. Mol Cancer Ther. 2005;4:81–90. [PubMed] [Google Scholar]
- Shammas M, Koley H, Batchu R, Bertheau R, Protopopov A, Munshi N, Goyal R. Telomerase inhibition by siRNA causes senescence and apoptosis in Barrett’s adenocarcinoma cells: Mechanism and therapeutic potential. Mol Cancer. 2005;4 doi: 10.1186/1476-4598-4-24. DOI: 10.1186/1476-4598-4-24. [DOI] [PMC free article] [PubMed] [Google Scholar]
- Weisberg J, Weissman D, Sedaghat T, Babich H. In vitro cytotoxicity of epigallocatechin gallate and tea extracts to cancerous and normal cells from the human oral cavity. Basic Clin Pharmacol Toxicol. 2004;95:191–200. doi: 10.1111/j.1742-7843.2004.pto_950407.x. [DOI] [PubMed] [Google Scholar]
- Won J, Yim J, Kim T. Opposing regulatory roles of E2F in human telomerase reverse transcriptase (hTERT) gene expression in human tumor and somatic cells. FASEB J. 2002;16:1943–1945. doi: 10.1096/fj.02-0311fje. [DOI] [PubMed] [Google Scholar]
- Zakian VA. Telomeres: Beginning to understand the end. Science. 1995;270:1601–1607. doi: 10.1126/science.270.5242.1601. [DOI] [PubMed] [Google Scholar]
- Zinn RL, Pruitt K, Eguchi S, Baylin SB, Herman JG. hTERT is expressed in cancer cell lines despite promoter DNA methylation by preservation of unmethylated DNA and active chromatin around the transcriptional start site. Cancer Res. 2007;1:194–201. doi: 10.1158/0008-5472.CAN-06-3396. [DOI] [PubMed] [Google Scholar]
- Zou L, Zhang P, Luo C, Tu Z. Mad1 suppresses bladder cancer cell proliferation by inhibiting human telomerase reverse transcriptase transcription and telomerase activity. Urology. 2006;67:1335–1340. doi: 10.1016/j.urology.2005.12.029. [DOI] [PubMed] [Google Scholar]