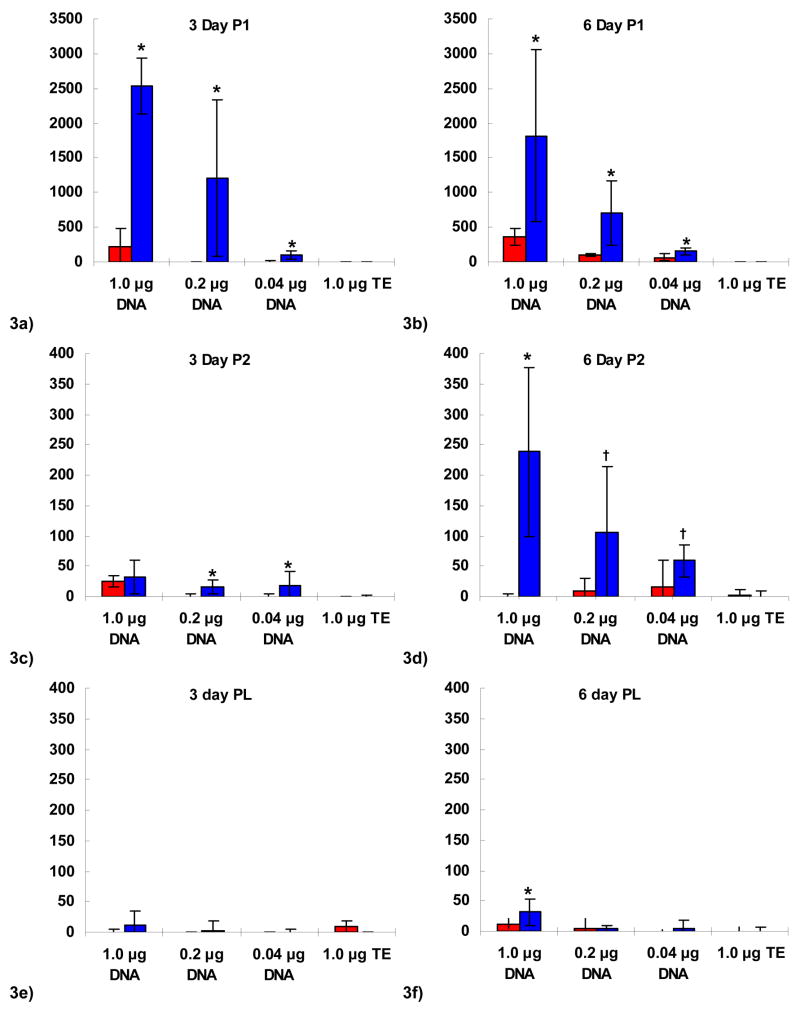
Figure 3.
Luciferase activity expressed as relative light units following transfection of the P388D1 murine macrophage cell line shown at day 3 (a,c,e) and day 6 (b,d,f) for P1 polymer (a,b), P2 polymer (c,d), and PLGA (e,f) microspheres in red, or PEI-blended microspheres in blue (n=5). Blank spheres (TE-loaded) shown for comparison. Activity expressed as light units relative to untreated cells. Comparison between PEI-containing and non-PEI microspheres by ANOVA and student t-test: * indicates p < 0.05; † indicates p < 0.07. Note y-axis scale change for P1 polymer (a,b).

