Abstract
Background and purpose: Rhein, an anthraquinone compound isolated from rhubarb, has been proved effective in treatment of experimental diabetic nephropathy (DN). To explore the mechanism of its therapeutic effect on DN, rhein was tested for its effect on the hexosamine pathway.
Experimental approach: The influence of rhein on cellular hypertrophy, fibronectin synthesis, glucose uptake, glutamine: fructose 6-phosphate aminotransferase (GFAT) activity, UDP-N-acetylglucosamine (UDP-GlcNAc) level and TGF-β1 and p21 expression was evaluated in MCGT1 cells, a GLUT1 transgenic rat mesangial cell line. GFAT activity in normal rat mesangial cells in high glucose concentrations and in vitro was also measured.
Key results: Significantly increased fibronectin synthesis, cellular hypertrophy, much higher GFAT activity and UDP-GlcNAc level and increased TGF-β1 and p21 expression were found in MCGT1 cells cultured in normal glucose concentration. Rhein treatment decreased all these features of MCGT1 cells but did not exert a direct effect on GFAT enzymatic activity.
Conclusions and implications: There was over-activity of the hexosamine pathway in MCGT1 cells, which may explain the higher expression of TGF-β1 and p21, the cellular hypertrophy and the increased expression of extracellular matrix (ECM) components in the cells. By inhibiting the increased activity the hexosamine pathway, rhein decreased TGF-β1 and p21 expression and thus contributed to the decreased cellular hypertrophy and ECM synthesis. Inhibition of the hexosamine pathway may be one of the mechanism through which rhein exerts its therapeutic role in diabetic nephropathy.
Keywords: rhein, hexosamine pathway, GLUT1, mesangial cells, diabetic nephrology, anthraquinone compound
Introduction
As a major complication of diabetes, diabetic nephropathy (DN) has been a major cause of end-stage renal disease (Locatelli et al., 2003) and hyperglycaemia is a major risk factor for the development of DN (Molitch, 1997; Phillips and Molitch, 2002). Hyperglycaemia causes abnormalities in blood flow and increased vascular permeability, overproduction and deposition of extracellular matrix (ECM). It can also induce a sustained growth inhibition of mesangial cells and subsequent cellular hypertrophy, along with a decreased production of trophic factors for endothelial cells. These changes lead to renal mesangial matrix expansion, glomerular hypertrophy, loss of renal cells, glomerulosclerosis and other pathological changes in the kidney (Ayo et al., 1991; Wolf et al., 1992; Wardle, 1994; Wahab et al., 1996; van Det et al., 1996; Browniee, 2001). Four major molecular mechanisms have been implicated in the hyperglycaemia-induced damage which are as follows: increased flux through the polyol pathway, increased formation of advanced glycation end products, activation of PKC isoforms and increased activity of the hexosamine pathway. Among them, the hexosamine pathway is believed to be a sensor of nutrients and an increased activity of the hexosamine pathway is a key factor involved in the metabolic disturbances of diabetes (Marshall et al., 1991; Hebert et al., 1996; McClain and Crook, 1996; Hawkins et al., 1997; Patti et al., 1999; Tang et al., 2000; Obici et al., 2002).
In our previous work, rhein (4,5-dihydroxyanthraquinone-2-carboxylic acid), an anthraquinone compound isolated from rhubarb, a traditional Chinese medicinal plant, has been proved effective in treatment of DN in model animals (Jia et al., 2007). One of our findings was that rhein attenuated hyperglycaemia and hyperlipidaemia accompanied by increased insulin sensitivity. However, the mechanism of these effects of rhein remained unclear. Considering the importance of the hexosamine pathway in the metabolic disorders under diabetic conditions, we have postulated that rhein might influence the flux through the hexosamine pathway and thus exert its therapeutic effect in DN.
The transgenic mesangial cell line, MCGT1, overexpresses the glucose transporter 1 (GLUT1), compared with the control MCLacZ cells, another rat mesangial cell line transduced by bacterial β-galactosidase gene, LacZ. Because of the overexpression of GLUT1, glucose uptake in MCGT1 cells is markedly increased and MCGT1 cells display a diabetic mesangial phenotype, with increased synthesis of ECM components and cellular hypertrophy, even when cultured in normal glucose concentrations (Heilig et al., 1995).
In the present study, MCGT1 cells were used as a model to mimic the mesangial cells under diabetic conditions. The influence of rhein on ECM synthesis, cellular hypertrophy and activity of the hexosamine pathway in MCGT1 cells was investigated. We also examined whether rhein could influence transforming growth factor-β1 (TGF-β1) and p21 synthesis.
Methods
Cell culture
Glucose transporter 1 transgenic mesangial cell line, MCGT1, and bacterial β-galactosidase transgenic mesangial cell line, MCLacZ, were kindly provided by Dr Heilig (University of Rochester Medical Center, USA) (Heilig et al., 1995). Except where indicated, MCGT1 and MCLacZ cell lines were seeded into a 24-well plate at a density of 6 × 10⁴ cells per well or into a six-well plate at a density of 2.5 × 10⁵ cells per well and grown in RPMI-1640 medium containing 8 mM glucose, 20% newborn calf serum. A glucose concentration of 8 mM was considered as normal. Lower concentrations of glucose were not used because these mesangial cells show deficient growth when maintained in the physiological concentration of 5 mM (Heilig et al., 1995).
Normal rat mesangial cells were obtained from 4-week-old male Sprague–Dawley rats as described (Kreisberg and Karnovsky, 1983; Liu et al., 1996). The cells were cultured in RPMI-1640 supplemented with 20% fetal calf serum, 100 U ml−1 penicillin and 100 μg ml−1 streptomycin. Cells were used between passages 12 and 16.
Analysis of cell size, RNA/DNA and protein/DNA ratio by flow cytometry
Cells were seeded into six-well plates (2.5 × 10⁵ cells per well). When it was 80% confluent, the cells were serum-starved in RPMI-1640 medium containing 0.5% BSA for 12 h. Then, the cells were detached from the plates with trypsin, washed with phosphate-buffered saline (PBS) containing 0.5% BSA and dispersed to obtain a single-cell suspension. Relative cell size for 5000 cells in each sample was determined by quantification of forward light scattering using a COULTER EPICS XL flow cytometer (Beckman, Miami, FL, USA) directly. To measure the RNA/DNA ratio, 8 × 10⁵ mesangial cells were washed in 10 mM HEPES buffer containing 0.88% NaCl, 0.1% sodium azide and 4% fetal bovine serum twice, re-suspended in 1 ml of phosphate-citrate buffer (pH 6.0) containing 0.15 mM NaCl, 5 mM sodium EDTA, 0.5% BSA and 0.02% saponin and incubated in dark for 30 min. Then, 7-amino-actinomycin D was added to the cells (to a final concentration of 25.5 μg ml−1) and incubated for another 30 min to dye the cellular DNA. The cells were washed and re-suspended in phosphate-citrate buffer again. After incubation in an ice bath for 10 min, 0.5 μM pyronine Y (PY) was added to the cell to dye the cellular RNA. Ten minutes later, the cells were washed and subjected to flow cytometry assay. The cellular fluorescence emission caused by 7-amino-actinomycin D dyeing and PY dyeing was measured by flow cytometry respectively. The ratio of the mean PY fluorescence intensity to the mean 7-amino-actinomycin D fluorescence intensity represented the RNA/DNA ratio. To measure the protein/DNA ratio, mesangial cells were fixed in 70% ice-cold ethanol, and re-suspended in 1 ml dyeing solution containing 50 μg ml−1 RNase, 15 μg ml−1 propidium iodide (PI) and 0.05 μg ml−1 fluorescein isothiocyanate (FITC) and incubated in dark for 1 h. Both the cellular PI fluorescence and FITC fluorescence were measured and the ratio of the mean FITC fluorescence intensity to the mean PI fluorescence intensity represented the protein/DNA ratio.
Measurement of fibronectin protein by flow cytometry
Mesangial cells were seeded into six-well plates (2.5 × 10⁵ cells per well). When they were 80% confluent, the cells were harvested. About 8 × 10⁶ cells were collected and fixed in 1% paraformaldehyde solution for 15 min. After being washed with PBS, the cells were treated by 0.1% saponin to increase the permeability of plasma membrane. Then, the cells were incubated for 45 min at 4 °C with rabbit anti-mouse fibronectin multiclonal antibody (1:100). After washing, the cells were incubated with 20 μl of 1:100 diluted FITC-conjugated swine anti-rabbit for another 45 min. Then the cells were washed again and subjected to flow cytometry. The mean fluorescence index was used to represent the quantity of fibronectin.
Measurement of fibronectin and TGF-β1 mRNA levels
Mesangial cells were seeded (2.5 × 10⁵ cells per well) into six-well plates. When they were 80% confluent, the cells were collected, and the total RNA was extracted with Trizol reagent. A total of 2 μg of the RNA was reversely transcribed with a Reverse Transcription System kit using random primer in a total volume of 20 μl according to the manufacturer's protocol. Real-time PCR was performed to measure the mRNA levels of fibronectin, TGF-β1 and β-actin for each sample in separate wells in duplicate on an ABI Prism 7000 Sequence Detection System (Applied Biosystems, Foster City, CA, USA) using 1 μl of cDNA, 250 nM primers and SYBR Green PCR Master Mix. For both β-actin and fibronectin, the parameters included a single cycle of 95 °C for 10 min followed by 40 cycles of 95 °C for 15 s, and 61 °C for 1 min. For TGF-β1, the parameters were a single cycle of 95 °C for 10 min followed by 40 cycles of 95 °C for 20 s, and 63 °C for 1 min. The primers used were as follows: fibronectin sense, 5′-GCAGCCCACAGTGGAGTATGT-3′; and fibronectin antisense, 5′-TTCTTTCATTGGTCCGGTCTT-3′; β-actin sense, 5′-AACGGAGCTCAGTAACAGTC-3′; and β-actin antisense, 5′-ATCCGTAAAGACCTCTATGC-3′; TGF-β1 sense, 5′-AGTGGATCCACGAGCCCAA-3′; and TGF-β1 antisense, 5′-AGGAGCGCACGATCATGTT-3′. Specificity of the PCR products was established by melting curve analysis and by running the products on a 1.5% agarose gel to verify the size. The mRNA levels of fibronectin and TGF-β1 were related to that of β-actin. ΔCt was determined by subtracting the mean Ct (threshold cycle) value derived from β-actin from the fibronectin or TGF-β1 Ct. ΔΔCt was obtained by subtracting the mean ΔCt of the control MCLacZ cells from the ΔCt of each sample. Relative expression was then calculated using the equation RL=2−ΔΔCt. Here, RL represents the relative level of fibronectin mRNA or TGF-β1 mRNA.
Measurement of glucose uptake
Mesangial cells were seeded into 24-well plates as above. When they were 80% confluent, medium was replaced by HEPES solution (20 mM HEPES, 140 mM NaCl, 1 mM CaCl2, 5 mM KCl, 2.5 mM MgSO4, 0.1% BSA, pH 7.4) and incubated for 30 min. Then, the solution was removed and 0.5 ml of fresh HEPES solution containing 8 mM glucose and 1 μCi ml−1 3H-labelled 2-deoxy-D-glucose was added to the cells. After another incubation at 37 °C for 20 min, the cells were washed three times with HEPES solution, lysed with 1 N NaOH and neutralized with hydrochloric acid. Then, the radioactivity of each sample was measured by using liquid scintillation counter (Beckman, Miami, FL, USA).
Assay of GFAT activity
Activity of glutamine:fructose 6-phosphate aminotransferase (GFAT) was measured using a colorimetric method (Ye et al., 2004). Briefly, mesangial cells were seeded (2.5 × 10⁵ cells per well) into six-well plates as above. When they were 80% confluent, the cells of each well were washed twice with ice-cold PBS and scraped with 250 μl of GFAT buffer (50 mM Tris, 5 mM EDTA, 5 mM glutathione, 5 mM glucose-6-phosphate Na2 and 50 mM KCl; pH 7.8). Then, the cells were sonicated, centrifuged and the supernatant was collected. In a typical assay, the reaction began after the supernatant (100 μl per well) was added to a 96-well plate that already contained 100 μl per well of reaction buffer (8 mM fructose-6-phosphate, 6 mM glutamine, 3 mM acetylpyridine adenine dinucleotide, 50 mM KCl, 100 mM KH2PO4 and 6 U glutamate dehydrogenase; pH 7.8). The plate was shaken at 37 °C for 90 min. Then the changes in absorbance at 370 nm were measured. The glutamate formed in the reaction was calculated according to the change of absorbance in the sample and the standard curve of glutamate. In the mean while, the total protein of the supernatant was quantified by Coomassie brilliant blue-based Bradford method. A unit of enzyme activity was defined as 1 nmol glutamate formed per mg protein per min at 37 °C.
Measurement of UDP-N-acetylglucosamine
UDP-N-acetylglucosamine (UDP-GlcNAc) was determined by capillary electrophoresis method (Tang et al., 2000). Briefly, mesangial cells were cultured in six-well plates as above. When they were 80% confluent, the cells were collected and washed three times with cold PBS. A total of 100 μl of 60% acetonitrile solution containing 0.5% Triton X-100 was added to 5 × 10⁵ cells. Then the sample was homogenized at 4 °C, and centrifuged at 12 000 g for 10 min. The supernatant was used for capillary electrophoresis assay, whereas the commercially available UDP-GlcNAc was used as control.
Measurement of TGF-β1
Mesangial cells were lysed in 1 mM phenylmethylsulphonyl fluoride, 1% NP-40, 1 mM sodium orthovanadate, 10 mM sodium fluoride, 5 μg ml−1 leupeptin, 5 μg ml−1 pepstatin A, 5 μg ml−1 aprotinin and 40 mM Tris-HCl, pH 7.4. The total protein concentration of each sample was measured by Coomassie brilliant blue-based Bradford method. After treatment with 0.1 N HCl for 10 min, the samples were neutralized with 0.1 N NaOH and then assayed for TGF-β1 level using a commercially available ELISA kit according to the manufacturer's protocol (Yu et al., 2004; Huang et al., 2006). The total protein concentration was used to normalize the TGF-β1 level.
Western blot analysis
At the end of the treatment period, cells were washed and collected in a cell and tissue protein extraction reagent. The protein was extracted according to the manufacturer's protocol. Samples were then boiled for 5 min, loaded on to an SDS/10% polyacrylamide gel, electrophoresed and transferred on to a polyvinylidenefluoride membrane. The membranes were blocked with 5% (w v−1) milk in PBST (PBS containing 0.05% Tween) and blotted with rabbit anti-p21 polyclonal antibody (1:1000) or monoclonal anti-glyceraldehyde 3-phosphate dehydrogenase (GAPDH) antibody in the blocking solution. After extensive washing, the membranes were blotted with secondary antibody. The signal was visualized by enhanced chemiluminescence.
Statistical analysis
All values are means±s.e.mean. Statistical significance between groups was analysed by one-way ANOVA followed by the Student–Newman–Keuls multiple comparisons tests. A P-value of <0.05 was considered significant.
Materials
Pyronine Y, 7-amino-actinomycin D, PI, FITC, UDP-GlcNAc, acetylpyridine adenine dinucleotide, saponin, glutamate dehydrogenase and BSA were from Sigma-Aldrich (St Louis, Missouri, USA). RPMI-1640 medium, newborn calf serum, Trizol and anti-mouse fibronectin multiclonal antibody were from Gibco (Carlsbad, CA, USA). FITC-conjugated swine anti-rabbit IgG was from DAKO (Glostrup, Denmark). Reverse Transcription System kit was from Promega Corporation (Madison, WI, USA). SYBR Green PCR Master Mix was from Applied Biosystems (Foster City, CA, USA). 3H-labelled 2-deoxy-D-glucose was from Amersham Biosciences (Uppsala, Sweden). TGF-β1 ELISA kit was from R&D Systems (Minneapolis, Minnesota, USA). Rabbit anti-p21 polyclonal antibody was from Abcam (Cambridge, Massachusetts, USA). Cell & Tissue Protein Extraction Reagent, monoclonal anti-GAPDH antibody and chemiluminescence detection kit were from Kangchen Bio-Tech (Shanghai, China). Rhein (purity >98%, identified by high-performance liquid chromatography analysis) was provided by China Pharmacology University (Nanjing, Jiangsu Province, China).
Results
Rhein inhibited hypertrophy of MCGT1 cells
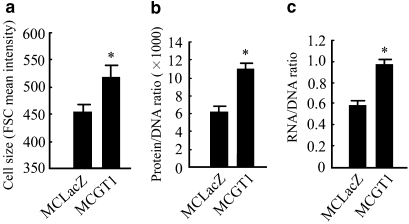
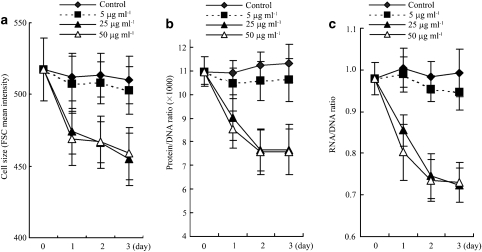
Three variables, cell size, cellular protein/DNA and RNA/DNA ratios, were measured to evaluate cellular hypertrophy. As shown in Figure 1, MCGT1 cells have a much larger cell size (P<0.01), higher protein/DNA (P<0.01) and RNA/DNA ratio (P<0.01) compared with the control MCLacZ cells, indicating that significant cellular hypertrophy indeed exists in MCGT1 cells cultured in normal glucose concentration. However, rhein treatment inhibited the cellular hypertrophy of MCGT1 cells, as shown by a smaller cell size, lower protein/DNA and RNA/DNA ratio in rhein-treated MCGT1 cells (Figure 2). Dose–effect experiments revealed that 25 μg ml−1 rhein was enough for a maximal effect in inhibiting the hypertrophy of MCGT1 cells. Time course experiments (Figure 2c) demonstrated that the hypertrophy-inhibiting effect of rhein in MCGT1 cells was evident starting from 24 h, and reached its maximum after 48 h of treatment.
Figure 1.
MCGT1 cells cultured in normal glucose concentration show significant hypertrophy. Both MCLacZ and MCGT1 cells were cultured in medium with 8 mM glucose. The cell size, RNA/DNA and protein/RNA ratio were analysed by flow cytometric methods. The mean intensity of forward scatter count (FSC) was used to represent cell size (a). To measure protein/DNA ratio, cells were dyed in solutions containing 50 μg ml−1 RNase, 15 μg ml−1 propidium iodide and 0.05 μg ml−1 FITC, and the relative cellular fluorescence caused by propidium iodide and FITC represented the relative amount of cellular protein and DNA (b). To measure RNA/DNA ratios, cellular DNA was dyed with 25 μg ml−1 of 7-amino-actinomycin whereas cellular RNA was marked with 0.5 μM pyronine Y, and the relative cellular fluorescence caused by the two dyes represented the relative amount of cellular RNA and DNA (c). Each value represents the mean±s.e.mean of six samples. *P<0.01 vs MCLacZ cells. FITC, fluorescein isothiocyanate.
Figure 2.
Rhein inhibited the hypertrophy of MCGT1 cells. MCGT1 cells were exposed to 5, 25 or 50 μg ml−1 of rhein for 3 days. On each day, the cells were collected and the cell size (a), protein/RNA (b) and RNA/DNA (c) ratio were analysed by flow cytometric methods described in the methods section. Each value represents the mean±s.e.mean of six samples. FCS, forward scatter counter.
Rhein inhibited fibronectin synthesis in MCGT1 cells
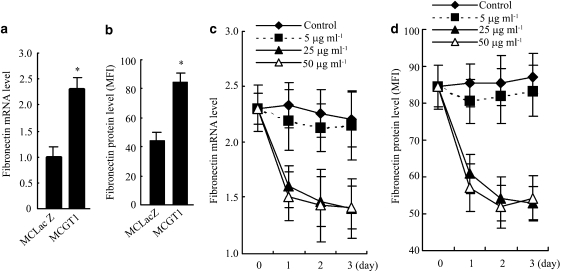
The influence of rhein on the synthesis of fibronectin, one of the major ECM components synthesized by mesangial cells, was evaluated by both mRNA and protein levels. As shown in Figures 3a and b, even in normal glucose concentration, MCGT1 cells synthesized much more fibronectin mRNA and protein. However, treatment with rhein at 25 or 50 μg ml−1 for 24 h significantly reduced both the fibronectin mRNA and protein levels (P<0.01; Figures 3c and d). Dose–effect and time course experiments demonstrated that a concentration of 25 μg ml−1 and an exposure time of 2 days (48 h) were enough for rhein to reach its maximal effect in inhibiting fibronectin synthesis (Figure 3) and cellular hypertrophy (Figure 2) in MCGT1 cells. To avoid the potential cytotoxicity of higher concentrations and longer times of treatment, the concentration of 25 μg ml−1 and the treatment time of 48 h were used in the subsequent experiments.
Figure 3.
Rhein inhibited the synthesis of fibronectin in MCGT1 cells. Cells were cultured in medium with 8 mM glucose. The fibronectin mRNA level was analysed by real-time PCR and the result was normalized to β-actin and was expressed as fold change compared with that of control MCLacZ cells. The fibronectin protein level was measured by flow cytometric methods and the result shown as the value of mean fluorescence index (MFI). A much higher level of fibronectin mRNA and protein was found in MCGT1 cells, compared with that in MCLacZ cells (a and b). Treatment with 25 or 50 μg ml−1 of rhein significantly decreased both the fibronectin mRNA and protein levels in MCGT1 cells (c and d). Each value represents the mean±s.e.mean of six samples. *P<0.01 vs MCLacZ cells.
Rhein partly reduced glucose uptake in MCGT1 cells
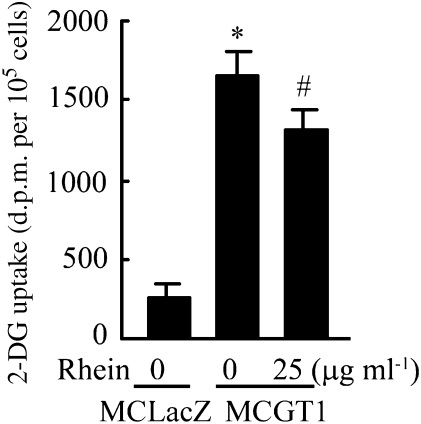
To evaluate the influence of rhein on glucose transport, the uptake of glucose in mesangial cells with or without rhein was measured over 20 min, in media with a final concentration of 8 mM glucose. As shown in Figure 4, the uptake of glucose in MCGT1 cells was much higher than that in MCLacZ cells (P<0.01) and the addition of 25 μg ml−1 rhein reduced the glucose uptake in MCGT1 cells by 20% (P<0.05).
Figure 4.
Rhein reduced glucose uptake by MCGT1 cells. Cells were incubated in 0.5 ml of HEPES solution containing 8 mM glucose and 0.5 μCi 3H-labelled 2-deoxy-D-glucose (2-DG). In the treated group, 25 μg ml−1 rhein was added to the solution at the same time. After incubation at 37 °C for 20 min, the cells were washed three times and the radioactivity was measured by using liquid scintillation counter. The cellular amount of 3H-labelled 2-DG represented the amount of glucose absorbed by the cell and was expressed as d.p.m. per 105 cells. Each value represents the mean±s.e.mean of six samples. *P<0.01 vs MCLacZ cells. #P<0.05 vs untreated MCGT1 cells.
Rhein inhibited overactivity of the hexosamine pathway in MCGT1 cells
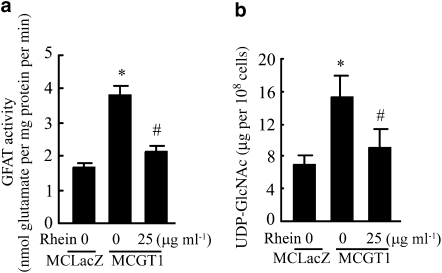
The activity of the hexosamine pathway was evaluated by measuring the activity of GFAT, the first and rate-limiting enzyme, and the level of UDP-GlcNAc, the end product of the pathway. The GFAT activity of MCGT1 cells was 230% of that in MCLacZ cells. However, treatment with rhein (25 μg ml−1) for 48 h reduced GFAT activity of MCGT1 cells by 45% (Figure 5a). Correspondingly, UDP-GlcNAc levels in MCGT1 cells were also much higher than those in MCLacZ cells (Figure 5b; P<0.01). The UDP-GlcNAc level of MCGT1 cells was again significantly reduced after 48 h of treatment with rhein (25 μg ml−1) (Figure 5b; P<0.01).
Figure 5.
Rhein decreased GFAT activity and UDP-GlcNAc level in MCGT1 cells. GFAT activity was measured using a glutamine dehydrogenase-based colorimetric method, which evaluates the GFAT activity by determining the amount of glutamate, a product of the GFAT reaction (a). Cellular UDP-N-acetylglucosamine level was determined by capillary electrophoresis method (b). Each value represents the mean±s.e.mean of six samples. *P<0.01 vs MCLacZ cells. #P<0.01 vs untreated MCGT1 cells. GFAT, glutamine:fructose 6-phosphate aminotransferase; UDP-GlcNAc, UDP-N-acetylglucosamine.
Rhein inhibited high glucose-induced GFAT activity in rat mesangial cells
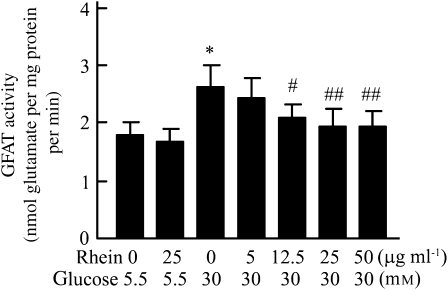
To determine whether rhein also has an effect on GFAT activity in normal mesangial cells, normal rat mesangial cells were cultured in high-glucose media (30 mM glucose), with or without rhein. Subsequent in vitro analysis of the GFAT activity revealed that exposure of normal mesangial cells to 30 mM glucose for 24 h caused a 1.5-fold increase in GFAT activity, compared with the mesangial cells maintained in medium with 5.5 mM glucose (control), and the presence of rhein inhibited this increase in a dose-dependent manner (Figure 6).
Figure 6.
Rhein inhibited GFAT activity induced by high glucose in normal rat mesangial cells. Rat mesangial cells were seeded into six-well plates in RPMI-1640 medium containing 5.5 mM glucose. When they were 80% confluent, cells were divided into seven groups and fresh medium containing 5.5 or 30 mM glucose with or without rhein was added. After 24 h incubation, the cellular GFAT activity was assayed. Each value represents the mean±s.e.mean of six samples. *P<0.01 vs 5.5 mM glucose control group. #P<0.05 vs 30 mM glucose control group. ##P<0.01 vs 30 mM glucose control group. GFAT, glutamine:fructose 6-phosphate aminotransferase.
Rhein had no direct effect in inhibiting GFAT enzymatic activity
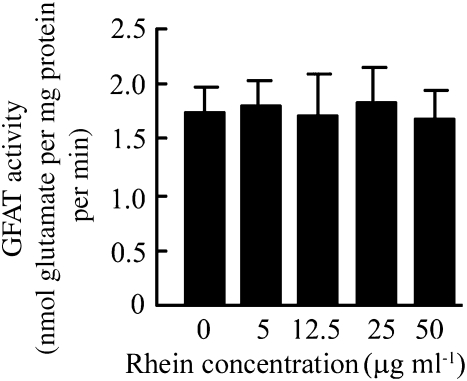
To determine whether rhein influences the enzymatic activity of GFAT directly, a range of concentrations of rhein (5–50 μg ml−1) was added to the assay for GFAT in vitro. Results showed that rhein had no direct effect on the enzymic activity of GFAT (Figure 7).
Figure 7.
Rhein had no direct effect on GFAT enzymatic activity. MCLacZ cells were normally cultured as above. When the cells were 80% confluent, the cells were scraped into GFAT buffer and the cellular supernatant, which contains GFAT, was obtained. Rhein (5–50 μg ml−1) was added directly to 100 μl of GFAT containing cellular supernatant and the GFAT activity was then measured as described above. Each value represents the mean±s.e.mean of six samples. GFAT, glutamine:fructose 6-phosphate aminotransferase.
Rhein decreased TGF-β1 and p21 expression
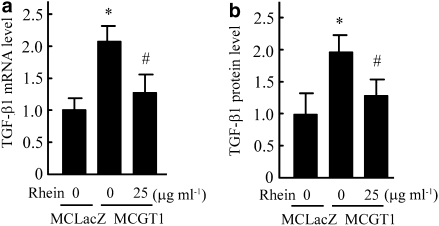
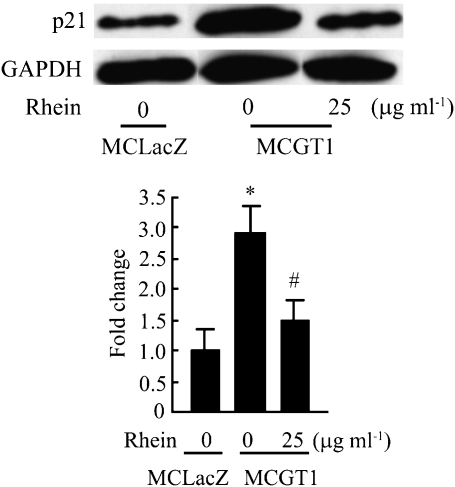
As an important growth factor, TGF-β1 plays a key role in the development and progression of DN. In mesangial cells, it contributes to both cellular hypertrophy and the increased expression of ECM components (Oh et al., 1998; Zheng et al., 2002). As a member of the cyclin-dependent kinase inhibitors, p21 has an important role in cell cycle regulation and is involved in growth arrest and hypertrophy of rat mesangial cells in response to high glucose concentrations (Wolf, 2000). Moreover, it has been reported that TGF-β1 could induce the expression of p21 and thus inhibit the progression of cell cycle (Masson et al., 2005). Therefore, the expression of TGF-β1 and p21 was measured in our experimental system. As shown in Figure 8, the expression level of TGF-β1 (as mRNA or protein) in MCGT1 cells was much higher than that in MCLacZ cells. Rhein treatment markedly decreased both TGF-β1 mRNA and protein levels. Also, increased expression of p21 protein was found in MCGT1 cells as compared with that in MCLacZ cells and, similarly, rhein treatment reduced the p21 protein level (Figure 9).
Figure 8.
Rhein decreased the expression of TGF-β1 in MCGT1 cells. After exposing MCGT1 cells to rhein (25 μg ml−1) for 48 h, the total RNA or protein was extracted. The TGF-β1 mRNA level was measured by real-time RT-PCR, the result was normalized to β-actin and was expressed as fold change compared with that of control MCLacZ cells (a). The TGF-β1 protein level was measured by ELISA method and the result was also expressed as fold change compared with that of MCLacZ cells (b). Each value represents the mean±s.e.mean of five samples. *P<0.01 vs MCLacZ cells. #P<0.01 vs untreated MCGT1 cells. RT-PCR, reverse transcriptase-PCR; TGF-β1, transforming growth factor-β1.
Figure 9.
Rhein decreased p21 expression in MCGT1 cells. MCGT1 cells were exposed to rhein (25 μg ml−1) for 48 h. Cells were then lysed and equal amounts of protein were immunoblotted with anti-p21 and anti-GAPDH antibodies. Representative immunoblots and quantification obtained by densitometric analysis of the bands are shown. Results were normalized to the GAPDH signal and were expressed as fold change compared with control. Each value represents the mean±s.e.mean of three samples. *P<0.01 vs MCLacZ cells. #P<0.01 vs untreated MCGT1 cells. GAPDH, glyceraldehyde 3-phosphate dehydrogenase.
Discussion and conclusions
The glomerular change in DN is characterized by glomerular hypertrophy and the deposition of ECM in the form of diffuse thickening of the peripheral basement membrane and mesangial expansion. The progressive accumulation of ECM in the mesangial areas and the associated encroachment on neighbouring capillaries is a major cause of the decline in glomerular function (Mauer et al., 1984). Evidence indicates that the increased deposition of ECM is closely associated with an altered ECM metabolism in mesangial cells, caused by elevated glucose. Glucose enters mesangial cells by a facilitated diffusion process. The specific integral membrane protein, GLUT1, is responsible for the transportation of glucose into mesangial cells down a glucose concentration gradient (Heilig et al., 1997; Inoki et al., 1999). In conditions of hyperglycaemia, elevated ambient glucose promotes the entry of more glucose into mesangial cells and causes cellular metabolic change. This can also be achieved by increasing the number of transporters that is, overexpression of the transporter protein, in the cell. Through transfection of mesangial cells with a GLUT1 retroviral expression vector, Heilig et al. (1995) successfully created a mesangial cell line overexpressing GLUT1, named MCGT1. MCGT1 cells exhibited the phenotype of diabetic mesangial cells (including increased expression of ECM components and cellular hypertrophy), even when grown in normal glucose concentrations.
In the present study, MCGT1 cells were used as a model to mimic mesangial cells in diabetic conditions. As shown in Figure 1, MCGT1 cells cultured in medium containing 8 mM glucose displayed significant hypertrophy. They also synthesized much more fibronectin. However, treatment with rhein (25 μg ml−1) for 24 h significantly decreased hypertrophy and fibronectin synthesis in MCGT1 cells. To explore the mechanism by which rhein exerts its effect, we first investigated the influence of rhein on glucose uptake in MCGT1 cells and found a partial reduction of glucose uptake (by about 20%). As increased uptake of glucose is the initial cause for the diabetic phenotype appearing in MCGT1 cells, the reduction of glucose uptake obviously should contribute to the phenotypic reversion of the cells. However, as rhein-treated MCGT1 cells still absorbed five times as much glucose as that of MCLacZ cells, other mechanisms must also contribute to the reversion of the diabetic phenotype.
As a sensor of nutrients, the hexosamine pathway has been found to be closely associated with the metabolic disturbance and cellular hypertrophy induced by high glucose (Masson et al., 2005, 2006). To investigate whether rhein affected the activity of this pathway, the influence of rhein on the activity of GFAT, the first and rate-limiting enzyme of the hexosamine pathway, and the level of UDP-GlcNAc, the end product of the pathway, was then analysed. Both GFAT activity and UDP-GlcNAc levels were significantly increased in MCGT1 cells, compared with those in the control MCLacZ cells, and both were markedly decreased after rhein treatment. Interestingly, rhein also prevented the increase in GFAT activity induced by high glucose (30 mM) in normal mesangial cells.
The growth factor, TGF-β1, is very important in the development and progression of DN. In mesangial cells, TGF-β1 is involved both in the stimulation of ECM synthesis and cellular hypertrophy caused by high glucose concentration (Oh et al., 1998; Zheng et al., 2002). Moreover, the hexosamine pathway did mediate the TGF-β1 production induced by high glucose in porcine mesangial cells (Kolm-Litty et al., 1998). TGF-β1 signals via a transmembrane serine/threonine kinase complex that phosphorylates SMAD proteins, thus stimulating the formation of SMAD heterocomplexes that regulate transcription of a large number of genes including cell-cycle regulators. SMAD complexes specifically upregulate p21 (Stull et al., 2004; Caldon et al., 2006). As a cyclin-dependent kinase inhibitor, p21 has also been found involved in the hypertrophy of renal mesangial cells in response to high glucose concentration (Wolf, 2000). As rhein can inhibit the overactivity of the hexosamine pathway in MCGT1 cells, this could lead to decreased TGF-β 1 and p21 levels in MCGT1 cells and such effects would contribute to the reversion of the diabetic phenotype of the cells. We found not only that the expression of TGF-β1 and p21 is increased in MCGT1 cells but also that these levels were decreased by treatment with rhein. Thus, rhein inhibited several features of the diabetic phenotype in MCGT1 cells, apparently by inhibiting the activity of GFAT, the rate-limiting step in the hexosamine pathway.
How could rhein influence GFAT activity? Theoretically, rhein might influence GFAT activity in two ways: by serving as a direct inhibitor of the enzyme and/or reducing the cellular level of the active form of GFAT. As we found no direct inhibition of GFAT activity in vitro, the latter mechanism is more likely. It has been reported that GFAT activity can be regulated by cAMP-dependent phosphorylation (Chang et al., 2000). Other reports suggest that a variety of factors can stimulate expression of GFAT in different cells (Traxinger and Marshall, 1991; Paterson and Kudlow, 1995; Simmons et al., 1999; Crook et al., 2000; Manzari et al., 2007). Particularly relevant here is that both angiotensin II and high glucose were able to stimulate GFAT expression transcriptionally (James et al., 2001). All these processes would be potential targets for the action of rhein. Another possible mode of action for which there is some supporting evidence is an action on cellular membranes. Rhein can decrease lymphocyte membrane fluidity (Beccerica et al., 1990) and by altering membrane-associated functions, rhein inhibited glucose uptake in Ehrlich ascites tumour cells (Castiglione et al., 1993). Furthermore, by interaction with mitochondrial membranes, rhein reduced mitochondrial membrane potential and affected cellular energy metabolism (Miccadei et al., 1993). Such interactions with cellular membranes (perhaps mitochondrial membranes) of MCGT1 cells would allow rhein to affect signal transduction in these cells, for example, the release of calcium and/or the level of cAMP, and subsequently influence the expression and/or the phosphorylation of GFAT and thus inhibit GFAT activity in these cells. Of course, as increased uptake of glucose is the initial cause of overactivity of the hexosamine pathway in MCGT1 cells, the 20% decrease of glucose uptake induced by rhein may also, in some degree, contribute to its the inhibitory effect on GFAT activity. However, all these suppositions need to be proved by further investigation.
In conclusion, we found that there was overactivity of the hexosamine pathway in MCGT1 cells, which may explain the higher expression of TGF-β1 and p21, the cellular hypertrophy and the increased expression of ECM components. Rhein inhibited the overactivity of the hexosamine pathway and thus decreased TGF-β1 and p21 expression. The decreased expression of TGF-β1 and p21 contributed to the decreased cellular hypertrophy and ECM synthesis in MCGT1 cells. As overactivity of the hexosamine pathway is one of the mechanisms underlying renal damage in diabetic conditions, the effect of rhein in inhibiting the activity of the hexosamine pathway may partially explain the therapeutic roles of rhein in experimental DN. However, this needs to be further substantiated in vivo.
Abbreviations
- DN
diabetic nephropathy
- ECM
extrsuppacellular matrix
- GFAT
glutamine:fructose 6-phosphate aminotransferase
- GLUT1
glucose transporter1
- PI
propidium iodide
- UDP-GlcNAc
UDP-N-acetylglucosamine
Conflict of interest
The authors state no conflict of interest.
References
- Ayo SH, Radnik RA, Glass WF, 2nd, Garoni JA, Rampt ER, Appling DR. Increased extracellular matrix synthesis and mRNA in mesangial cells grown in high-glucose medium. Am J Physiol. 1991;260:F185–F191. doi: 10.1152/ajprenal.1991.260.2.F185. [DOI] [PubMed] [Google Scholar]
- Beccerica E, Ferretti G, Curatola G, Cervini C. Diacetylrhein and rhein: in vivo and in vitro effect on lymphocyte membrane fluidity. Pharmacol Res. 1990;22:277–285. doi: 10.1016/1043-6618(90)90725-s. [DOI] [PubMed] [Google Scholar]
- Browniee M. Biochemistry and molecular cell biology of diabetic complications. Nature. 2001;414:813–820. doi: 10.1038/414813a. [DOI] [PubMed] [Google Scholar]
- Caldon CE, Daly RJ, Sutherland RL, Musgrove EA. Cell cycle control in breast cancer cells. J Cell Biochem. 2006;97:261–274. doi: 10.1002/jcb.20690. [DOI] [PubMed] [Google Scholar]
- Castiglione S, Fanciulli M, Bruno T, Evangelista M, Del Carlo C, Paggi MG, et al. Rhein inhibits glucose uptake in Ehrlich ascites tumor cells by alteration of membrane-associated functions. Anticancer Drugs. 1993;4:407–414. doi: 10.1097/00001813-199306000-00019. [DOI] [PubMed] [Google Scholar]
- Chang Q, Su K, Baker JR, Yang X, Paterson AJ, Kudlow JE. Phosphorylation of human glutamine:fructose-6-phosphate amidotransferase by cAMP-dependent protein kinase at serine 205 blocks the enzyme activity. J Biol Chem. 2000;275:21981–21987. doi: 10.1074/jbc.M001049200. [DOI] [PubMed] [Google Scholar]
- Crook ED, Simmons ST, Daniels M, Singh LP. Regulation of glutamine:fructose-6-phosphate amidotransferase activity by high glucose and transforming growth factor beta in rat mesangial cells. J Investig Med. 2000;48:427–434. [PubMed] [Google Scholar]
- Hawkins M, Barzilai N, Liu R, Hu M, Chen W, Rosetti L. Role of the glucosamine pathway in fat-induced insulin resistance. J Clin Invest. 1997;99:2173–2182. doi: 10.1172/JCI119390. [DOI] [PMC free article] [PubMed] [Google Scholar]
- Hebert LF, Jr, Daniels MC, Zhou J, Crook ED, Turner RL, Simmons ST. Overexpression of glutamine: fructose-6-phosphate amidotransferase in transgenic mice leads to insulin resistance. J Clin Invest. 1996;98:930–936. doi: 10.1172/JCI118876. [DOI] [PMC free article] [PubMed] [Google Scholar]
- Heilig CW, Concepcion LA, Riser BL, Freytag SO, Zhu M, Cortes P. Overexpression of glucose transporters in rat mesangial cells cultrued in a normal glucose medium mimics the diabetic phenotype. J Clin Invest. 1995;96:1802–1814. doi: 10.1172/JCI118226. [DOI] [PMC free article] [PubMed] [Google Scholar]
- Heilig CW, Liu Y, England RL, Freytag SO, Gilbert JD, Heilig Ko. -glucose stimulates mesangial cell GLUT1 expression and basal IGF-I-sensitive glucose uptake in rat mesangial cells: implications for diabetic nephropathy. Diabetes. 1997;46:1030–1039. doi: 10.2337/diab.46.6.1030. [DOI] [PubMed] [Google Scholar]
- Huang Y, Wongamorntham S, Kasting J, McQuillan D, Owens RT, Yu L, et al. Renin increases mesangial cell transforming growth factor-beta1 and matrix proteins through receptor-mediated, angiotensin II-independent mechanisms. Kidney Int. 2006;69:105–113. doi: 10.1038/sj.ki.5000011. [DOI] [PubMed] [Google Scholar]
- Inoki K, Haneda M, Maeda S, Koya D, Kikkawa R. TGF-beta 1 stimulates glucose uptake by enhancing GLUT1 expression in mesangial cells. Kidney Int. 1999;55:1704–1712. doi: 10.1046/j.1523-1755.1999.00438.x. [DOI] [PubMed] [Google Scholar]
- James LR, Ingram A, Ly H, Thai K, Cai L, Scholey JW. Angiotensin II activates the GFAT promoter in mesangial cells. Am J Physiol Renal Physiol. 2001;281:F151–F162. doi: 10.1152/ajprenal.2001.281.1.F151. [DOI] [PubMed] [Google Scholar]
- Jia ZH, Liu ZH, Zheng JM, Zeng CH, Li LS. Combined therapy of rhein and benazepril on the treatment of diabetic nephropathy in db/db mice. Exp Clin Endocrinol Diabetes. 2007;115:571–576. doi: 10.1055/s-2007-981469. [DOI] [PubMed] [Google Scholar]
- Kolm-Litty V, Sauer U, Nerlich A, Lehmann R, Schleicher ED. High glucose-induced transforming growth factor beta1 production is mediated by the hexosamine pathway in porcine glomerular mesangial cells. J Clin Invest. 1998;101:160–169. doi: 10.1172/JCI119875. [DOI] [PMC free article] [PubMed] [Google Scholar]
- Kreisberg JI, Karnovsky MJ. Glomerular cells in culture. Kidney Int. 1983;23:439–447. doi: 10.1038/ki.1983.40. [DOI] [PubMed] [Google Scholar]
- Liu ZH, Li LS, Hu WX, Zhou H. Effect of emodin on c-myc proto-oncogen expression in cultured rat mesangial cells. Acta Pharmacol Sin. 1996;17:61–63. [PubMed] [Google Scholar]
- Locatelli F, Canaud B, Eckardt KU, Stenvinkel P, Wanner C, Zoccali C. The importance of diabetic nephropathy in current nephrological practice. Nephrol Dial Transplant. 2003;18:1716–1725. doi: 10.1093/ndt/gfg288. [DOI] [PubMed] [Google Scholar]
- Manzari B, Kudlow JE, Fardin P, Merello E, Ottaviano C, Puppo M, et al. Induction of macrophage glutamine: fructose-6-phosphate amidotransferase expression by hypoxia and by picolinic acid. Int J Immunopathol Pharmacol. 2007;20:47–58. doi: 10.1177/039463200702000106. [DOI] [PubMed] [Google Scholar]
- Marshall S, Bacote V, Traxinger RR. Discovery of a metabolic pathway mediating glucose-induced desensitization of the glucose transport system: role of hexosamine biosynthesis in the induction of insulin resistance. J Biol Chem. 1991;266:4706–4712. [PubMed] [Google Scholar]
- Masson E, Wiernsperger N, Lagarde M, El Bawab S. Glucosamine induces cell-cycle arrest and hypertrophy of mesangial cells: implication of gangliosides. Biochem J. 2005;388 Part 2:537–544. doi: 10.1042/BJ20041506. [DOI] [PMC free article] [PubMed] [Google Scholar]
- Masson E, Lagarde M, Wiernsperger N, El Bawab S. Hyperglycemia and glucosamine-induced mesangial cell cycle arrest and hypertrophy: common or independent mechanisms. IUBMB Life. 2006;58:381–388. doi: 10.1080/15216540600755980. [DOI] [PubMed] [Google Scholar]
- Mauer SM, Steffes MW, Ellis EN, Sutherland DE, Brown DM, Goetz FC. Structural–functional relationships in diabetic nephropathy. J Clin Invest. 1984;74:1143–1155. doi: 10.1172/JCI111523. [DOI] [PMC free article] [PubMed] [Google Scholar]
- McClain DA, Crook ED. Hexosamines and insulin resistance. Diabetes. 1996;45:1003–1009. doi: 10.2337/diab.45.8.1003. [DOI] [PubMed] [Google Scholar]
- Miccadei S, Pulselli R, Floridi A. Effect of lonidamine and rhein on the phosphorylation potential generated by respiring rat liver mitochondria. Anticancer Res. 1993;13:1507–1510. [PubMed] [Google Scholar]
- Molitch ME. The relationship between glucose control and the development of diabetic nephropathy in type I diabetes. Semin Nephrol. 1997;17:101–113. [PubMed] [Google Scholar]
- Obici S, Wang J, Chowdury R, Feng Z, Siddhanta U, Morgan K. Identification of a biochemical link between energy intake and energy expenditure. J Clin Invest. 2002;109:1599–1605. doi: 10.1172/JCI15258. [DOI] [PMC free article] [PubMed] [Google Scholar]
- Oh JH, Ha H, Yu MR, Lee HB. Sequential effects of high glucose on mesangial cell transforming growth factor-beta 1 and fibronectin synthesis. Kidney Int. 1998;54:1872–1878. doi: 10.1046/j.1523-1755.1998.00193.x. [DOI] [PubMed] [Google Scholar]
- Paterson AJ, Kudlow JE. Regulation of glutamine:fructose-6-phosphate amidotransferase gene transcription by epidermal growth factor and glucose. Endocrinology. 1995;136:2809–2816. doi: 10.1210/endo.136.7.7789306. [DOI] [PubMed] [Google Scholar]
- Patti ME, Virkamaki A, Landaker EJ, Kahn CR, Yki-Jarvinen H. Activation of the hexosamine pathway by glucosamine in vivo induces insulin resistance of early post-receptor insulin signaling events in skeletal muscle. Diabetes. 1999;48:1562–1571. doi: 10.2337/diabetes.48.8.1562. [DOI] [PubMed] [Google Scholar]
- Phillips CA, Molitch ME. The relationship between glucose control and the development and progression of diabetic nephropathy. Curr Diab Rep. 2002;2:523–529. doi: 10.1007/s11892-002-0123-1. [DOI] [PubMed] [Google Scholar]
- Simmons ST, Daniels MC, Huddleston E, Hebert LF, Jr, McClain DA, Crook ED. Insulin stimulation of glutamine: fructose-6-phosphate amidotransferase occurs via an insulin-like growth factor-1 pathway in rat fibroblasts. Res Commun Mol Pathol Pharmacol. 1999;104:63–72. [PubMed] [Google Scholar]
- Stull MA, Rowzee AM, Loladze AV, Wood TL. Growth factor regulation of cell cycle progression in mammary epithelial cells. J Mammary Gland Biol Neoplasia. 2004;9:15–26. doi: 10.1023/B:JOMG.0000023585.95430.f4. [DOI] [PubMed] [Google Scholar]
- Tang J, Neidigh JL, Cooksey RC, McClain DA. Transgenic mice with increased hexosamine flux specifically targeted to beta-cells exhibit hyperinsulinemia and peripheral insulin resistance. Diabetes. 2000;49:1492–1499. doi: 10.2337/diabetes.49.9.1492. [DOI] [PubMed] [Google Scholar]
- Traxinger RR, Marshall S. Coordinated regulation of glutamine:fructose-6-phosphate amidotransferase activity by insulin, glucose, and glutamine: role of hexosamine biosynthesis in enzyme regulation. J Biol Chem. 1991;266:10148–10154. [PubMed] [Google Scholar]
- van Det NF, van den Born J, Tamsma JT, Verhagen NA, Berden JH, Bruijn JA. Effects of high glucose on the production of heparan sulfate proteoglycan by mesangial and epithelial cells. Kidney Int. 1996;49:1079–1089. doi: 10.1038/ki.1996.157. [DOI] [PubMed] [Google Scholar]
- Wahab NA, Harper K, Mason RM. Expression of extracellular matrix molecules in human mesangial cells in response to prolonged hyperglycaemia. Biochem J. 1996;316 Part 3:985–992. doi: 10.1042/bj3160985. [DOI] [PMC free article] [PubMed] [Google Scholar]
- Wardle EN. Vascular permeability in diabetics and implications for therapy. Diabetes Res Clin Pract. 1994;23:135–139. doi: 10.1016/0168-8227(94)90096-5. [DOI] [PubMed] [Google Scholar]
- Wolf G, Sharma K, Chen Y, Ericksen M, Ziyadeh FN. High glucose-induced proliferation in mesangial cells is reversed by autocrine TGF-beta. Kidney Int. 1992;42:647–656. doi: 10.1038/ki.1992.330. [DOI] [PubMed] [Google Scholar]
- Wolf G. Cell cycle regulation in diabetic nephropathy. Kidney Int Suppl. 2000;77:S59–S66. doi: 10.1046/j.1523-1755.2000.07710.x. [DOI] [PubMed] [Google Scholar]
- Ye F, Maegawa H, Morino K, Kashiwagi A, Kikkawa R, Xie M, et al. A simple and sensitive method for glutamine: fructose-6-phosphate amidotransferase assay. J Biochem Biophys Methods. 2004;59:201–208. doi: 10.1016/j.jbbm.2003.02.001. [DOI] [PubMed] [Google Scholar]
- Yu L, Border WA, Anderson I, McCourt M, Huang Y, Noble NA. Combining TGF-b inhibition and angiotensin II blockade results in enhanced anti-fibrotic effect. Kidney Int. 2004;66:1774–1784. doi: 10.1111/j.1523-1755.2004.00901.x. [DOI] [PubMed] [Google Scholar]
- Zheng F, Fornoni A, Elliot SJ, Guan Y, Breyer MD, Striker LJ, et al. Upregulation of type I collagen by TGF-beta in mesangial cells is blocked by PPARgamma activation. Am J Physiol Renal Physiol. 2002;282:F639–F648. doi: 10.1152/ajprenal.00189.2001. [DOI] [PubMed] [Google Scholar]


