

Abstract
The 5-year survival rate for patients with Stage II colon cancer is approximately 75%. However, there is no clinical test available to identify the 25% of patients at high risk of recurrence. We have previously identified a 23-gene signature that predicts individual risk for recurrence. The present study tested this gene signature in an independent group of 123 Stage II patients, and the 23-gene signature was highly informative in identifying patients with distant recurrence in both univariate (hazard ratio [HR] 2.51) and multivariate analyses (HR, 2.40). The composition of this representative patient group also allowed us to refine the 23-gene signature to a 7-gene signature that exhibited a similar prognostic power in both univariate (HR, 2.77) and multivariate analyses (HR, 2.87). Furthermore, we developed this prognostic signature into a clinically feasible test with real-time quantitative PCR using standard fixed paraffin-embedded tumor tissues. When a 110-patient cohort was evaluated with the PCR assay, the 7-gene signature, demonstrated to be a strong prognostic factor in both univariate (HR, 6.89) and multivariate analyses (HR, 14.2). These results clearly show the prognostic value of the predefined gene signature for Stage II colon cancer patients. The ability to identify colon cancer patients with an unfavorable outcome may help patients at high risk for recurrence to seek more aggressive therapy.
There is clearly a pressing need to identify new prognostic factors to determine Stage II colon cancer patients who are likely to relapse, to help guide their treatments.1,2,3,4,5,6,7,8,9,10,11 This information would allow better informed planning of treatments by identifying patients who are more likely to require and possibly benefit from adjuvant therapy.12,13,14,15,16 However, there is no clinical test available to provide such prognostic information. Using microarray analysis, we previously described discovery and initial validation of a 23-gene prognostic signature for Stage II colon cancer patients.17 Although our gene signature was validated using 36 independent patients, the patient samples in that study were based on a case-control selection with the sample composition of about half recurrence cases and half non-recurrence cases. The composition of the patient group may not represent a typical group of Stage II colon tumors. Therefore, the gene signature needs to be tested in a representative group of Stage II colon cancer patients to demonstrate its clinical assay performance.
The clinical applications of genomics in the diagnosis and management of cancer have been proposed.18,19,20,21,22,23 As more studies are published, there has been an increasing appreciation of the challenges facing the implementation of these gene signatures in clinical practices. The main threat to validity of such genomics-based discovery results comes from chance and bias. The problems may be avoided by using a totally independent validation group while holding everything else constant. Ransohoff24 and Simon et al25 have recently described the merit of elimination of bias and critical aspects of molecular marker evaluation. A common unambiguous requirement for broader acceptance of a molecular signature is the validation of the assay performance on a truly independent patient population. Our current study aims to test the 23-gene signature in a totally independent group of patients from multiple sources.
An additional limitation of a microarray-based assay is that the test requires fresh frozen tissue samples. As a result, the test cannot readily be applied to standard clinical material such as fixed paraffin-embedded (FPE) tissue samples. It has become very clear to us that the clinical application of the prognostic gene signature must use standard clinical material such as FPE tissue samples to open up the avenue to the clinical application of such prognostic tests.
In this study, we tested the gene signature in an independent group of Stage II patients. The 123 patients tested were obtained from two sources and selected based on the eligibility criteria that include all Stage II patients who did not receive adjuvant chemotherapy after surgery. The composition of this representative patient group allowed us to further refine the original 23-gene signature to a 7-gene signature (part of the 23-gene signature). Furthermore, we converted this prognostic assay from the microarray test on frozen tissues into a real-time quantitative (RTQ)-PCR assay on FPE tumor tissues. The results provide validation of the pre-specified prognostic gene signature for Stage II colon cancer patients and support further development of this prognostic gene signature into a clinically feasible diagnostic test.
Materials and Methods
Patient Samples
Frozen tumor specimens from 123 Stage II colon cancer patients were obtained from Cleveland Clinic Foundation (CCF; Cleveland, OH) and Aros Applied Biotechnology, LLC (Aarhus, Denmark) according to the Institutional Review Board-approved protocols at individual sites. The Cleveland Clinic samples were from 1980 to 2001 with a median follow-up time of 123 months (ranging from 35 to 270 months), and the Aros samples were from 1995 to 2001 with median follow-up time of 83 months (ranging from 61 to 93 months). The histopathology of each specimen was reviewed on the H&E-stained tissue section to confirm diagnosis and tumor content. Tumor content was estimated in percentage by counting nuclei of epithelial tumor cells. Patient eligibility criteria include colon primary Stage II adenocarcinoma; primary treatment of surgery only, without adjuvant or neoadjuvant therapy; at least 70% of tumor cells in the tissue sample; and at least 3 years of follow-up except for patients who developed distant relapse before that time.
FPE tumor specimens from 110 Stage II colon cancer patients were obtained from CCF and Proteogenex, LLC (Culver City, CA) according to the Institutional Review Board-approved protocols at individual sites. The Cleveland Clinic samples were from 1981 to 2001 with median follow-up time of 124 months (ranging from 35 to 270 months), and the Proteogenex samples were from 1993 to 2001 with median follow-up time of 59 months (ranging from 39 to 109 months). The histopathology of each specimen was reviewed to confirm diagnosis and tumor content. Patient eligibility criteria and follow-up procedures were the same as for the selection of the frozen samples.
Microarray Analysis
All frozen tumor tissues were processed for RNA isolation as described in our initial study.17 Biotinylated targets were prepared using published methods (Affymetrix, Santa Clara, CA)26 and hybridized to Affymetrix U133a GeneChips. Arrays were scanned using the standard Affymetrix protocol. Each probe set was considered a separate gene. Expression values for each gene were calculated using Affymetrix GeneChip analysis software MAS 5.0 and according to the analysis method described previously.17 All data used for subsequent analysis passed the quality control criteria.
RNA Isolation from FPE Samples
The FPE samples were either formalin-fixed (n = 45) or Hollandes-fixed (n = 65) FPE tissue. RNA isolation from FPE tissue samples was performed according to a modified protocol using a High Pure RNA Paraffin Kit (Roche Applied Sciences, Indianapolis, IN). FPE tissue blocks were sectioned depending on the size of the blocks (6 to 8 mm = 6 × 10 μm, ≥ 8 mm = 3 × 10 μm). Sections were deparaffinized as described in the manufacturer's manual. The tissue pellet was dried in an oven at 55°C for 10 minutes and resuspended in 100 μl of tissue lysis buffer, 16 μl of 10% SDS, and 80 μl of proteinase K. The sample was vortexed and incubated in a thermomixer set at 400 rpm for 3 hours at 55°C. Subsequent steps of sample processing were performed according to the Kit manual. The RNA sample was quantified by OD 260/280 readings using a spectrophotometer and diluted to a final concentration of 50 ng/μL. The isolated RNA samples were stored in RNase-free water at −80°C until use.
RTQ-PCR Analysis
The gene signature and the housekeeping control genes were evaluated using a one-step multiplex RTQ-PCR assay with the RNA samples isolated from FPE tissues. To minimize the variability of RTQ-PCR, three housekeeping control genes including β-actin, hydroxymethylbilane synthase, and ribosomal protein L13 A were used to normalize the input quantity of RNA. To prevent any contaminating DNA in the samples from amplification, PCR primers or probes for RTQ-PCR assay were designed to span an intron so that the assay would not amplify any residual genomic DNA. One hundred ng of total RNA was used for the one-step RTQ-PCR. PCR amplification was performed on the ABI 7900HT sequence detection system (Applied Biosystems, Fresno, CA) using the 384-well block format with 10-μl reaction volume. The concentrations of the primers and the probes were 4 and 2.5 μmol/L, respectively. The reaction mixture was incubated at 48°C for 30 minutes for the reverse transcription, followed by an Amplitaq (Applied Biosystems) activation step at 95°C for 10 minutes and then 40 cycles of 95°C for 15 seconds for denaturing and 60°C for 1 minute for annealing and extension. A standard curve was generated from a range of 100 pg to 100 ng of the starting materials, and when the R2 value was >0.99, the cycle threshold (Ct) values were accepted. In addition, all primers and probes were optimized toward the same amplification efficiency according to the manufacturer's protocol. Sequences of the primers and probes for the seven genes and the three housekeeping control genes are listed in Table 1, each written in the 5′ to 3′ direction.
Table 1.
Primer and Probe Sequences for the Seven Genes and Control Genes
| Gene symbol | Forward primer | Probe | Reverse primer |
|---|---|---|---|
| EP2MA | 5′-CATTATTCAAGGCCGAGTACAGATG-3′ | 5′-CAGGCGGTGTGCCTGCTGCAT-3′ | 5′-CACGTACACGATGTGTCCCTTCT-3′ |
| KLF5 | 5′-CCTGAGGACTCACACTGGTGAA-3′ | 5′-CAAGTGTACCTGGGAAGGCTGCGACTG-3′ | 5′-CAGCTCATCCGATCGCG-3′ |
| CAPG | 5′-CGCAGCTCTGTATAAGGTCTCTGA-3′ | 5′-AACCTGACCAAGGTGGCTGACTCCAG-3′ | 5′-GATATCAGCAGTTCAAGGGCAA-3′ |
| LILRB3 | 5′-AGATGGACACTGAGGCTGCTG-3′ | 5′-CCCAGGATGTGACCTACGCCCAG-3′ | 5′-CTTCCGTCTAAGGGTCAAGCTG-3′ |
| LAT | 5′-CTCCCACCGGACGCCATC-3′ | 5′-CGGGATTCTGATGGTGCCAACAGT-3′ | 5′-CCTCGTTCTCGTAGCTCGCCA-3′ |
| CHC1 | 5′-TTTGTGGTGCCTATTTCACCTTT-3′ | 5′-CCACGTGTACGGCTTCGGCCTC-3′ | 5′-CGGAGTTCCAAGCTGATGGTA-3′ |
| YWHAH | 5′-CCTGTCTCTTGGGAAGCAGTTT-3′ | 5′-ATCATGGGCATTGCTGGACTGATGG-3′ | 5′-GCTCCTGTGGGCTCAAAG-3′ |
| β-Actin | 5′-CCTGGCACCCAGCACAAT-3′ | 5′-ATCAAGATCATTGCTCCTCCTGAGCGC-3′ | 5′-GCCGATCCACACGGAGTACTT-3′ |
| HMBS | 5′-CCACACACAGCCTACTTTCCAA-3′ | 5′-AACGGCAATGCGGCTGCAACGGCGGAA-3′ | 5′-TACCCACGCGCAATCACTCTCA-3′ |
| RPL13A | 5′-GAAGCCTACAAGAAAGTTTGCCTATC-3′ | 5′-CTGGCTCACGAGGTTGGCTGGAA-3′ | 5′-AGGGTGGCTGTCACTGCC-3′ |
Each probe has 5′ 5-carboxyfluorescein label and a 3′ BHQ label.
For each sample, ΔCt = Ct (target gene) − Ct (average of three control genes) was calculated. ΔCt normalization has been widely used in clinical RTQ-PCR assay.
Statistical Methods
In our previous study,17 we used gene expression profiles of 74 Stage II colon tumors to identify the 23-gene prognostic signature. Briefly, the patients were first placed into one of the two subgroups based on the expression of cadherin 17 (detectable versus undetectable on the Affymetrix chip). Each patient subgroup was then analyzed separately to select markers. The markers selected from each subgroup were combined to form a single signature to predict tumor recurrence for all patients as a whole. Univariate Cox proportional hazards regression was used to identify genes whose expression levels were correlated to patient disease-free time. In addition, a t-test with resampling was used to select genes that gave the best classification between the relapse and the disease-free patients. Genes found by both Cox model and t-test were selected to build a signature for predicting outcome. Relapse Hazard Score was used to determine each patient's risk of recurrence. The score was defined as the linear combination of weighted expression with the standardized Cox regression coefficient as the weight. In the case that the markers were from the patient subgroups, normalization to a target score of 100 was used to create the final score for each patient. Patients whose scores were equal to or greater than 100 were classified in the high risk of relapse group, whereas patients whose scores were less than 100 were predicted as the low risk of relapse group.
where
A and B are constants
wi is the standardized Cox regression coefficient
xi is the expression value in log2 sacle
For microrray data analysis in the present study, cadherin 17 gene expression measurement on the array was used to determine the assignment of the patient to the subgroups as described in our previous study.17 Patients with detectable cadherin 17 were classified as subgroup I; the outcomes were predicted using the 7-gene subset of the 23-gene signature. Patients with undetectable cadherin 17 were classified as subgroup II; the outcomes were predicted using the 15-gene subset of the 23-gene signature. The relapse score was calculated for each patient and used to classify the patient into high or low risk groups for developing distant metastasis in 3 years. Patients with a relapse score >100 were classified as high risk and patients with a relapse score <100 were called low risk. The composition of the subgroup I and subgroup II patients was determined in the representative group of Stage II patients to modify the gene signature and the algorithm for relapse score.
For RTQ-PCR data analysis, the difference between the average Ct of the three housekeeping control genes and the Ct of each of the genes in the prognostic signature was used to calculate the relapse score using the same algorithm. The relapse score was calculated for each patient and used to classify the patient into high or low risk groups for developing distant metastasis in 3 years. Patients with a relapse score >0 were classified as high risk and patients with a relapse score <0 were called low risk. The calculation of the relapse score was as follows:
where
A is constant
wi is the standardized Cox regression coefficient
xi is the difference between average Ct of the house-keeping genes and the Ct of the target gene
Kaplan-Meier survival plots27 and log-rank tests stratified by clinical site were used to assess the difference of the predicted high and low risk groups. Sensitivity was defined as the percentage of the patients with distant recurrence in 3 years that were predicted correctly by the gene signature, and specificity was defined as the percentage of the patients free of distant recurrence for at least 3 years that were predicted as being free of recurrence by the gene signature. Univariate and multivariate analyses using the Cox proportional hazard regression stratified by clinical site were performed on the individual clinical parameters of the patients and the combination of the clinical parameters and the gene signature including age, gender, T stage, grade, and tumor size. The hazard ratio (HR) and its 95% confidence interval (CI) were derived from these results. All statistical analyses were performed using S-Plus 6.1 software (Insightful, Fairfax Station, VA).
Results
Patient and Tumor Characteristics
Clinical and pathological features of the patients and their tumors are summarized in Tables 2and 3. All patients had information on age, gender, TNM stage, number of lymph nodes examined, grade, and tumor location. The rectal cancer patient was excluded. TNM staging was performed according to the American Joint Committee on Cancer Staging Manual, sixth edition. Histological grade or differentiation status was reported by each clinical site. CCF and Proteogenex reported this information as well, moderately, or poorly differentiated, whereas Aros reported as high, medium, or low grade. The number of lymph nodes examined varied among the sites because the samples came from the archived collections at different time periods. The patients were treated by surgery only and none of the patients received neoadjuvant or adjuvant treatment. A minimum of 3 years of follow-up data were available for all of the patients in the study with the exception of those with relapse in less than 3 years. The statistical analysis suggested that the majority of the tumor characteristics did not differ significantly between the relapse and the non-relapse patients. Tumor location for the Aros fresh frozen samples showed significant difference between the relapse and the non-relapse patients (P value of 0.03), but the combined fresh frozen sample set (Aros and CCF) did not present significant difference (P value of 0.11). For the FPE clinical samples, tumor stage was significantly different between the relapse and the non-relapse patients (P value of 0.03), but the individual site did not differ significantly (P value of 0.14 for Proteogenex and P value of 0.73 for CCF). The differences observed may be due to the site-to-site variation and the sample size in the study.
Table 2.
Patient and Tumor Characteristics (Frozen Tumor Tissues)
| Aros |
CCF |
Aros + CCF |
|||||||
|---|---|---|---|---|---|---|---|---|---|
| Factor | NR | R | P value | NR | R | P value | NR | R | P value |
| Age (yr) | 69 | 63 | 0.1 | 69 | 78 | 0.1 | 69 | 67 | 0.51 |
| Range | (49 to 84) | (36 to 83) | (31 to 92) | (73 to 88) | (31 to 92) | (36 to 88) | |||
| Sex | |||||||||
| Male | 16 | 10 | 0.09 | 36 | 1 | 0.35 | 52 | 11 | 0.51 |
| Female | 20 | 3 | 33 | 4 | 53 | 7 | |||
| T stage | |||||||||
| T3 | 31 | 11 | 0.74 | 61 | 3 | 0.26 | 92 | 14 | 0.45 |
| T4 | 5 | 2 | 8 | 2 | 13 | 4 | |||
| No. of LN examined | |||||||||
| <6 | 15 | 5 | 0.84 | 4 | 0 | 0.84 | 19 | 5 | 0.21 |
| 6 to 12 | 15 | 6 | 15 | 1 | 30 | 7 | |||
| >12 | 5 | 1 | 49 | 4 | 54 | 5 | |||
| Unknown | 1 | 1 | 1 | 0 | 2 | 1 | |||
| Tumor location | |||||||||
| Cecum | 0 | 0 | 0.03 | 18 | 0 | 0.43 | 18 | 0 | 0.11 |
| Ascending | 14 | 2 | 14 | 0 | 28 | 2 | |||
| Hepatic flexure | 0 | 0 | 6 | 1 | 6 | 1 | |||
| Transverse | 5 | 0 | 6 | 1 | 11 | 1 | |||
| Splenic flexure | 1 | 3 | 5 | 0 | 6 | 3 | |||
| Descending | 0 | 0 | 2 | 0 | 2 | 0 | |||
| Sigmoid | 16 | 8 | 18 | 3 | 34 | 11 | |||
| Metastasis site | |||||||||
| Liver | 0 | 4 | NA | 0 | 3 | NA | 0 | 7 | NA |
| Lung | 0 | 2 | 0 | 1 | 0 | 3 | |||
| Other | 0 | 5 | 0 | 1 | 0 | 6 | |||
| Multiple* | 0 | 2 | 0 | 0 | 0 | 2 | |||
| Grade | |||||||||
| Low | 7 | 2 | 0.53 | 4 | 2 | 0.02 | 11 | 4 | 0.34 |
| Medium | 22 | 10 | 54 | 2 | 76 | 12 | |||
| High | 7 | 1 | 11 | 1 | 18 | 2 | |||
NR, non-relapse; R, relapse; LN, lymph nodes.
Multiple metastasis sites include 1 patient to both liver and lung, and 1 patient to both lung and other sites.
Table 3.
Patient and Tumor Characteristics (FPE Tissues)
| Proteogenex |
CCF |
Proteogenex + CCF |
|||||||
|---|---|---|---|---|---|---|---|---|---|
| Factor | NR | R | P value | NR | R | P value | NR | R | P value |
| Age (yr) | 66 | 64 | 0.26 | 71 | 71 | 0.97 | 69 | 66 | 0.24 |
| Range | (43 to 83) | (40 to 90) | (46 to 86) | (51 to 88) | (43 to 86) | (40 to 90) | |||
| Sex | |||||||||
| Male | 6 | 7 | 0.22 | 31 | 2 | 0.2 | 37 | 9 | 0.8 |
| Female | 20 | 8 | 29 | 7 | 49 | 15 | |||
| T stage | |||||||||
| T2 | 0 | 2 | 0.14 | 0 | 0 | 0.73 | 0 | 2 | 0.03 |
| T3 | 20 | 11 | 53 | 7 | 73 | 18 | |||
| T4 | 6 | 2 | 7 | 2 | 13 | 4 | |||
| No. of LN examined | |||||||||
| <6 | NA | NA | NA | 1 | 1 | 0.23 | 1 | 1 | 0.23 |
| 6 to 12 | NA | NA | 14 | 1 | 14 | 1 | |||
| >12 | NA | NA | 44 | 7 | 44 | 7 | |||
| Unknown | 26 | 15 | 1 | 0 | 27 | 15 | |||
| Tumor location | |||||||||
| Cecum | 3 | 3 | 0.14 | 17 | 0 | 0.35 | 20 | 3 | 0.15 |
| Ascending | 10 | 2 | 9 | 1 | 19 | 3 | |||
| Hepatic flexure | 0 | 0 | 7 | 1 | 7 | 1 | |||
| Transverse | 4 | 1 | 5 | 2 | 9 | 3 | |||
| Splenic flexure | 1 | 3 | 5 | 0 | 6 | 3 | |||
| Descending | 0 | 0 | 2 | 0 | 2 | 0 | |||
| Sigmoid | 16 | 8 | 18 | 3 | 34 | 11 | |||
| Metastasis site | |||||||||
| Liver | 0 | 10 | NA | 0 | 5 | NA | 0 | 15 | NA |
| Lung | 0 | 3 | 0 | 0 | 0 | 3 | |||
| Other | 0 | 1 | 0 | 4 | 0 | 5 | |||
| Multiple* | 0 | 1 | 0 | 0 | 0 | 1 | |||
| Grade | |||||||||
| Low | 3 | 1 | 0.55 | 4 | 2 | 0.25 | 7 | 3 | 0.74 |
| Medium | 15 | 11 | 46 | 5 | 61 | 16 | |||
| High | 4 | 1 | 10 | 2 | 14 | 3 | |||
| Unknown | 4 | 2 | 0 | 0 | 4 | 2 | |||
NR, non-relapse; R, relapse; NA, not applicable.
Multiple metastasis sites include 1 patient to both liver and lung.
Analysis of the Gene Signature in the Fresh Frozen Samples
In the patient sample group of our initial study,17 we detected two subgroups of tumors representing well and poorly differentiated tumors, respectively. Cadherin 17 gene expression (detectable or undetectable on the Affymetrix chip) was used to stratify the Stage II tumors into the two subgroups, and the prognostic gene signature was designed to include classifiers for subgroup I (7 genes) and subgroup II (15 genes). However, because of the control-case design of the study, we could not determine the composition of subgroup I and subgroup II patients for a typical makeup of the Stage II tumors. In the present study, we first examined this question and found that subgroup II (undetectable cadherin 17) only accounted for 2 of the 123 Stage II tumors (1.6%). Therefore, the prognostic gene signature was refined by removing the 15 genes for subgroup II and only keeping the 7 genes for subgroup I in the prognostic algorithm. The 7 genes are listed as follows, with GenBank ID and Affymetrix U133a chip ID: LILRB3 (NM_006864, 211133_x_at), YWHAH (NM_003405, 201020_at), CHC1 (NM_001269, 215747_ s_at), KLF5 (NM_001730, 209212_s_at), CAPG (NM_ 001747, 201850_at), LAT (NM_014387, 211005_at), and EPM2A (NM_005670, 210870_s_at).
Next, we performed the prediction of patient outcome using the 7-gene signature and compared the results to that of the original 23-gene signature using the microarray data. In the independent set of 123 patients, the 23-gene signature proved to be highly informative in identifying patients with distant recurrence, as shown in the receiver operating characteristic (ROC) curve evaluation (Figure 1A) The univariate analyses of the 123 patients using the original 23-gene signature produced a highly consistent outcome in identifying patients who would develop distant recurrence (HR, 2.51; 95% CI, 0.99 to 6.37) (Figure 1B). The Kaplan-Meier analysis produced survival curves for the patient groups, and the log rank test showed a significant difference in the time to recurrence between the group predicted with good prognosis and the group predicted with poor prognosis (P = 0.045) (Figure 1B). Survival analysis was then performed as a function of the 7-gene signature. First, the ROC curve was evaluated (Figure 1C). The area under the curve was used to assess the performance of a predictor. The 7-gene predictor gave an area under the curve value of 0.66. Using the 3-year defining point, the relapse score calculated from this method correctly predicted 8 of the 13 relapses (8 relapses categorized correctly, whereas 5 relapses were grouped in the non-relapse category, 62% sensitivity) that occurred within 3 years and 74 of the 108 non-relapsers (74 non-relapses categorized correctly, whereas 34 non-relapses were grouped in the relapse category, 69% specificity). Although the frequency of tumor relapse in 3 years was 11% in this group of 123 patients, the Kaplan-Meier analysis produced survival curves for the patient groups and the log rank test showed a significant difference in the time to recurrence between the group predicted with good prognosis and the group predicted with poor prognosis (P = 0.025) (Figure 1D). In the univariate and multivariate analyses of the 123 patients, the 7-gene signature proved to be highly informative in identifying patients who would develop distant recurrence (HR, 2.77; 95%; CI, 1.09 to 7.03), even when corrected for the traditional prognostic factors in multivariate analysis (HR, 2.87; 95% CI, 1.04 to 7.92) (Table 4). The 7-gene signature was used for the subsequent RTQ-PCR assay. The microarray data set has been submitted to the NCBI/GenBank GEO database (series entry pending).
Figure 1.
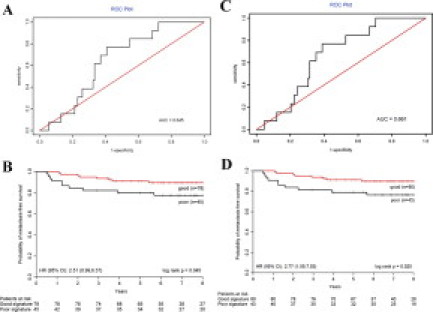
ROC and Kaplan-Meier survival analysis of the prognostic signatures on 123 independent patients. A: The ROC curve of the 23-gene signature. B: Kaplan-Meier curve and log rank test of 123 frozen tumor samples using the 23-gene signature. The risk of recurrence for each patient was assessed based on the gene signature and the threshold was determined by the previous study.17 The high and low risk groups differ significantly (P = 0.045). C: The ROC curve of the 7-gene signature. D: Kaplan-Meier curve and log rank test of 123 frozen tumor samples using the 7-gene signature. The risk of recurrence for each patient was assessed based on the gene signature and the threshold was determined by the training set. The high and low risk groups differ significantly (P = 0.025).
Table 4.
Uni- and Multivariate Analysis for Distant Recurrence (Frozen Tumor Tissues)
| Univariate analysis |
Multivariate analysis* |
|||||
|---|---|---|---|---|---|---|
| HR | (95% CI) | P value | HR | (95% CI) | P value | |
| Age | 0.99 | (0.95 to 1.03) | 0.6227 | 0.99 | (0.95 to 1.03) | 0.6980 |
| Sex† | 1.59 | (0.62 to 4.10) | 0.3386 | 1.46 | (0.52 to 4.11) | 0.4697 |
| T stage‡ | 1.83 | (0.60 to 5.58) | 0.2846 | 3.11 | (0.88 to 11.0) | 0.0786 |
| Grade§ | 1.62 | (0.37 to 7.02) | 0.5222 | 1.72 | (0.35 to 8.44) | 0.5041 |
| 7-Gene signature | 2.77 | (1.09 to 7.03) | 0.0324 | 2.87 | (1.04 to 7.92) | 0.0414 |
The multivariate model include 123 patients.
Male versus female.
T4 versus T3.
Low & medium versus high.
Analysis of the Gene Signature in the FPE Samples
To demonstrate the value of the prognostic gene signature in clinically relevant samples, the RTQ-PCR assay was performed using the 7-gene signature on 110 FPE samples from Stage II colon tumors. A Relapse Hazard Score was calculated as follows: RHS = −3.251 × ΔCt(LILRB3) − 3.156 × ΔCt(YWHAH) − 3.035 × ΔCt(CHC1) + 3.002 × ΔCt(KLF5) − 2.842 × ΔCt(CAPG) − 3.249 × ΔCt(LAT) − 2.835 × ΔCt(EPM2A). Survival analysis was performed. First, the ROC curve was evaluated (Figure 2A). The 7-gene predictor gave an area under the curve value of 0.76. Using the 3-year defining point, the relapse score calculated from this method correctly predicted 11 of the 17 relapses (11 relapses categorized correctly, whereas 6 relapses were grouped in the non-relapse category, 65% sensitivity) that occurred within 3 years and 78 of the 92 non-relapses (78 non-relapses categorized correctly, whereas 14 non-relapses were grouped in the relapse category, 85% specificity). Furthermore, the Kaplan-Meier analysis and the log rank test both showed a significant difference in the time to recurrence between the group predicted with good prognosis and the group predicted with poor prognosis (P < 0.0001) (Figure 2B). In the 110 patients, the 7-gene signature was confirmed as a strong prognostic factor for the development of distant recurrence, and in both univariate (HR, 6.89; 95% CI, 2.93 to 16.2) and multivariate analyses (HR, 14.2; 95% CI, 5.02 to 40.3) (Table 5).
Figure 2.
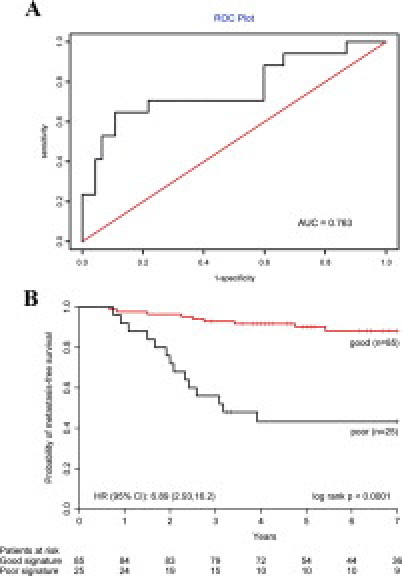
ROC and Kaplan-Meier survival analysis of the prognostic signatures on 110 independent patients. A: The ROC curve of the 7-gene signature. B: Kaplan-Meier curve and log rank test of 110 FPE tumor samples using the 7-gene signature. The risk of recurrence for each patient was assessed based on the gene signature and the threshold was determined by the training set. The high and low risk groups differ significantly (P < 0.0001).
Table 5.
Uni- and Multivariate Analysis for Distant Recurrence (FPE Tissues)
| Univariate analysis |
Multivariate analysis* |
|||||
|---|---|---|---|---|---|---|
| HR | (95% CI) | P value | HR | (95% CI) | P value | |
| Age | 0.99 | (0.96–1.03) | 0.6636 | 0.99 | (0.95–1.03) | 0.6405 |
| Sex† | 1.18 | (0.50–2.77) | 0.7084 | 1.29 | (0.48–3.43) | 0.6108 |
| T Stage‡ | 1.06 | (0.36–3.13) | 0.9156 | 1.48 | (0.48–4.58) | 0.4997 |
| Grade§ | 1.11 | (0.33–3.77) | 0.8666 | 0.53 | (0.14–1.99) | 0.3436 |
| 7-Gene signature | 6.89 | (2.93–16.2) | 9.9E-06 | 14.23 | (5.02–40.3) | 5.7E-07 |
The multivariate model include 104 patients, due to missing values in 6 patients.
Male versus female.
T4 versus T3 & T2.
Low & medium versus high.
Discussion
We provide the results of an independent validation study on the prognostic gene for Stage II colon cancer. In addition, the test results of 123 Stage II colon cancer patients allow us to refine the gene signature and the prognostic algorithm from the 23-gene panel to a simplified 7-gene panel. Furthermore, we report the successful development of an RTQ-PCR assay on FPE samples. This study brings us a step closer to the clinical application of such a molecular prognostic test for colon cancer patients. The relapse hazard risk score provided by this test has the potential to have an impact on current clinical practice by highlighting the efficacy of current treatment regimens for Stage II colon cancer patients with high risk of tumor recurrence.
We believe that testing the gene signature in a representative patient group is a critical step for clinical application. The study not only serves as an independent confirmation of the gene signature but also demonstrates the validity and the clinical relevancy of the prognostic gene signature. For example, in the patient group of our initial study, two subgroups of tumors were detected. Because of the control-case study, we could not determine the typical makeup of the Stage II tumors. In the present study, we examined an independent group of representative Stage II patients, which allowed us to refine the prognostic algorithm.
We observed that the percentage of Stage II colon cancer patients that develops recurrence varies from institution to institution. This difference could be due to tumor-related variables as well as patient care procedures at each institution. Given these variations, we chose to use a consecutive series of the eligible patients at each institution to minimize the bias. In our patient samples, the 5-year recurrence rate is higher than the 3-year recurrence rate, but not significantly different. The gene signature performed consistently when predicting 3-year and 5-year recurrence. For FPE samples, the sensitivity was 64% versus 65%, and the specificity was 86% versus 85% between the 5-year and the 3-year analyses. For fresh frozen samples, the sensitivity was 56% versus 62%, and the specificity was 67% versus 69% between the 5-year and the 3-year analyses.
Studies that are aimed at developing molecular gene signatures must be rigorously validated and cannot be considered for clinical application until the results are properly confirmed with regard to methodological, statistical, and clinical aspects. In this respect, several criticisms have been raised concerning published gene expression profiling studies on issues relating to the omission of independent validation sets, the sizes of training and testing sets, or possible confounding effects of treatment to the patient population studied.24,25 Our present study just aims to take consideration of these concerns in the field, and uses a totally independent group of patients from two sources for the validation of a pre-specified prognostic profile for Stage II colon cancer patients. The strength of the study relied on the diverse groups of patients and the use of the standard clinical FPE materials. The successful conversion from the chip assay on a fresh frozen sample to the RTQ-PCR assay on an FPE sample is an important step forward. Not only has the platform changed, but also the sample type. It is well known that RNA and DNA extracted from paraffin-embedded tissue blocks are of poor quality, degraded, and cross-linked to various degrees compared with these from fresh frozen tissues.28,29 Demonstration of the prognostic value of the 7-gene signature from the RTQ-PCR assay on an FPE sample further strengthened the biological relevance of the 7 genes in Stage II colon cancer. A recent study has shown that EPM2A is a potential tumor suppressor, and its inactivation resulted in increased Wnt signaling and tumorigenesis.30 The tumor specimens were collected and stored according to institutional protocols, and the RNA samples were prepared using easily applicable procedures. Despite the differences in tissue handling at different institutions, the gene signature proved to be robust and produced results that were consistent with our initial analysis. In addition, the 23-gene prognostic signature was successfully validated by an independent group.31
Whether postoperative adjuvant chemotherapy will benefit Stage II colon cancer patients still remains an open question since 75% of the Stage II patients are cured by surgery alone. The administration of adjuvant therapy to all Stage II patients will only be helpful for a few. The rational approach would be to identify the population with high risk of recurrence by considering all clinical risk factors, including genetic and/or molecular risk factors. Molecular tests assessing recurrence risk and assisting treatment decision making for breast cancer patients have been proven informative clinically.32,33 The proven reproducibility of the 7-gene signature and the development of the RTQ-PCR assay on FPE samples indicate that the prognostic gene signature can be recommended for future clinical studies that aim to assess the benefit of adjuvant therapy for Stage II patients and potentially be put into clinical practice in the near future. As approximately 25% of Stage II colon cancer patients relapse, the prognostic signature will provide a unique tool in combination with conventional clinical parameters to select patients at high risk for relapse and recommend possible additional adjuvant treatment.34,35,36,37 This ability to identify the patients who need intensive clinical intervention may lead to an improvement in patient survival.
Footnotes
Financial Disclosure: Y.J., Y.Z., D.T., A.M., D.A., and Y.W. are employed by Veridex, LLC, a Johnson & Johnson Company, which is in the business of commercializing diagnostic products. The other authors declare no conflict of interest.
References
- 1.Compton CC, Fielding LP, Burgart LJ, Conley B, Cooper HS, Hamilton SR, Hammond ME, Henson DE, Hutter RV, Nagle RB, Nielsen ML, Sargent DJ, Taylor CR, Welton M, Willett C. Prognostic factors in colorectal cancer. College of American Pathologists Consensus Statement 1999. Arch Pathol Lab Med. 2000;124:979–994. doi: 10.5858/2000-124-0979-PFICC. [DOI] [PubMed] [Google Scholar]
- 2.Ratto C, Sofo L, Ippoliti M, Merico M, Doglietto GB, Crucitti F. Prognostic factors in colorectal cancer. Literature review for clinical application. Dis Colon Rectum. 1998;41:1033–1049. doi: 10.1007/BF02237397. [DOI] [PubMed] [Google Scholar]
- 3.Watanabe T, Wu TT, Catalano PJ, Ueki T, Satriano R, Haller DG, Benson AB, Hamilton SR. Molecular predictors of survival after adjuvant chemotherapy for colon cancer. N Engl J Med. 2001;344:1196–1206. doi: 10.1056/NEJM200104193441603. [DOI] [PMC free article] [PubMed] [Google Scholar]
- 4.Noura S, Yamamoto H, Ohnishi T, Masuda N, Matsumoto T, Takayama O, Fukunaga H, Miyake Y, Ikenaga M, Ikeda M, Sekimoto M, Matsuura N, Monden M. Comparative detection of lymph node micrometastases of stage II colorectal cancer by reverse transcriptase polymerase chain reaction and immunohistochemistry. J Clin Oncol. 2002;20:4232–4241. doi: 10.1200/JCO.2002.10.023. [DOI] [PubMed] [Google Scholar]
- 5.Halling KC, French AJ, McDonnell SK, Burgart LJ, Schaid DJ, Peterson BJ, Moon-Tasson L, Mahoney MR, Sargent DJ, O'Connell MJ, Witzig TE, Farr GH, Goldberg RM, Thibodeau SN. Microsatellite instability and 8p allelic imbalance in stage B2 and C colorectal cancers. J Natl Cancer Inst. 1999;91:1295–1303. doi: 10.1093/jnci/91.15.1295. [DOI] [PubMed] [Google Scholar]
- 6.Martinez-Lopez E, Abad A, Font A, Monzó M, Ojanguren I, Pifarré A, Sánchez JJ, Martín C, Rosell R. Allelic loss on chromosome 18q as a prognostic marker in stage II colorectal cancer. Gastroenterology. 1998;114:1180–1187. doi: 10.1016/s0016-5085(98)70423-8. [DOI] [PubMed] [Google Scholar]
- 7.Zhou W, Goodman SN, Galizia G, Lieto E, Ferraraccio F, Pignatelli C, Purdie CA, Piris J, Morris R, Harrison DJ, Paty PB, Culliford A, Romans KE, Montgomery EA, Choti MA, Kinzler KW, Vogelstein B. Counting alleles to predict recurrence of early-stage colorectal cancers. Lancet. 2002;359:219–225. doi: 10.1016/S0140-6736(02)07448-2. [DOI] [PubMed] [Google Scholar]
- 8.Ogunbiyi OA, Goodfellow PJ, Herfarth K, Gagliardi G, Swanson PE, Birnbaum EH, Read TE, Fleshman JW, Kodner IJ, Moley JF. Confirmation that chromosome 18q allelic loss in colon cancer is a prognostic indicator. J Clin Oncol. 1998;16:427–433. doi: 10.1200/JCO.1998.16.2.427. [DOI] [PubMed] [Google Scholar]
- 9.Shibata D, Reale MA, Lavin P, Silverman M, Fearon ER, Steele G, Jessup JM, Loda M, Summerhayes IC. The DCC protein and prognosis in colorectal cancer. N Engl J Med. 1996;335:1727–1732. doi: 10.1056/NEJM199612053352303. [DOI] [PubMed] [Google Scholar]
- 10.Sun XF, Rutten S, Zhang H, Nordenskjöld B. Expression of the deleted in colorectal cancer gene is related to prognosis in DNA diploid and low proliferative colorectal adenocarcinoma. J Clin Oncol. 1999;17:1745–1750. doi: 10.1200/JCO.1999.17.6.1745. [DOI] [PubMed] [Google Scholar]
- 11.McLeod HL, Murray GI. Tumor markers of prognosis in colorectal cancer. Br J Cancer. 1999;79:191–203. doi: 10.1038/sj.bjc.6690033. [DOI] [PMC free article] [PubMed] [Google Scholar]
- 12.Johnston PG. Stage II colorectal cancer: to treat or not to treat. Oncologist. 2005;10:332–334. doi: 10.1634/theoncologist.10-5-332. [DOI] [PubMed] [Google Scholar]
- 13.Saltz LB, Kelsen DP. Adjuvant treatment of colorectal cancer. Annu Rev Med. 1997;48:191–202. doi: 10.1146/annurev.med.48.1.191. [DOI] [PubMed] [Google Scholar]
- 14.Wolmark N, Rockette H, Mamounas E, Jones J, Wieand S, Wickerham DL, Bear HD, Atkins JN, Dimitrov NV, Glass AG, Fisher ER, Fisher B. Clinical trial to assess the relative efficacy of fluorouracil and leucovorin, fluorouracil and levamisole, and fluorouracil, leucovorin, and levamisole in patients with Dukes' B and C carcinoma of the colon: results from National Surgical Adjuvant Breast and Bowel Project C-04. J Clin Oncol. 1999;17:3553–3559. doi: 10.1200/JCO.1999.17.11.3553. [DOI] [PubMed] [Google Scholar]
- 15.International Multicenter Pooled Analysis of B2 Colon Cancer Trials (IMPACT B2) Investigators Efficacy of adjuvant fluorouracil and folinic acid in B2 colon cancer. J Clin Oncol. 1999;17:1356–1363. [PubMed] [Google Scholar]
- 16.Mamounas E, Wieand S, Wolmark N, Bear HD, Atkins JN, Song K, Jones J, Rockette H. Comparative efficacy of adjuvant chemotherapy in patients with Dukes' B versus Dukes' C colon cancer: results from four National Surgical Adjuvant Breast and Bowel Project adjuvant studies (C-01, C-02, C-03, and C-04) J Clin Oncol. 1999;17:1349–1355. doi: 10.1200/JCO.1999.17.5.1349. [DOI] [PubMed] [Google Scholar]
- 17.Wang Y, Jatkoe T, Zhang Y, Mutch MG, Talantov D, Jiang J, McLeod HL, Atkins D. Gene expression profiles and molecular markers to predict recurrence of Dukes' B colon cancer. J Clin Oncol. 2004;22:1564–1571. doi: 10.1200/JCO.2004.08.186. [DOI] [PubMed] [Google Scholar]
- 18.Van't Veer LJ, Dai H, van de Vijver MJ, He YD, Hart AA, Mao M, Peterse HL, van der Kooy K, Marton MJ, Witteveen AT, Schreiber GJ, Kerkhoven RM, Roberts C, Linsley PS, Bernards R, Friend SH. Gene expression profiling predicts clinical outcome of breast cancer. Nature. 2002;415:530–536. doi: 10.1038/415530a. [DOI] [PubMed] [Google Scholar]
- 19.Van de Vijver MJ, Yudong DH, Van't Veer LJ, Dai H, Hart AA, Voskuil DW, Schreiber GJ, Peterse JL, Roberts C, Marton MJ, Parrish M, Atsma D, Witteveen A, Glas A, Delahaye L, van der Velde T, Bartelink H, Rodenhuis S, Rutgers ET, Friend SH, Bernards R. A gene-expression signature as a predictor of survival in breast cancer. N Engl J Med. 2002;347:1999–2009. doi: 10.1056/NEJMoa021967. [DOI] [PubMed] [Google Scholar]
- 20.Wang Y, Klijn JG, Zhang Y, Sieuwerts AM, Look MP, Yang F, Talantov D, Timmermans M, Meijer-van Gelder ME, Yu J, Jatkoe T, Berns EM, Atkins D, Foekens JA. Gene-expression profiles to predict distant metastasis of lymph-node-negative primary breast cancer. Lancet. 2005;365:671–679. doi: 10.1016/S0140-6736(05)17947-1. [DOI] [PubMed] [Google Scholar]
- 21.Beer DG, Kardia SLR, Huang C, Giordano TJ, Levin AM, Misek DE, Lin L, Chen G, Gharib TG, Thomas DG, Lizyness ML, Kuick R, Hayasaka S, Taylor JM, Iannettoni MD, Orringer MB, Hanash S. Gene-expression profiles predict survival of patients with lung adenocarcinoma. Nat Med. 2002;8:816–824. doi: 10.1038/nm733. [DOI] [PubMed] [Google Scholar]
- 22.Shipp MA, Ross KN, Tamayo P, Weng AP, Kutok JL, Aguiar RC, Gaasenbeek M, Angelo M, Reich M, Pinkus GS, Ray TS, Koval MA, Last KW, Norton A, Lister TA, Mesirov J, Neuberg DS, Lander ES, Aster JC, Golub TR. Diffuse large B-cell lymphoma outcome prediction by gene-expression profiling and supervised machine learning. Nat Med. 2002;8:68–74. doi: 10.1038/nm0102-68. [DOI] [PubMed] [Google Scholar]
- 23.Rosenwald A, Wright G, Chan WC, Connors JM, Campo E, Fisher RI, Gascoyne RD, Muller-Hermelink HK, Smeland EB, Giltnane JM, Hurt EM, Zhao H, Averett L, Yang L, Wilson WH, Jaffe ES, Simon R, Klausner RD, Powell J, Duffey PL, Longo DL, Greiner TC, Weisenburger DD, Sanger WG, Dave BJ, Lynch JC, Vose J, Armitage JO, Montserrat E, López-Guillermo A, Grogan TM, Miller TP, LeBlanc M, Ott G, Kvaloy S, Delabie J, Holte H, Krajci P, Stokke T, Staudt LM, Lymphoma/Leukemia Molecular Profiling Project The use of molecular profiling to predict survival after chemotherapy for diffuse larger B-cell lymphoma. N Engl J Med. 2002;346:1937–1947. doi: 10.1056/NEJMoa012914. [DOI] [PubMed] [Google Scholar]
- 24.Ransohoff DF. Bias as a threat to the validity of cancer molecular-marker research. Nat Rev Cancer. 2005;5:142–149. doi: 10.1038/nrc1550. [DOI] [PubMed] [Google Scholar]
- 25.Simon R, Radmacher MD, Dobbin K, McShane LM. Pitfalls in the use of DNA microarray data for diagnostic and prognostic classification. J Natl Cancer Inst. 2003;95:14–18. doi: 10.1093/jnci/95.1.14. [DOI] [PubMed] [Google Scholar]
- 26.Lipshutz RJ, Fodor SP, Gingeras TR, Lockhart DJ. High density synthetic oligonucleotide arrays. Nat Genet. 1999;21:20–24. doi: 10.1038/4447. [DOI] [PubMed] [Google Scholar]
- 27.Kaplan EL, Maier P. Non-parametric estimation of incomplete observations. J Am Stat Assoc. 1958;53:457–481. [Google Scholar]
- 28.Akyol G, Dash S, Shieh YS, Malter JS, Gerber MA. Detection of hepatitis C virus RNA sequences by polymerase chain reaction in fixed liver tissue. Mod Pathol. 1992;5:501–504. [PubMed] [Google Scholar]
- 29.Anderson J, Renshaw J, McManus A, Carter R, Mitchell C, Adams S, Pritchard-Jones K. Amplification of the t(2; 13) and t(1; 13) translocations of alveolar rhabdomyosarcoma in small formalin-fixed biopsies using a modified reverse transcriptase polymerase chain reaction. Am J Pathol. 1997;150:477–482. [PMC free article] [PubMed] [Google Scholar]
- 30.Wang Y, Liu Y, Wu C, Zhang H, Zheng X, Zheng Z, Geiger TL, Nuovo GJ, Liu Y, Zheng P. Epm2a suppresses tumor growth in an immunocompromised host by inhibiting Wnt signaling. Cancer Cell. 2006;10:179–190. doi: 10.1016/j.ccr.2006.08.008. [DOI] [PubMed] [Google Scholar]
- 31.Barrier A, Boelle PY, Roser F, Gregg J, Tse C, Brault D, Lacaine F, Houry S, Huguier M, Franc B, Flahault A, Lemoine A, Dudoit S. Stage II colon cancer prognosis predicted by tumor gene expression profiling. J Clin Oncol. 2006;29:4685–4691. doi: 10.1200/JCO.2005.05.0229. [DOI] [PubMed] [Google Scholar]
- 32.Lo SS, Norton J, Mumby PB, Smerage J, Kash J, Chew HK, Hayes D, Epstein A, Albain KS: Prospective multi-center study of the impact of the 21-gene Recurrence Score (RS) assay on medical oncologist (MO) and patient (pt) adjuvant breast cancer (BC) treatment selection. ASCO 2007, Abstract #577 [DOI] [PubMed]
- 33.Buyse M, Loi S, van't Veer L, Viale G, Delorenzi M, Glas AM, d'Assignies MS, Bergh J, Lidereau R, Ellis P, Harris A, Bogaerts J, Therasse P, Floore A, Amakrane M, Piette F, Rutgers E, Sotiriou C, Cardoso F, Piccart MJ, TRANSBIG Consortium Validation and clinical utility of a 70-gene prognostic signature for women with node-negative breast cancer. J Natl Cancer Inst. 2006;98:1183–1192. doi: 10.1093/jnci/djj329. [DOI] [PubMed] [Google Scholar]
- 34.Liefers GJ, Cleton-Jansen AM, van de Velde CJ, Hermans J, van Krieken JH, Cornelisse CJ, Tollenaar RA. Micrometastases and survival in stage II colorectal cancer. N Engl J Med. 1998;339:223–228. doi: 10.1056/NEJM199807233390403. [DOI] [PubMed] [Google Scholar]
- 35.Markowitz SD, Dawson DM, Willis J, Willson JK. Focus on colon cancer. Cancer Cell. 2002;1:233–236. doi: 10.1016/s1535-6108(02)00053-3. [DOI] [PubMed] [Google Scholar]
- 36.Allen WL, Johnston PG. Have we made progress in pharmacogenomics? The implementation of molecular markers in colon cancer. Pharmacogenomics. 2005;6:603–614. doi: 10.2217/14622416.6.6.603. [DOI] [PubMed] [Google Scholar]
- 37.Allen WL, Johnston PG. Role of genomic markers in colorectal cancer treatment. J Clin Oncol. 2005;23:4545–4552. doi: 10.1200/JCO.2005.19.752. [DOI] [PubMed] [Google Scholar]