Abstract
Background and purpose: Galegine and guanidine, originally isolated from Galega officinalis, led to the development of the biguanides. The weight-reducing effects of galegine have not previously been studied and the present investigation was undertaken to determine its mechanism(s) of action.
Experimental approach: Body weight and food intake were examined in mice. Glucose uptake and acetyl-CoA carboxylase activity were studied in 3T3-L1 adipocytes and L6 myotubes and AMP activated protein kinase (AMPK) activity was examined in cell lines. The gene expression of some enzymes involved in fat metabolism was examined in 3T3-L1 adipocytes.
Key results: Galegine administered in the diet reduced body weight in mice. Pair-feeding indicated that at least part of this effect was independent of reduced food intake. In 3T3-L1 adipocytes and L6 myotubes, galegine (50 μM-3 mM) stimulated glucose uptake. Galegine (1–300 μM) also reduced isoprenaline-mediated lipolysis in 3T3-L1 adipocytes and inhibited acetyl-CoA carboxylase activity in 3T3-L1 adipocytes and L6 myotubes. Galegine (500 μM) down-regulated genes concerned with fatty acid synthesis, including fatty acid synthase and its upstream regulator SREBP. Galegine (10 μM and above) produced a concentration-dependent activation of AMP activated protein kinase (AMPK) in H4IIE rat hepatoma, HEK293 human kidney cells, 3T3-L1 adipocytes and L6 myotubes.
Conclusions and implications: Activation of AMPK can explain many of the effects of galegine, including enhanced glucose uptake and inhibition of acetyl-CoA carboxylase. Inhibition of acetyl-CoA carboxylase both inhibits fatty acid synthesis and stimulates fatty acid oxidation, and this may to contribute to the in vivo effect of galegine on body weight.
Keywords: galegine, 3T3-L1 adipocytes, L6 myotubes, glucose uptake, acetyl CoA carboxylase, AMPK
Introduction
Previous studies from this laboratory demonstrated the potential anti-obesity effect of Galega officinalis, a plant used in traditional medicine for the treatment of diabetes. Although accompanied by a transient decrease in food intake, pair-feeding studies indicated that the effects on body weight were independent of changes in food intake (Palit et al., 1999). Indeed, food intake in treated mice eventually exceeded that seen in control animals. The main active ingredients of G. officinalis are galegine and guanidine, which gave rise to the biguanides (Bailey and Day, 1989). Water-ethanol extracts of G. officinalis, which contained significant quantities of galegine, also reduced body weight and diminished body weight gain in normal mice (unpublished observations). Preliminary studies showed that galegine reduced body weight gain in normal mice and reduced blood glucose and food intake, suggesting that at least part of the effect of G. officinalis on body weight was mediated via galegine. The aim of the present work was to investigate the potential mechanisms of action of galegine, as these have not previously been studied in detail, although it was shown to have some insulin-like actions in stimulating glucose uptake in rat diaphragm (Weitzel et al., 1971) and in exerting anti-lipolytic effects in adipocytes (Weitzel et al., 1972).
Materials and methods
Animals
All animal studies were carried out in accordance with the UK Animals (Scientific Procedures) Act 1986. Adult male BALB/c mice were obtained from stock at the Biological Procedures Unit within the University of Strathclyde. All animals were housed individually in an air-conditioned environment maintained at 21±2 °C with a 12 h light/12 h dark cycle. Animals were allowed continuous access to tap water and unless indicated otherwise were fed ad libitum on standard pellet diet (SDS, Cambridge, UK).
Feeding studies
Before initiation of feeding studies, mice were habituated to individual housing, and individual animal food intake and body weight was monitored daily at 09.30 hours. At the start of the experimental period (day 0), mice were randomly divided into groups (n=6–8) and food removed and substituted with standard diet pellets containing indicated concentrations of galegine. Daily food intake and body weight measurements were recorded for the duration of the study period (up to 11 days), and blood glucose determinations were made at the end of the study. In view of the reduction in food intake observed in galegine-treated mice, in some studies, control mice were pair-fed to galegine-treated animals, so that food intake of the two groups did not differ across a 5–11 days period.
Cells and cell culture
3T3-L1 fibroblasts (CCL-92.1) and L6 muscle cells (CRL-1458) were obtained from the American Type Culture Collection and cultured in Dulbecco's modified Eagle's media (DMEM) containing 10% newborn calf serum and 1% (v/v) antibiotics (100 U ml−1 penicillin, 0.1 mg ml−1 streptomycin) at 37 °C in a humidified atmosphere of 5% CO2 and 95% air. Confluent 3T3-L1 fibroblasts were induced to differentiate in multi-well plates by culturing for 3 days in 10% fetal bovine serum (FBS)/DMEM containing insulin (1 μg ml−1), 0.5 mM isobutylmethyl xanthine and 0.25 μM dexamethasone. Cells were then cultured in 10% FBS/DMEM containing insulin (1 μg ml−1) for a further 3 days. Subsequently, cells were cultured in 10% FBS/DMEM, which was replaced every 2 days until cells were fully differentiated (8–10 days after the start of the differentiation procedure).
L6 muscle cells were grown as monolayers in multi-well plates, and after reaching confluency were cultured in 1% newborn calf serum/DMEM to limit cell growth and aid the formation of multinucleated myotubes. Media was replaced every 2 days, and cells were used 4–6 days after reduction in the FBS media content.
Cell viability
The viability of 3T3-L1 adipocyte and L6 myotube cells following treatment during various incubations with galegine was determined using the alamarBlue assay technique (Nociari et al., 1998).
Glucose uptake
Glucose uptake studies were performed on fully differentiated 3T3-L1 adipocytes and L6 myotubes by measuring the transport of 2-deoxy-[3H]D-glucose (final concentration 50 μM, 0.5 μCi). (Hayes et al., 1993), following incubation at 37°C with increasing concentrations of galegine for 5 h.
Lipolysis
Lipolysis in fully differentiated 3T3-L1 cells incubated at 37 °C for 4 h, with or without 10 μM isoprenaline, was determined by measurement of glycerol release (Wieland, 1974).
Acetyl-CoA carboxylase enzyme activity
The acetyl-CoA carboxylase (ACC) activity within 3T3-L1 adipocytes and L6 myotubes was assayed using the method as described by Inoue and Lowenstein (1975).
Determination of activity of lipogenic enzymes
Epididymal fat deposits were excised from young adult male Sprague–Dawley rats (220–260 g) and placed on ice. Tissue was then homogenized with 1.5 volumes homogenizing buffer (70 mM KHCO3, 85 mM K2HPO4, 9 mM KH2PO4, 1 mM dithiothreitol, pH 8.0) by a Janke and Turrax T-25 homogenizer for 20 s. The homogenate was centrifuged at 20 000 g for 10 min and supernatant removed and centrifuged again at 105 000 g for 60 min. The resulting enzyme extract supernatant was stored at −20 °C and used in previously described continuous spectrophotometric assays (based on the oxidation or formation of NADPH at 37 °C) to assess the activity of fatty acid synthase (FASN) (Nepokroeff et al., 1975), ATP-citrate lyase (Takeda et al., 1969) and malic enzyme (Hsu and Lardy, 1969). Activities of enzymes were measured following incubation of enzyme extracts with concentrations of galegine of up to 500 μM.
AMP-activated protein kinase activity
AMP-activated protein kinase (AMPK) activity assays were performed on lysates of H4IIE hepatocyte cells, HEK293 cells, 3T3-L1 adipocytes and L6 myotubes cultured in 10 cm well plates with 10% FBS/DMEM supplemented with various concentrations of galegine for 1 h by measurement of phosphorylation of a synthetic peptide substrate, SAMS (HMRSAMSGLHLVKRR) (Davies et al., 1989). AMPK activity was expressed as nmol of phosphate incorporated into the peptide substrate per min per mg of lysate (nmol min−1 mg−1).
Gene expression and reverse transcription-PCR
Fully differentiated 3T3-L1 adipocytes were incubated with 500 μM galegine for 24 h at 37 °C. At the end of the incubation period, media was aspirated and cells washed twice with phosphate-buffered saline at 37 °C.
Total RNA was extracted from the cells using a RNeasy kit (Qiagen, Crawley, UK) with an on-column DNase digestion step to remove genomic DNA. The integrity and concentration of extracted RNA was determined using a BioAnalyzer (Agilent, Wokingham, UK) and then subjected to microarray analysis using Mouse Expression 430 GeneChips (A and B chips, Affymetrix, High Wycombe, UK) at the Sir Henry Wellcome Functional Genomics Facility (SHWFGF, University of Glasgow).
Quantitative real-time PCR (QPCR) analysis was undertaken to validate data obtained from the microarray studies. Several key genes from these processes were selected for QPCR analysis. Where possible, the QPCR primers for these genes were designed to recognize the same region of the target transcripts to which the Affymetrix GeneChip probes were hybridized. The expression of two housekeeping genes, β-2-microglobulin (B2M), and hypoxanthine guanine phosphoribosyl transferase, were examined for normalization purposes. All necessary reactions were carried out in single runs on a 96-well Chromo4 QPCR thermocycler (GRI, Essex, UK). To confirm their identity, QPCR reactions were run on 2% agarose gels, the amplicons gel purified (GFX PCR DNA and gel band purification kit, Amersham Biosciences, Little Chalfont, UK), and their sequence confirmed by automated DNA sequencing.
Data analysis
All data shown are the mean±standard error of the mean (mean±s.e.m.). The differences in food intake and body weight between control and galegine-treated groups were analysed by two-way analysis of variance for repeated measures. For in vitro assays, statistical significance was tested with one-way analysis of variance with Dunnett's post hoc test. Mean fold changes in gene transcript expression in 3T3-L1 adipocytes treated in vitro with galegine were determined using SHWFGF in-house FunAlyse v1.2 Microarray Data software. Only genes exhibiting at least a two-fold up- or downregulation following treatment were entered into the Gene Ontology Tree Machine web server (Zhang et al., 2004). This was used to identify gene ontology categories with significantly enriched gene numbers (P<0.001) in the galegine-treated cell transcript sets. The threshold cycle values (Ct) of data produced via QPCR analysis were determined using Opticon Monitor v2.0 software provided with the Chromo4 QPCR Thermocycler. These values were then entered into a Microsoft Excel QPCR analysis macro, REST (relative expression software tool; Pfaffl et al., 2002). This enabled group-wise comparison and statistical analysis of relative expression results from the QPCR of control and galegine-treated adipocyte cDNA, and normalization using housekeeping gene data.
Reagents
Synthesis and purification of galegine
Galegine is not commercially available and was synthesized by reaction of benzyl amine with 2-methylpseudourea sulphate. The white solid formed after re-crystallization was identified as galegine using 1H and 13C nuclear magnetic resonance spectroscopy, infrared spectroscopy and elemental analysis techniques, and had a purity greater than 99%.
Other reagents
Insulin, isobutylmethyl xanthine, dexamethasone, wortmannin and isoprenaline were sourced from Sigma (Poole, Dorset, UK). DMEM tissue culture medium, FBS, newborn calf serum, penicillin and streptomycin were all purchased from Gibco (Paisley, Strathclyde, Scotland). 2-Deoxy-[3H]D-glucose, NaHC14O3 and [γ-32P]ATP were obtained from Amersham Pharmacia Biotech (Buckinghamshire, UK). All water used in these experiments was purified using a Milli-Q Water Purification System (Millipore, Milford, MA, USA). All other chemicals used were of the highest available purity.
Results
Feeding studies
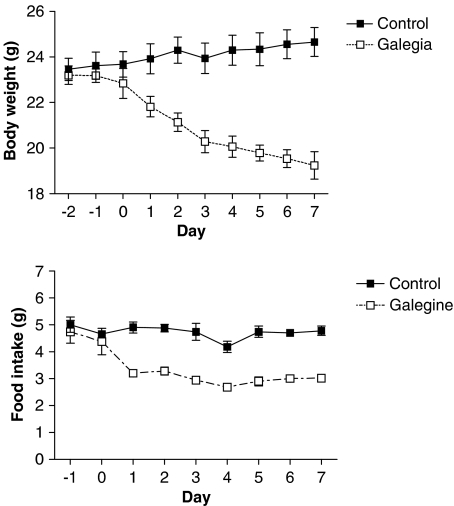
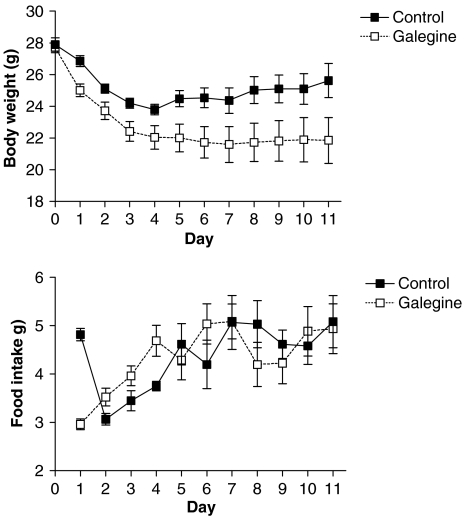
Galegine (3.41 mmol kg−1 feed that is 600 mg kg−1 feed; approximate daily dose of 0.5 mmol galegine per kg body weight) produced a decrease in the body weight and food intake of mice relative to controls (Figure 1). Blood glucose was also reduced at the end of the experiment (3.2±0.4 mmol l−1 compared with control value of 6.0±0.5 mmol l−1; n=5; P<0.001). In pair-fed mice, where the food intake was not significantly different from controls, galegine (3.41 mmol kg−1 feed) also produced a significant reduction in body weight, which was sustained across 11 days (Figure 2). In this study, however, the fall in blood glucose did not reach statistical significance (4.7±0.9mmol l−1 compared with control of 6.0±1.1 mmol l−1; n=7). Galegine in this dose produced no toxicity when administered over 28 days.
Figure 1.
Effect of galegine incorporation (3.41 mmol kg−1 feed) into the diet of male BALB/c mice on body weight (upper panel) and food intake (lower panel) after 7 days treatment. Values shown are mean±s.e.m. (n=6–8 per group). Two-way analysis of variance showed a significant difference between galegine-treated and control mice for both body weight (P<0.0001) and food intake (P<0.0001). In each case, there was a significant effect of ‘time' (P<0.005), but no significant interaction between time and treatment.
Figure 2.
Body weight (upper panel) and food intake (lower panel) in mice receiving galegine (3.41 mmol kg−1 feed) compared with that in pair-fed controls. Values shown are mean±s.e.m. (n=8). Two-way analysis of variance showed a significant difference between body weight of galegine-treated and control mice (P<0.001), but no significant difference for food intake. In each case, there was a significant effect of time (P<0.0001), but no significant interaction between time and treatment.
Effect of galegine on in vitro glucose uptake by 3T3-L1 adipocytes and L6 myotubes
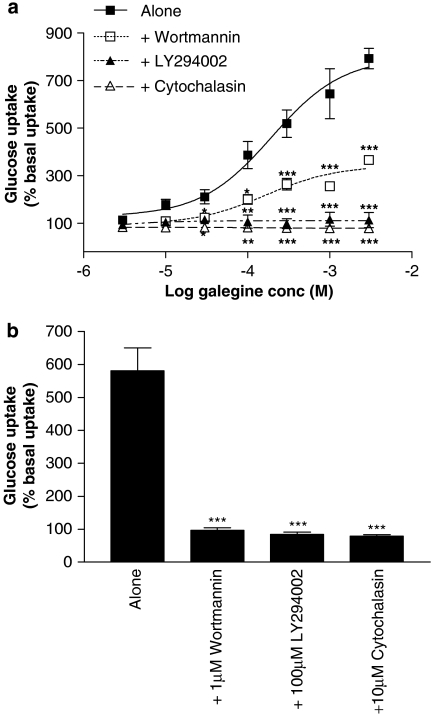
Pre-treatment with galegine (10 μM–3 mM; 5 h) produced a concentration-dependent stimulation of insulin-independent glucose uptake by 3T3-L1 adipocytes (Figure 3a) without any effect on cell viability (data not shown). The PI3 kinase inhibitor LY294002 (100 μM) prevented the effect of galegine on glucose uptake even at maximal galegine concentrations. Another PI3 kinase inhibitor, wortmannin (1 μM), reduced, but did not abolish, galegine-stimulated glucose uptake (Figure 3a). The stimulatory effect of insulin (1 μM) on glucose uptake by 3T3-L1 adipocytes was prevented by either wortmannin or LY294002 (Figure 3b). Treatment of cells with 10 μM cytochalasin B completely inhibited both galegine- and insulin-stimulated glucose uptake into 3T3-L1 adipocytes (Figures 3a and b).
Figure 3.
Effects of 5 h treatment with galegine (a, upper panel) and insulin (b, lower panel) on 2-deoxy-D-glucose uptake by 3T3-L1 adipocytes in the absence or presence of 1 μM wortmannin, 100 μM LY294002 or 10 μM cytochalasin B. Results are expressed as a percentage of basal glucose uptake and values shown are mean±s.e.m. of observations from two individual experiments of three replicates per experiment. *P<0.05, **P<0.01, ***P<0.001 vs galegine alone.
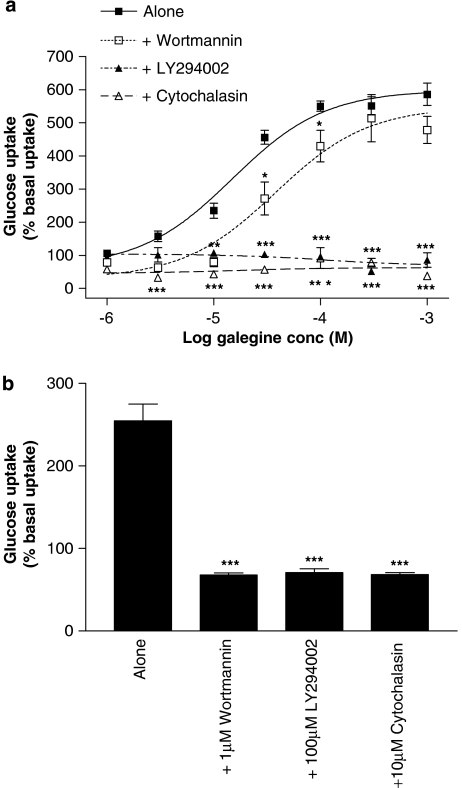
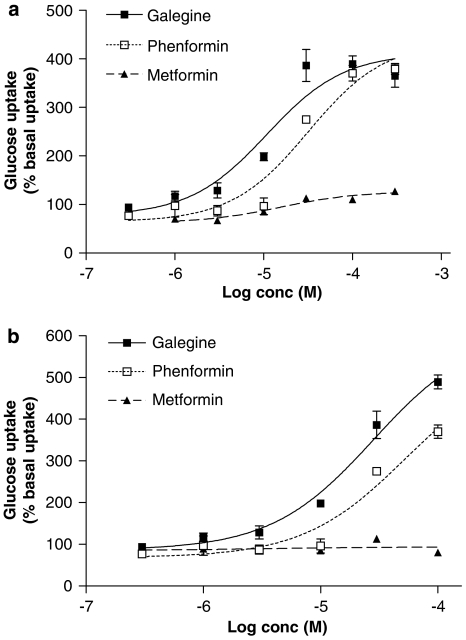
Incubation with galegine (1 μM–1 mM, 5 h) produced a concentration-dependent stimulation of glucose uptake into L6 myotubes (Figure 4a), again without any effect on cell viability (data not shown). Treatment of L6 myotubes with 100 μM LY294002 inhibited this effect of galegine, although wortmannin (1 μM) produced only a small reduction in galegine-stimulated glucose uptake. The stimulatory action of 1 μM insulin on glucose uptake by L6 myotubes was prevented by both wortmannin and LY294002 (Figure 4b). Treatment of L6 myotubes with 10 μM cytochalasin abolished both galegine- (Figure 4a) and insulin-stimulated (Figure 4b) glucose uptake. A 24-h cell incubation with phenformin stimulated 2-deoxy-D-glucose uptake in both 3T3-L1 adipocytes (Figure 5a) and L6 myotubes (Figure 5b) with a broadly similar potency and maximal response to galegine. Metformin was much less potent in 3T3-L1 adipocytes and showed no activity in L6 myotubes up to 100 μM.
Figure 4.
Effects of 5 h treatment with galegine (a, upper panel) and insulin (b, lower panel) on 2-deoxy-D-glucose uptake by L6 myotubes in the absence or presence of 1 μM wortmannin, 100 μM LY294002 or 10 μM cytochalasin B. Results are expressed as a percentage of basal glucose uptake and values shown are mean±s.e.m. of observations from two individual experiments with three replicates per experiment. *P<0.05, **P<0.01, ***P<0.001 vs galegine alone.
Figure 5.
Comparison of the effects of 24 h treatment with galegine, phenformin and metformin on 2-deoxy-D-glucose uptake by 3T3-L1 adipocytes (a, upper panel) and L6 myotubes (b, lower panel). Results are expressed as a percentage of basal glucose uptake and are mean±s.e.m. of observations from two individual experiments with three replicates per experiment.
Effect of galegine on lipolysis in 3T3-L1 adipocytes
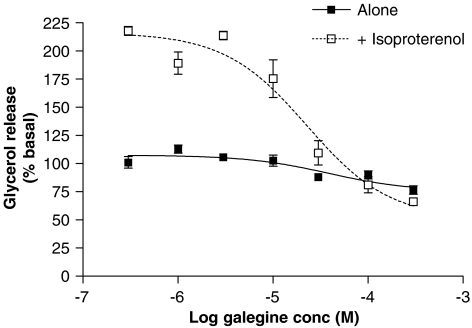
A 24-h incubation with galegine (0.3–300 μM) produced a slight reduction in basal glycerol release and a more marked reduction in isoprenaline-stimulated glycerol release from 3T3-L1 adipocytes (Figure 6).
Figure 6.
Effect of 24 h treatment with galegine on basal lipolysis and 10 μM isoprenaline-stimulated lipolysis in 3T3-L1 adipocytes. Results are expressed as a percentage of basal glycerol release and are mean±s.e.m. of observations from three individual experiments with three replicates per experiment.
Effect of galegine on acetyl-CoA carboxylase activity
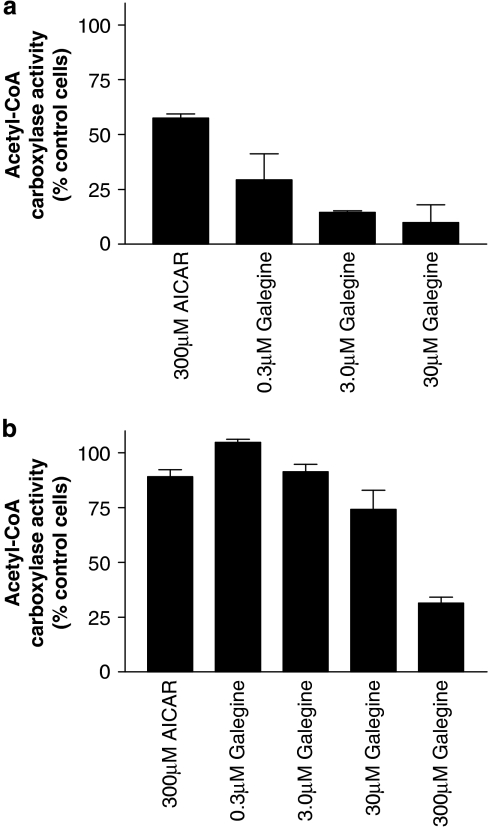
Galegine (0.3–30 μM, 24 h) produced a concentration-dependent reduction in ACC activity in 3T3-L1 adipocytes. The known activator of AMPK aminoimidazole-4-carboxamide ribonucleotide (AICAR) also significantly reduced ACC activity in 3T3-L1 adipocytes, although it was less potent than galegine (Figure 7a). Galegine and AICAR also reduced acetyl CoA carboxylase activity in L6 myotubes (Figure 7b), galegine appearing less potent in this cell line with effects reaching statistically significance only at concentrations of 30 μM and above.
Figure 7.
Effect of 24 h galegine treatment on acetyl-CoA carboxylase activity in 3T3-L1 adipocytes (a, upper panel) and L6 myotubes (b, lower panel). Results are mean±s.e.m. (n=3) and are expressed as a percentage of activity measured within control cells. In 3T3-L1 adipocytes (upper panel), all values are statistically significantly different from control (ANOVA followed by Dunnett's P<0.01), whereas there is no significant effect of galegine on acetyl-CoA carboxylase in L6 myotubes. ANOVA, analysis of variance.
Direct effect of galegine on lipogenic enzymes
Direct incubation of galegine (500 μM) with homogenates of rat epididymal adipose had no effect on the activities of FASN, malic enzyme or ATP citrate lyase (Table 1).
Table 1.
The effect of 500 μM galegine on the activity of fatty acid synthase, ATP-citrate lyase and malic enzyme extracted from fat tissue
| Treatment |
Enzyme activity (nmol mg−1 min−1) |
||
|---|---|---|---|
| Fatty acid synthase | ATP-citrate lyase | Malic enzyme | |
| Control | 1.48±0.01 | 2.19±0.01 | 487.6±10.0 |
| Galegine | 1.50±0.05 | 2.18±0.1 | 514.5±3.2 |
The activities of fatty acid synthase and ATP-citrate lyase are expressed as nmol of NADPH oxidized per mg protein per min and the activity of malic enzyme expressed as nmol of NADPH formed per mg protein per min. Data are expressed as mean±s.e.m., n=3.
Effect of galegine on AMPK activity
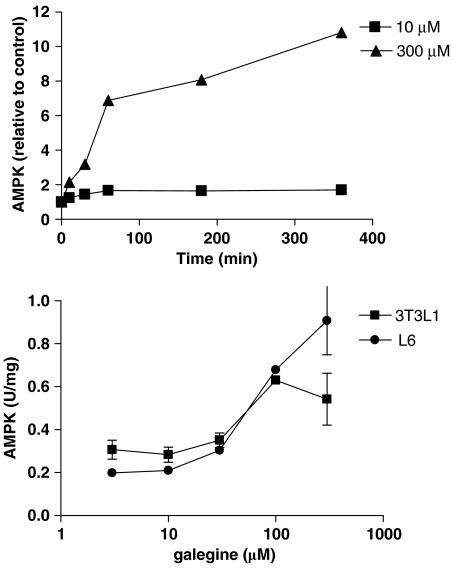
Incubation of H4IIE rat hepatoma cells with galegine (10 or 300 μM) for up to 6 h produced a time-dependent activation of AMPK measured in cell lysates, with maximal activation at 360 min and twofold activation still evident at 24 h (data not shown) in the presence of 300 μM galegine. The effect of 300 μM galegine was markedly greater than that of 10 μM (Figure 8). Incubation with galegine for 1 h produced a concentration-dependent activation of AMPK in both 3T3L-1 adipocytes and L-6 myotubes (Figure 8). Galegine also produced a concentration-dependent activation of the enzyme in a human kidney cell line (HEK293) (data not shown).
Figure 8.
Effect of galegine treatment on AMPK activity of H4IIE rat hepatoma cells (upper panel) or 3T3-L1 adipocytes and L6 myotubes (1 h incubation, lower panel). AMPK activities are expressed relative to activity detected in control cells (upper panel) or in absolute units (lower panel). Each point is the mean (±s.e.m.) of three separate experiments, with each assay being done in duplicate. AMPK, AMP-activated protein kinase.
Effects of galegine on gene expression
Microarray analysis of 3T3-L1 adipocytes exposed for 24 h to galegine (500 μM) revealed changes in expression of a group of lipid and insulin signalling pathway genes (Table 2). QPCR studies were carried out on adipocytes to validate data obtained from microarray analysis. REST analysis found that changes in expression of the genes analysed by QPCR, in general, matched the direction and approximate mean fold changes observed using the Affymetrix Mouse Expression GeneChip microarray (Table 2). These genes included FASN and sterol-regulatory-element-binding protein (SREBP), which exhibited 2.5-fold and 2.0-fold down-regulation in expression, respectively. Hormone-sensitive lipase and acyl-CoA synthetase also showed altered expression in adipocytes, where they both exhibited significant downregulation, although these observations have not been validated by QPCR.
Table 2.
Galegine-induced change in expression of genes in mouse liver and 3T3-L1 adipocytes
| Gene | 3T3-L1 adipocyte microarray | 3T3-L1 adipocyte QPCR | P-value |
|---|---|---|---|
| Fold change | Fold change | ||
| Acyl-COA synthetase long-chain family member 1 (ACSL1) | −2.80 | NA | NA |
| Lipase, Hormone sensitive (HSL) | −2.25 | NA | NA |
| Peroxisome proliferator activated receptor gamma coactivator 1 alpha (PGC-1) | +1.87 | NA | NA |
| Tribbles homolog 3 (TRB3) | +4.09 | NA | NA |
| Fatty acid synthase (FASN) | −2.31 | −2.458 | 0.001 |
| Phosphoenolpyruvate carboxykinase 1, cytosolic (PCK1) | −2.56 | −1.809 | 0.001 |
| Sterol regulatory element binding protein 1 (SREBP) | −1.89 | −1.991 | 0.001 |
Abbreviations: NA, not assayed; QPCR, real-time quantitative PCR.
Mice were fed a diet as detailed in Materials and methods. Adipocytes were treated for 24 h with 0.5 mM galegine relative to expression in control non-treated cells. The microarray results were from a single microarray study where four pooled control adipocyte cultures were compared with four pooled galegine-treated adipocyte cultures. The QPCR results were obtained from three pairs of control and galegine-treated adipocytes, with three replicate readings per gene of interest, with the exception of PCK1 data, which were represent three replicate readings from two pairs of treated and control adipocytes. QPCR values were normalized by HPRT expression. QPCR data analysis was carried out using REST (Relative Expression Software Tool). P-values are for QPCR results only.
The transcriptional co-activator, peroxisome proliferator-activated receptor-γ co-activator-1α was upregulated by 1.87-fold in adipocytes incubated with galegine. There was a significant downregulation (−1.8 fold, P=0.001) of phosphoenolpyruvate carboxykinase-1 in galegine-treated adipocytes.
Tribbles-3 expression was increased in 3T3-L1 adipocytes (4.09-fold) incubated with galegine, although this has not been validated by QPCR.
Discussion
Galegine produced weight loss, reduction in weight gain and reduced blood glucose, accompanied by a decrease in food intake. A significant part of this weight loss is due to reduction in food intake, but a pair-feeding experiment demonstrated that it could at least partly be attributed to other effects, as suggested for the plant G. officinalis administered in the same way (Palit et al., 1999). The in vivo effect of galegine may depend on initial body weight, as another pair-feeding experiment (data not shown), using mice with a markedly lower initial body weight (23 g compared with 28 g in data presented in Figure 2), showed no dissociation of body weight loss from reduced food intake. Nevertheless, the in vitro pharmacology of galegine demonstrated actions compatible with in vivo metabolic activities, independent of reduced food intake. Thus, galegine stimulated glucose uptake by both 3T3-L1 adipocytes and L6 myotubes, which could contribute to the in vivo hypoglycaemic action of galegine. The stimulation of glucose uptake is not due to cell toxicity, as evidenced by the lack of cytotoxicity in the concentration range used. Moreover, cytochalasin B, in addition to inhibiting the effect of insulin, also inhibited the stimulatory effect of galegine on glucose uptake by both cell types, suggesting a role for glucose transporter GLUT4 (Keller and Mueckler, 1990; Sarabia et al., 1992) and other glucose transporters such as GLUT1, which is also expressed in L6 myotubes and 3T3-L1 adipocytes, in mediating the effect of galegine. Like the effects of insulin, the stimulatory effects of galegine on glucose uptake by 3T3-L1 adipocytes were reduced by the PI3 kinase inhibitor wortmannin (Ui et al., 1995) and abolished by LY294002, another PI3 kinase inhibitor (Stein, 2001). Although LY294002 also markedly reduced the effects of galegine in L6 myotubes, wortmannin was much less effective, despite being just as effective in reducing the action of insulin. The reason for this discrepancy is unclear, but the balance of evidence supports some contribution from the PI3 kinase pathway in the stimulatory action of galegine on glucose uptake. However, effects of wortmannin and LY294002 on other kinases cannot be excluded.
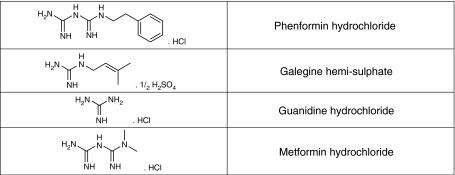
Galegine is a guanidine derivative, and guanidine was the compound derived from G. officinalis, which gave rise to the biguanides, metformin and phenformin (Bailey and Day, 1989; see Figure 9 for structure of galegine and guanidine compared with the biguanides). Metformin and phenformin both activate AMPK (Zhou et al., 2001), and the use of mice with a liver-specific knockout of the kinase LKB1 suggests that activation of AMPK in the liver (which requires the upstream kinase LKB1) is largely responsible for the glucose-lowering effect of metformin (Shaw et al., 2005). The effects of biguanides on AMPK are probably mediated by their ability to inhibit complex I of the respiratory chain (El-Mir et al., 2000; Owen et al., 2000), and thus increase the cellular AMP:ATP ratio. Increases in AMP:ATP have indeed been demonstrated for phenformin (Hawley et al., 2005), although they have been more difficult to demonstrate for the less potent biguanide, metformin.
Figure 9.
Structure of galegine compared with that of guanidine, metformin and phenformin.
In the present study, phenformin had similar effects to those of galegine in stimulating glucose uptake in 3T3-L1 adipocytes and L6 myotubes, although metformin was much less effective and less potent. Activation of AMPK stimulates glucose uptake in skeletal muscle (Merrill et al., 1997; Hayashi et al., 1998) and mediates the effect of AICAR (Sakamoto et al., 2005). Unlike the effects of galegine in L6 myotubes in the present study, the effects of AICAR in stimulating glucose uptake in skeletal muscle were not affected by wortmannin, although LY294002 was not tested (Hayashi et al., 1998; Bergeron et al., 1999). There is considerable evidence that the effects of AICAR in stimulating glucose uptake involve glucose transporters (Kurth-Kraczek et al., 1999; Yamaguchi et al., 2005), as suggested in the present study for galegine. The mode of activation of glucose transporters remains to be determined, but there were no changes in the expression of GLUT1 (+1.2-fold) or GLUT4 (no change) genes (data not shown).
The effects of metformin in vivo appear to be primarily on the liver, possibly because hepatocytes express high levels of the organic cation transport, OCT1, which appears to facilitate the uptake of metformin (Wang et al., 2002; Shu et al., 2007). Whether OCT1 is involved in the uptake of galegine is not clear at present.
Although we show that galegine had no direct effect on adipose tissue enzymes (malic enzyme, FASN, citrate lyase) that are important in the synthesis of fat, it produced a potent inhibition of acetyl CoA carboxylase when incubated for 24 h with 3T3L-1 adipocytes. ACC exists as two isoforms, with the ACC1 (ACC-α) isoform predominating in adipocytes where it functions in fatty acid synthesis, and the ACC2 (ACC-β) isoform predominating in muscle where its inhibition stimulates fatty acid oxidation (Abu-Elheiga et al., 2001). Both ACC1 (Davies et al., 1992) and ACC2 (Winder et al., 1997) are phosphorylated and activated by AMPK. In the present experiments, we found that the AMPK activator AICAR inhibited ACC in 3T3-L1 adipocytes and, albeit much less markedly, in L6 myotubes. Galegine also inhibited isoprenaline-stimulated lipolysis, another action associated with AMPK activation (Sullivan et al., 1994; Corton et al., 1995; Watt et al., 2006). The observation that galegine activates AMPK in 3T3-L1 adipocytes and L6 myotubes, as well as in the H4IIE rat hepatoma and HEK293 human kidney cell lines, supports the hypothesis that galegine works, at least in part, through activation of AMPK. In the liver, activation of AMPK leads to inhibition of lipogenesis and glucose production and stimulation of fatty acid oxidation (Viollet et al., 2006).
Finally, in 3T3-L1 adipocytes, galegine downregulated the expression of mRNAs encoding several genes involved in lipid metabolism, including FASN, sterol-regulatory-element-binding protein, hormone-sensitive lipase and acyl-CoA synthetase, although the changes in the last two must be interpreted cautiously as they have not been validated using QPCR. Activation of AMPK is known to reduce the expression of proteins involved in lipogenesis, including the upstream regulator SREBP, at least in the liver (Zhou et al., 2001; Foretz et al., 2005). Hence, activation of AMPK may provide a unifying hypothesis explaining the mechanism of action of galegine. This has already been proposed for the biguanides (Zhou et al., 2001; Hawley et al., 2002) which, like galegine, have been found to have an anti-obesity action (Pasquali et al., 2000; Kay et al., 2001; Kim et al., 2006). The upregulation of the transcriptional co-activator PGC-1α (peroxisome proliferator-activated receptor-γ co-activator-1α) by galegine is also compatible with previous studies demonstrating increased PGC-1α mRNA expression in skeletal muscle in response to AMPK activation (Terada et al., 2002; Zong et al., 2002). PGC-1α has important roles in promoting cold-induced thermogenesis and fatty acid oxidation, and its expression is reduced in morbidly obese subjects (Semple et al., 2004). The observed downregulation of hormone-sensitive lipase may be an additional explanation for the inhibition of isoprenaline-induced lipolysis. AMPK-mediated inhibition of hormone-sensitive lipase is accompanied by reduced phosphorylation of the lipase (Garton et al., 1989; Watt et al., 2006), but the role of downregulation of protein expression has not been investigated. The significance of the upregulation of Tribbles-3 (which has not been validated using QPCR) is unclear, but this gene was found recently to be upregulated in 3T3-L1 adipocytes in response to reductions in available glucose and was suggested to be involved in cell-survival in response to glucose deprivation (Yacoub Wasef et al., 2006). This may relate to the previously demonstrated inhibitory effect of galegine on mitochondrial respiration (Lotina et al., 1973), which could be the mechanism whereby it activates AMPK, as indicated above for the biguanides. In this context, however, we were unable to detect any significant effect of galegine on the expression of genes concerned with oxidative phosphorylation (for example, NADPH-ubiquinone dehydrogenase, succinate dehydrogenase complex, ATP synthase) in 3T3-L1 adipocytes.
Acknowledgments
We are grateful to Hyundai Pharma (Seoul, Korea) for financial support and to Mrs Pat Owen for editorial assistance. DGH and SAH were supported by the EXGENESIS Integrated Project funded by the European Commission (LSHM-CT-2004-005272). SF was supported by a Research Studentship from the Wellcome Trust.
Abbreviations
- ACC
acetyl-CoA carboxylase
- AICAR
aminoimidazole-4-carboxamide ribonucleotide
- AMPK
AMP-activated protein kinase
- DMEM
Dulbecco's modified Eagle's media
- FASN
fatty acid synthase
- FBS
fetal bovine serum
Conflict of interest
The authors state no conflict of interest.
References
- Abu-Elheiga L, Matzuk MM, Abo-Hashema KA, Wakil SJ. Continuous fatty acid oxidation and reduced fat storage in mice lacking acetyl-CoA carboxylase 2. Science. 2001;291:2613–2616. doi: 10.1126/science.1056843. [DOI] [PubMed] [Google Scholar]
- Bailey CJ, Day C. Traditional plant medicines as treatments for diabetes. Diabetes Care. 1989;12:553–564. doi: 10.2337/diacare.12.8.553. [DOI] [PubMed] [Google Scholar]
- Bergeron R, Russell RR, III, Young LH, Ren JM, Marcucci M, Lee A, et al. Effect of AMPK activation on muscle glucose metabolism in conscious rats. Am J Physiol. 1999;276:E938–E944. doi: 10.1152/ajpendo.1999.276.5.E938. [DOI] [PubMed] [Google Scholar]
- Corton JM, Gillespie JG, Hawley SA, Hardie DG. 5-Aminoimidazole-4-carboxamide ribonucleoside: a specific method for activating AMP-activated protein kinase in intact cells. Eur J Biochem. 1995;229:558–565. doi: 10.1111/j.1432-1033.1995.tb20498.x. [DOI] [PubMed] [Google Scholar]
- Davies SP, Carling D, Hardie DG. Tissue distribution of the AMP-activated protein kinase, and lack of activation by cyclic-AMP-dependent protein kinase, studied using a specific and sensitive peptide assay. Eur J Biochem. 1989;186:123–128. doi: 10.1111/j.1432-1033.1989.tb15185.x. [DOI] [PubMed] [Google Scholar]
- Davies SP, Carling D, Munday MR, Hardie DG. Diurnal rhythm of phosphorylation of rat liver acetyl-CoA carboxylase by the AMP-activated protein kinase, demonstrated using freeze-clamping. Effects of high fat diets. Eur J Biochem. 1992;203:615–623. doi: 10.1111/j.1432-1033.1992.tb16591.x. [DOI] [PubMed] [Google Scholar]
- El-Mir MY, Nogueira V, Fontaine E, Averet N, Rigoulet M, Leverve X. Dimethylbiguanide inhibits cell respiration via an indirect effect targeted on the respiratory chain complex I. J Biol Chem. 2000;275:223–228. doi: 10.1074/jbc.275.1.223. [DOI] [PubMed] [Google Scholar]
- Foretz M, Ancellin N, Andreelli F, Saintillan Y, Grondin P, Kahn A, et al. Short-term overexpression of a constitutively active form of AMP-activated protein kinase in the liver leads to mild hypoglycemia and fatty liver. Diabetes. 2005;54:1331–1339. doi: 10.2337/diabetes.54.5.1331. [DOI] [PubMed] [Google Scholar]
- Garton AJ, Campbell DG, Carling D, Hardie DG, Colbran RJ, Yeaman SJ. Phosphorylation of bovine hormone-sensitive lipase by the AMP-activated protein kinase. A possible antilipolytic mechanism. Eur J Biochem. (1989);179:249–254. doi: 10.1111/j.1432-1033.1989.tb14548.x. [DOI] [PubMed] [Google Scholar]
- Hawley SA, Gadalla AE, Olsen GS, Hardie DG. The antidiabetic drug metformin activates the AMP-activated protein kinase cascade via an adenine nucleotide-independent mechanism. Diabetes. 2002;51:2420–2425. doi: 10.2337/diabetes.51.8.2420. [DOI] [PubMed] [Google Scholar]
- Hawley SA, Pan DA, Mustard KJ, Ross L, Bain J, Edelman AM, et al. Calmodulin-dependent protein kinase kinase-beta is an alternative upstream kinase for AMP-activated protein kinase. Cell Metab. 2005;2:9–19. doi: 10.1016/j.cmet.2005.05.009. [DOI] [PubMed] [Google Scholar]
- Hayashi T, Hirshman MF, Kurth EJ, Winder WW, Goodyear LJ. Evidence for 5′ AMP-activated protein kinase mediation of the effect of muscle contraction on glucose transport. Diabetes. 1998;47:1369–1373. doi: 10.2337/diab.47.8.1369. [DOI] [PubMed] [Google Scholar]
- Hayes N, Biswas C, Strout HV, Berger J. Activation by protein synthesis inhibitors of glucose transport into L6 muscle cells. Biochem Biophys Res Commun. 1993;190:881–887. doi: 10.1006/bbrc.1993.1131. [DOI] [PubMed] [Google Scholar]
- Hsu RY, Lardy HA. Malic enzyme. Methods Enzymol. 1969;13:230–235. [Google Scholar]
- Inoue H, Lowenstein JM. Acetyl coenzyme A carboxylase from rat liver. Methods Enzymol. 1975;35:3–11. doi: 10.1016/0076-6879(75)35131-8. [DOI] [PubMed] [Google Scholar]
- Kay JP, Alemzadeh R, Langley G, D′Angelo L, Smith P, Holshouser S. Beneficial effects of metformin in normoglycemic morbidly obese adolescents. Metabolism. 2001;50:1457–1461. doi: 10.1053/meta.2001.28078. [DOI] [PubMed] [Google Scholar]
- Keller K, Mueckler M. Different mammalian facilitative glucose transporters expressed in Xenopus oocytes. Biomed Biochim Acta. 1990;49:1201–1203. [PubMed] [Google Scholar]
- Kim YW, Kim JY, Park YH, Park SY, Won KC, Choi KH, et al. Metformin restores leptin sensitivity in high-fat-fed obese rats with leptin resistance. Diabetes. 2006;55:716–724. doi: 10.2337/diabetes.55.03.06.db05-0917. [DOI] [PubMed] [Google Scholar]
- Kurth-Kraczek EJ, Hirshman MF, Goodyear LJ, Winder WW. 5′ AMP-activated protein kinase activation causes GLUT4 translocation in skeletal muscle. Diabetes. 1999;48:1667–1671. doi: 10.2337/diabetes.48.8.1667. [DOI] [PubMed] [Google Scholar]
- Lotina B, de Gomez-Puyou MT, Gomez-Puyou A. Respiratory changes induced by guanidines and cations in submitochondrial particles. Arch Biochem Biophys. 1973;159:520–527. doi: 10.1016/0003-9861(73)90484-0. [DOI] [PubMed] [Google Scholar]
- Merrill GF, Kurth EJ, Hardie DG, Winder WW. AICA riboside increases AMP-activated protein kinase, fatty acid oxidation, and glucose uptake in rat muscle. Am J Physiol. 1997;273:E1107–E1112. doi: 10.1152/ajpendo.1997.273.6.E1107. [DOI] [PubMed] [Google Scholar]
- Nepokroeff CM, Lakshmanan MR, Porter JW. Fatty acid synthase from rat liver. Methods Enzymol. 1975;35:37–44. doi: 10.1016/0076-6879(75)35136-7. [DOI] [PubMed] [Google Scholar]
- Nociari MM, Shalev A, Benias P, Russo C. A novel one-step, highly sensitive fluorimetric assay to evaluate cell-mediated cytotoxicity. J Immunol Methods. 1998;213:157–167. doi: 10.1016/s0022-1759(98)00028-3. [DOI] [PubMed] [Google Scholar]
- Owen MR, Doran E, Halestrap AP. Evidence that metformin exerts its anti-diabetic effects through inhibition of complex 1 of the mitochondrial respiratory chain. Biochem J. 2000;348:607–614. [PMC free article] [PubMed] [Google Scholar]
- Palit P, Furman BL, Gray AI. Novel weight-reducing activity of Galega officinalis in mice. J Pharm Pharmacol. 1999;51:1313–1319. doi: 10.1211/0022357991776895. [DOI] [PubMed] [Google Scholar]
- Pasquali R, Gambineri A, Biscotti D, Vicennati V, Gagliardi L, Colitta D, et al. Effect of long-term treatment with metformin added to hypocaloric diet on body composition, fat distribution, and androgen and insulin levels in abdominally obese women with and without the polycystic ovary syndrome. J Clin Endocrinol Metab. 2000;85:2767–2774. doi: 10.1210/jcem.85.8.6738. [DOI] [PubMed] [Google Scholar]
- Pfaffl MW, Horgan GW, Dempfle L. Relative expression software tool (REST) for group-wise comparison and statistical analysis of relative expression results in real-time PCR. Nucleic Acids Res. 2002;30:e36. doi: 10.1093/nar/30.9.e36. [DOI] [PMC free article] [PubMed] [Google Scholar]
- Sakamoto K, McCarthy A, Smith D, Green KA, Hardie DG, Ashworth A, et al. Deficiency of LKB1 in skeletal muscle prevents AMPK activation and glucose uptake during contraction. EMBO J. 2005;24:1810–1820. doi: 10.1038/sj.emboj.7600667. [DOI] [PMC free article] [PubMed] [Google Scholar]
- Sarabia V, Lam L, Burdett E, Leiter LA, Klip A. Glucose transport in human skeletal muscle cells in culture. Stimulation by insulin and metformin. J Clin Invest. 1992;90:1386–1395. doi: 10.1172/JCI116005. [DOI] [PMC free article] [PubMed] [Google Scholar]
- Semple RK, Crowley VC, Sewter CP, Laudes M, Christodoulides C, Considine RV, et al. Expression of the thermogenic nuclear hormone receptor coactivator PGC-1alpha is reduced in the adipose tissue of morbidly obese subjects. Int J Obes Relat Metab Disord. 2004;28:176–179. doi: 10.1038/sj.ijo.0802482. [DOI] [PubMed] [Google Scholar]
- Shaw RJ, Lamia KA, Vasquez D, Koo SH, Bardeesy N, Depinho RA, et al. The kinase LKB1 mediates glucose homeostasis in liver and therapeutic effects of metformin. Science. 2005;310:1642–1646. doi: 10.1126/science.1120781. [DOI] [PMC free article] [PubMed] [Google Scholar]
- Shu Y, Sheardown SA, Brown C, Owen RP, Zhang S, Castro RA, et al. Effect of genetic variation in the organic cation transporter 1 (OCT1) on metformin action. J Clin Invest. 2007;117:1422–1431. doi: 10.1172/JCI30558. [DOI] [PMC free article] [PubMed] [Google Scholar]
- Stein RC. Prospects for phosphoinositide 3-kinase inhibition as a cancer treatment. Endocr Relat Cancer. 2001;8:237–248. doi: 10.1677/erc.0.0080237. [DOI] [PubMed] [Google Scholar]
- Sullivan JE, Brocklehurst KJ, Marley AE, Carey F, Carling D, Beri RK. Inhibition of lipolysis and lipogenesis in isolated rat adipocytes with AICAR, a cell-permeable activator of AMP-activated protein kinase. FEBS Lett. 1994;353:33–36. doi: 10.1016/0014-5793(94)01006-4. [DOI] [PubMed] [Google Scholar]
- Takeda Y, Suzuki F, Inoue H. ATP citrate lyase (citrate-cleavage enzyme) Methods Enzymol. 1969;13:153–160. [Google Scholar]
- Terada S, Goto M, Kato M, Kawanaka K, Shimokawa T, Tabata I. Effects of low-intensity prolonged exercise on PGC-1 mRNA expression in rat epitrochlearis muscle. Biochem Biophys Res Commun. 2002;296:350–354. doi: 10.1016/s0006-291x(02)00881-1. [DOI] [PubMed] [Google Scholar]
- Ui M, Okada T, Hazeki K, Hazeki O. Wortmannin as a unique probe for an intracellular signalling protein, phosphoinositide 3-kinase. Trends Biochem Sci. 1995;20:303–307. doi: 10.1016/s0968-0004(00)89056-8. [DOI] [PubMed] [Google Scholar]
- Viollet B, Foretz M, Guigas B, Horman S, Dentin R, Bertrand L, et al. Activation of AMP-activated protein kinase in the liver: a new strategy for the management of metabolic hepatic disorders. J Physiol. 2006;574:41–53. doi: 10.1113/jphysiol.2006.108506. [DOI] [PMC free article] [PubMed] [Google Scholar]
- Wang DS, Jonker JW, Kato Y, Kusuhara H, Schinkel AH, Sugiyama Y. Involvement of organic cation transporter 1 in hepatic and intestinal distribution of metformin. J Pharmacol Exp Ther. 2002;302:510–515. doi: 10.1124/jpet.102.034140. [DOI] [PubMed] [Google Scholar]
- Watt MJ, Holmes AG, Pinnamaneni SK, Garnham AP, Steinberg GR, Kemp BE, et al. Regulation of HSL serine phosphorylation in skeletal muscle and adipose tissue. Am J Physiol Endocrinol Metab. 2006;290:E500–E508. doi: 10.1152/ajpendo.00361.2005. [DOI] [PubMed] [Google Scholar]
- Weitzel G, Renner R, Guglielmi H. Stoffwechseleffekte von Argininderivativen, I. Insulinahnliche Aktivitat von Arginylverbindungen in vitro. Hoppe Seylers Z Physiol Chem. 1971;352:1617–1630. [PubMed] [Google Scholar]
- Weitzel G, Renner R, Guglielmi H. Stoffwechseleffekte von Argininderivativen, II. Antilipolytische Wirksamkeit von Arginylverbindungen. Hoppe Seylers Z Physiol Chem. 1972;353:535–539. [PubMed] [Google Scholar]
- Wieland O.Glycerol U.V. method Methods of enzymatic analysis 1974Academic Press: New York; 1404–1409.In: Burgmeyer HU (ed).vol 4. [Google Scholar]
- Winder WW, Wilson HA, Hardie DG, Rasmussen BB, Hutber CA, Call GB, et al. Phosphorylation of rat muscle acetyl-CoA carboxylase by AMP-activated protein kinase and cAMP-dependent protein kinase. J App Physiol. 1997;82:219–225. doi: 10.1152/jappl.1997.82.1.219. [DOI] [PubMed] [Google Scholar]
- Yacoub Wasef SZ, Robinson KA, Berkaw MN, Buse MG. Glucose, dexamethasone, and the unfolded protein response regulate TRB3 mRNA expression in 3T3-L1 adipocytes and L6 myotubes. Am J Physiol Endocrinol Metab. 2006;291:E1274–E1280. doi: 10.1152/ajpendo.00117.2006. [DOI] [PubMed] [Google Scholar]
- Yamaguchi S, Katahira H, Ozawa S, Nakamichi Y, Tanaka T, Shimoyama T, et al. Activators of AMP-activated protein kinase enhance GLUT4 translocation and its glucose transport activity in 3T3-L1 adipocytes. Am J Physiol Endocrinol Metab. 2005;289:E643–E649. doi: 10.1152/ajpendo.00456.2004. [DOI] [PubMed] [Google Scholar]
- Zhang B, Schmoyer D, Kirov S, Snoddy J. GOTree Machine (GOTM): a web-based platform for interpreting sets of interesting genes using Gene Ontology hierarchies. BMC Bioinformatics. 2004;5:16. doi: 10.1186/1471-2105-5-16. [DOI] [PMC free article] [PubMed] [Google Scholar]
- Zhou G, Myers R, Li Y, Chen Y, Shen X, Fenyk-Melody J, et al. Role of AMP-activated protein kinase in mechanism of metformin action. J Clin Invest. 2001;108:1167–1174. doi: 10.1172/JCI13505. [DOI] [PMC free article] [PubMed] [Google Scholar]
- Zong H, Ren JM, Young LH, Pypaert M, Mu J, Birnbaum MJ, et al. AMP kinase is required for mitochondrial biogenesis in skeletal muscle in response to chronic energy deprivation. Proc Natl Acad Sci USA. 2002;99:15983–15987. doi: 10.1073/pnas.252625599. [DOI] [PMC free article] [PubMed] [Google Scholar]


