Abstract
Functional MRI revealed differences between children with Attention Deficit Hyperactivity Disorder (ADHD) and healthy controls in their frontal–striatal function and its modulation by methylphenidate during response inhibition. Children performed two go/no-go tasks with and without drug. ADHD children had impaired inhibitory control on both tasks. Off-drug frontal–striatal activation during response inhibition differed between ADHD and healthy children: ADHD children had greater frontal activation on one task and reduced striatal activation on the other task. Drug effects differed between ADHD and healthy children: The drug improved response inhibition in both groups on one task and only in ADHD children on the other task. The drug modulated brain activation during response inhibition on only one task: It increased frontal activation to an equal extent in both groups. In contrast, it increased striatal activation in ADHD children but reduced it in healthy children. These results suggest that ADHD is characterized by atypical frontal–striatal function and that methylphenidate affects striatal activation differently in ADHD than in healthy children.
Attention Deficit Hyperactivity Disorder (ADHD) is the most common developmental disorder of childhood, affecting 3%–7% of children and often continuing into adulthood (1). It is characterized by developmentally inappropriate symptoms of inattention, impulsivity, and hyperactivity that impair function in the home and school. The long-term consequences of childhood ADHD include lower educational and vocational outcomes and increased risk for antisocial disorders and drug abuse in adulthood (2). Current diagnostic criteria rest exclusively on history of behaviors reflecting these symptoms (e.g., “fidgets with hands and feet”) (3). At present, there is little understanding of the neurobiological basis of ADHD. Lack of such knowledge prevents the definition of biological criteria that can validate the ADHD diagnosis.
Several lines of evidence suggest that ADHD is characterized by dysfunction in dopaminergic transmission in the frontal lobes and in striatal (basal ganglia) structures. Functional imaging [e.g., single photon emmission-computed tomography (SPECT), positron-emission tomography (PET)] studies report reduced metabolism in frontal and striatal regions in ADHD (4–8). Structural MRI studies find reduced volumes in a number of brain regions in ADHD, including the frontal lobes and striatum (9–14). Dopaminergic dysfunction is suspected in ADHD because symptoms respond favorably, albeit temporarily, to stimulant medications (e.g., dextroamphetamine and methylphenidate) that release and inhibit reuptake of catecholamines, especially dopamine whose modulatory influence is pervasive in frontal–striatal regions. One PET study found abnormal dopaminergic presynaptic function in ADHD male adults (15). Methylphenidate (Ritalin), the most common treatment for ADHD, binds to dopamine transporter in in vitro and in vivo animal studies and is taken up primarily in the striatum in resting PET studies with healthy adults (16). Furthermore, genetic studies point to an association between ADHD and variability of the dopamine transporter and D4-receptor genes (17, 18). To date, however, there is no direct evidence for differences in dopaminergic modulation in ADHD and normal children.
The present investigation used functional MRI (fMRI) to address two key questions about ADHD: (i) Does frontal–striatal function differ in ADHD and control children? (ii) Does methylphenidate (MPH) modulate frontal–striatal function differently in ADHD and control children? fMRI visualizes changes in the hemodynamic properties of blood irrigating neuronal tissue that is engaged in the performance of a task (19). It is noninvasive and suitable for use with children.
We imaged the frontal lobes and two striatal structures, the head of caudate nucleus and anterior portion of the putamen, during response inhibition. Inhibition of prepotent motor responses is impaired in ADHD (20) and is known to depend on the integrity of both frontal and striatal structures (21, 22). Frontal–striatal activation during response inhibition was measured on two versions of a go/no-go task (23), each with and without administration of MPH. Two versions of the response inhibition task were used to control for response and stimulus characteristics of the go and no-go trial blocks. Go and no-go blocks were matched for the number of motor responses in the response-controlled version and for the number of stimuli in the stimulus-controlled version. For each task, MPH effects on frontal and striatal activation during response inhibition were compared within and between the ADHD and control groups.
MATERIALS AND METHODS
Subjects.
The ADHD group consisted of 10 males with a diagnosis of ADHD and the control group consisted of six healthy males matched for age, grade, and IQ, who did not have siblings with an ADHD diagnosis (Table 1). In addition, three healthy males with ADHD siblings were scanned but were excluded from primary data analyses.¶ All were right-handed, except for one control subject (no. 6). Inclusion criteria included (i) age, 8–13 years; (ii) ADHD diagnosis by a physician or psychologist based on both parent and teacher ratings of DSM-IV criteria (24): eight subjects met criteria for combined-type and two (nos. 1 and 7) met criteria for inattention-type ADHD‖; (iii) Tanner stage 1–3; (iv) normal medical examination and history. Exclusion criteria included (i) full scale Wechsler Intelligence Scale for Children-Revised (WISC-R) IQ below 85; (ii) history or evidence of neurological disorders or Axis 1 psychiatric disorders; (iii) Score more than eight on the diagnostic criteria for comorbid disorders on the clinical interview form for child and adolescent ADHD patients (25). Structured psychiatric interviews were not conducted. Control subjects, including ADHD siblings, met the same criteria except for the ADHD diagnosis. ADHD subjects received $80 and control subjects received $150 for participation in the study.
Table 1.
Subject characteristics, response inhibition performance, and direction of change in striatal activation (on the stimulus-controlled task) as a function of MPH
| Subject no. | Age | Dose, mg | WISC IQ
|
Striatal change
|
% Errors of commission by task
|
|||||
|---|---|---|---|---|---|---|---|---|---|---|
| Verb | Perf | Full | MPH | STIM-CON | RESP-CON | |||||
| Off | On | Off | On | |||||||
| ADHD | ||||||||||
| 1 | 13 | 20 | 123 | 108 | 117 | − | 67 | 61 | 25 | 22 |
| 2 | 12 | 20 | 117 | 102 | 110 | + | 14 | 3 | 42 | 3 |
| 3 | 11 | 20 | 126 | 126 | 128 | + | 64 | 42 | 50 | 42 |
| 4 | 10 | 30 | 117 | 121 | 121 | − | 33 | 8 | 19 | 6 |
| 5 | 10 | 15 | 117 | 115 | 117 | + | 36 | 22 | 68 | 11 |
| 6 | 10 | 10 | 104 | 117 | 111 | + | 11 | 17 | 11 | 8 |
| 7 | 10 | 7.5 | 118 | 112 | 116 | + | 6 | 17 | 0 | 11 |
| 8 | 10 | 10 | 113 | 106 | 110 | + | 44 | 25 | 14 | 8 |
| 9 | 11 | 20 | 134 | 127 | 133 | + | 39 | 39 | 17 | 25 |
| 10 | 8 | 10 | 138 | 131 | 137 | + | 33 | 42 | 25 | 17 |
| Mean | 10.5 | 121 | 117 | 120 | ||||||
| SD | 1.4 | 10.0 | 9.7 | 9.7 | ||||||
| Control | ||||||||||
| 1 | 10 | 10 | 110 | 107 | 109 | − | 19 | 6 | 22 | 3 |
| 2 | 9 | 10 | 151 | 117 | 138 | − | 17 | 22 | 11 | 14 |
| 3 | 12 | 10 | 125 | 111 | 121 | − | 6 | 0 | 8 | 6 |
| 4 | 8 | 10 | 131 | 125 | 130 | + | 8 | 0 | 0 | 0 |
| 5 | 9 | 10 | 125 | 131 | 124 | − | 28 | 17 | 17 | 17 |
| 6 | 8 | 10 | 125 | 113 | 122 | − | 19 | 3 | 0 | 11 |
| Mean | 9.3 | 128 | 118 | 124 | ||||||
| SD | 1.5 | 13.3 | 11.0 | 9.7 | ||||||
| ADHD siblings | ||||||||||
| 1 | 9 | 10 | 131 | 117 | 127 | + | 8 | 7 | 11 | 8 |
| 2 | 11 | 10 | 121 | 113 | 119 | − | 36 | 47 | 57 | 39 |
| 3 | 10 | 10 | 121 | 129 | 126 | + | 11 | 11 | 3 | 3 |
WISC, Wechsler Intelligence Scale for Children; MPH, on-MPH vs. off-MPH; +, increased activation; −, reduced activation; STIM-CON, stimulus-controlled go/no-go task; RESP-CON, response-controlled go/no-go task.
Task Procedure.
Each subject was scanned in two sessions, off-MPH and on-MPH, at least 1 week apart. The order of sessions was counterbalanced across subjects. For off-MPH scans, ADHD subjects went off medication for 36 hr before scanning. For on-MPH scans, ADHD subjects took their regularly prescribed dose (range 7.5–30 mg) and controls took 10 mg, 2.0–2.5 hr before scanning. Stimuli were generated by a Macintosh Quadra (Apple, Cupertino, CA) and back projected via a magnet-compatible projector onto a screen that could be viewed through a mirror mounted above the subject’s head. Subjects responded with an optical button held in their right hand were recorded by a computer.
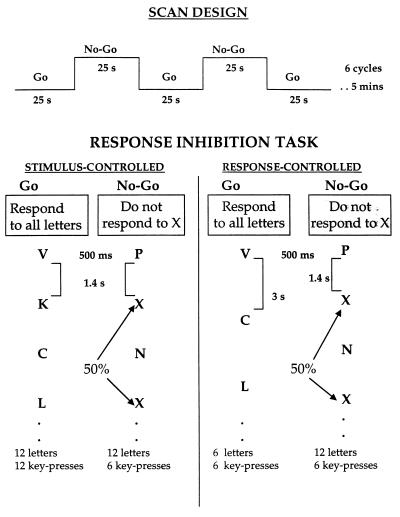
Subjects performed two versions of the go/no-go task, response-controlled and then stimulus-controlled (Fig. 1). Each task lasted for 5 min and consisted of six alternating go and no-go blocks, each 25 s long. Each block began with the presentation of the task instruction (“press for all letters” for go blocks and “do not press for X” for no-go blocks) followed by a consonant letter on each trial. For go blocks, subjects were to press a button for every letter. “X” was not presented and “C” occurred on 50% of the trials; no other letter repeated within each block. For no-go blocks, subjects were to press the button for every letter except “X”; “X” occurred on 50% of the trials and no other letter repeated within each block. In the response-controlled task, go and no-go blocks were equated in the number of key presses (6) but differed in the number of trials (six in go blocks; 12 in no-go blocks) and rate of stimulus presentation (exposure duration = 500 ms; inter-trial interval = 3 s for go blocks and 1.4 s for no-go blocks). In the stimulus-controlled task, go and no-go blocks were equated for the rate of presentation (exposure duration = 500 ms, inter-trial interval = 1.4 s) and number of trials (12) but differed in the number of key presses (12 in go blocks, six in no-go blocks).
Figure 1.
Characteristics of scan design and response inhibition tasks.
Imaging Procedure.
Imaging was performed on a 1.5 T whole-body scanner with a receive-only whole head coil for signal amplification. Head movement was minimized by using a bite-bar formed with each subject’s dental impression. Functional imaging was performed with a T2*-sensitive gradient echo spiral pulse sequence (26) with parameters of TR = 720 ms, TE = 40 ms, FOV = 36, flip angle = 69 degrees, in-plane resolution = 2.35 mm. Four interleaves were obtained for each image with a total acquisition time of 2.88 s/image slice; 104 images/slice were acquired continuously over a 300-s session. Slices were prescribed by a method for on-line registration of scanner-coordinates into standard coordinates (27) that enabled selection of the same slices in the two scanning sessions (28). In each scan, eight 6-mm thick slices were acquired in the coronal plane from 5–54 mm rostral to the anterior commissure; inter-slice space varied between subjects based on the normalization parameters (range 1.0–1.5 mm). T1-weighted flow compensated spin-echo anatomy images (TR = 500 ms; minimum TE) were acquired for each of the slices imaged in the functional scans.
Data Analysis.
Image reconstruction was performed off-line on a Sun SparcStation (Sun Microsystems, Menlo Park, CA). A gridding algorithm was used to resample the raw data into a Cartesian matrix before processing with 2-D fast Fourier transform. Functional images were motion-corrected by using air 2.0 (29). Functional activation was analyzed by correlating the time series for each pixel with a reference function representing the time of expected activation (based upon the timing of the relevant behavior, i. e., no-go blocks) and then normalized (30). The reference function was computed by convolving a square wave at the task frequency [task cycles (6)/total scan time (300 s) = 0.02 Hz] with a data-derived estimate of hemodynamic response function. Pixels satisfying the criterion of z > 1.96 (P < 0.025 one-tailed) were selected and overlaid on T1-weighted structural images of the same scan locations to construct functional activation maps for each task.
To specify the anatomic locus of activations, regions of interest (ROIs) were defined in each hemisphere for two structures in the striatum (head of the caudate, putamen) and five gyri in the frontal lobes (cingulate, superior, middle, inferior, orbital) based on the atlas by Duvernoy (31).** The percentage of pixels (active pixels/total pixels) × 100 significantly more active during no-go relative to go blocks were determined in each ROI; thus the dependent measure was the spatial extent of activation in each ROI. These data were submitted to repeated ANOVAs to examine group and drug effects separately for the two tasks. Significance level for all analyses was P < 0.05. Planned comparisons for effects of drug and group in interactions were performed using one-tailed t tests.
RESULTS
Behavioral Data.
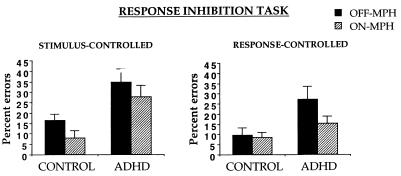
For each task, group X drug ANOVAs were performed on the percentage of errors of commission (i.e., button press to “X” in no-go blocks) (Fig. 2). For the stimulus-controlled task, the ADHD group made more errors than the control group (F(1, 14) = 5.8). Both groups improved with MPH (F(1, 14) = 7.0). For the response-controlled task, the ADHD group made more errors than the control group (F(1, 14) = 5.8) and both groups improved marginally with MPH (F(1, 14) = 3.2, P = 0.09). This marginal effect was due to a significant improvement in the ADHD group (t (9) = 1.8, P = 0.05) but not in the control group (t < 1). No group X drug interactions were significant. Accuracy in the go blocks was 100% in both groups; response times did not differ significantly by group or drug.
Figure 2.
Percentage of errors of commission during no-go blocks in control and ADHD children as a function of MPH.
fMRI Data.
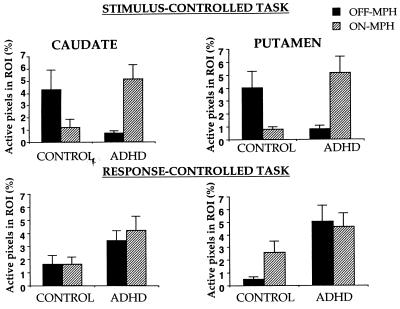
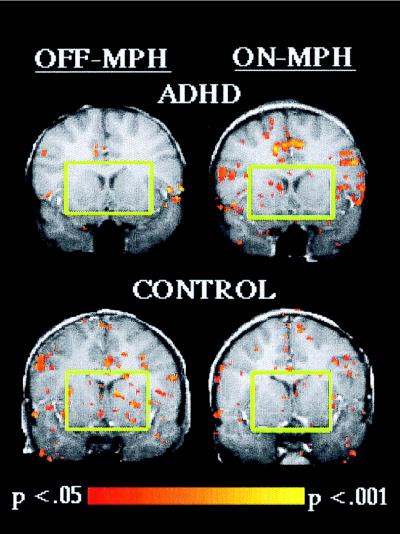
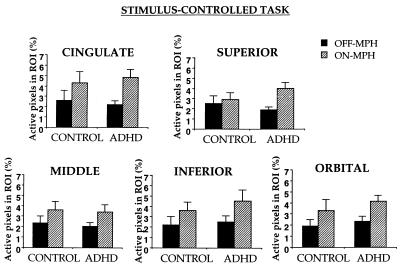
For each task, group X MPH X ROI X hemisphere ANOVAs were performed on the percentage of pixels active during response inhibition in striatal and frontal regions (Figs. 3–5). In the stimulus-controlled task, striatal activation showed a group X drug interaction, F(1, 14) = 9.7, P = 0.008 (Fig. 6). MPH increased striatal activation in ADHD subjects (t (9) = 2.7, P = 0.01) but decreased striatal activation in control subjects (t (5) = 2.1, P = 0.04). Further, without MPH, striatal activation was greater in control than ADHD subjects (t (14) = 2.5, P = 0.01), but with MPH, striatal activation tended to be greater in ADHD than control subjects (t (14) = 1.6, P = 0.06). Frontal activation increased with MPH in both groups (F(1, 14 = 7.0). No other effects were significant.
Figure 3.
Percentage of active pixels in the striatum in control and ADHD children during response inhibition as a function of MPH.
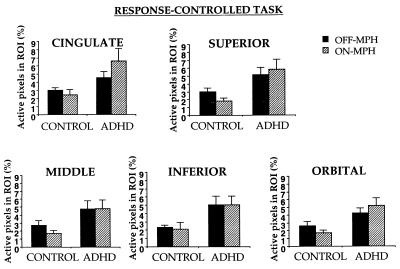
Figure 5.
Percentage of active pixels in frontal lobe gyri in control and ADHD children during response inhibition on the response-controlled go/no-go task as a function of MPH.
Figure 6.
Activation during response inhibition on the stimulus-controlled task in a coronal slice located 12 mm anterior to the anterior commissure for an ADHD and a control child. Green squares highlight the opposite effect of MPH in the head of the caudate and putamen in the ADHD and control child.
In the response-controlled task, no significant effects were obtained in the striatum; a marginal trend indicated that striatal activation was greater in ADHD than control subjects (F(1, 14) = 3.7, P = 0.08). Frontal activation was greater in ADHD than control subjects (F(1, 14) = 6.4). No other effects were significant.
DISCUSSION
ADHD children differed from controls in inhibitory performance, in frontal and striatal activation during response inhibition, and in striatal responses to MPH. Response inhibition was impaired in ADHD children on both go/no-go tasks. Baseline (off-MPH) frontal and striatal activation during response inhibition differed in ADHD and control groups: Frontal activation was greater in ADHD children on the response-controlled task, and striatal activation was reduced in ADHD children on the stimulus-controlled task. MPH had different effects in ADHD and control groups: MPH improved response inhibition in ADHD children on both tasks. In contrast, MPH improved response inhibition in control children only on the stimulus-controlled task. MPH affected activation only on the stimulus-controlled task in both groups. MPH increased frontal activation in both groups to an equal extent. MPH increased striatal activation in ADHD children but reduced it in control children.
Response inhibition invoked widespread activation bilateraly in the frontal cortex. The extent of frontal involvement may seem surprising, given the evidence for its medial-orbital-frontal locus in animal studies (32) and in imaging studies of obsessive compulsive disorder (33). Our findings, however, replicate those of a prior fMRI study with normal children and adults using the same task in a different scan design (23). The widespread activation suggests that response inhibition involves multiple frontal-lobe processes, perhaps including selection, online maintenance of stimuli in working memory, and switching attentional set (go and no-go trials).
Response inhibition invoked activation in both striatal structures, the head of the caudate and the putamen. Striatal involvement in motor control is more than one of simple execution of action, a finding that is supported by neuroimaging studies of motor skill learning and by response planning deficits found in patients with striatal disorders (34). Further, studies indicate that striatal structures act in concert with the frontal cortex to control voluntary action. Indeed, whenever MPH affected the striatum in the present study, it also affected the frontal lobes: Both regions were modulated on the stimulus-controlled task and neither region was modulated on the response-controlled task.
One question that motivated our study was whether baseline (off-MPH) frontal and striatal activation during inhibitory control differs in ADHD and control children. Indeed, ADHD children showed more frontal activation than controls on the response-controlled task. This finding appears to differ from past reports of hypometabolism of frontal regions in ADHD (4, 7, 8). Greater than normal frontal activation in ADHD children may reflect greater inhibitory effort. In the stimulus-controlled task, frontal activation did not differ in the two groups but striatal activation was reduced in ADHD subjects. Underactivation of the striatum in ADHD has been observed in functional imaging studies (5, 6). Furthermore, anatomical imaging studies of ADHD have reported associations between striatal abnormalities and poor inhibitory performance (14, 35). Inhibitory performance in the present study was below normal in ADHD subjects on both tasks. Thus, baseline activation in ADHD can be abnormally high (e.g., in the frontal lobes on the response-controlled task) or low (in the striatum on the stimulus-controlled task) depending on the specific demands of inhibitory control.
A second question that motivated our study was whether MPH modulates frontal–striatal activation during inhibitory control differently in ADHD and control children. MPH modulated frontal activation similarly in the two groups. It increased frontal activation to an equal extent on the stimulus-controlled task. The parallel improvement in inhibitory performance in both groups suggests that maintenance and selection processes were enhanced in the service of superior inhibitory control. MPH, however, did not affect activation in either group on the response-controlled task. Inhibitory performance on this task improved with MPH only in ADHD children. The absence of a drug effect on control children’s performance may have been due to their very low error rates in performance without MPH.
The diverse findings on the two tasks must be due to differences in trial parameters of the go blocks, because the no-go blocks were identical in the two tasks. The go blocks of the stimulus-controlled task had more trials presented at a faster rate than those of the response-controlled task. Therefore, the go blocks of the stimulus-controlled task may have created a more powerful disposition to respond to all stimuli. This more powerful response disposition may, in turn, have made response inhibition more difficult in the stimulus-controlled task. Perhaps, then, MPH had a more powerful effect on frontal–striatal function in the stimulus-controlled task because it enhanced inhibition of a more prepotent response. Similarly, studies of reasoning find that indirect dopaminergic agonists improve performance in healthy adults on more difficult tasks (e.g., Raven’s Progressive Matrices), but not on less difficult tasks (Wisconsin Card Sort) (36, 37). Thus, dopamine enhancement appears to most improve cognition and most affect frontal–striatal function when cognitive demands are greatest.
MPH modulated striatal activation during inhibitory control opposingly in ADHD and control subjects on the stimulus-controlled task. MPH increased striatal activation in ADHD children but decreased striatal activation in control children. This paradoxical influence of MPH on ADHD and control children’s striatal activation stands in sharp contrast to the parallel effects of MPH on improved behavior and enhanced frontal activation during inhibitory control. MPH-related increases in striatal activation have been reported in ADHD subjects in prior studies (5, 6). These findings may reflect differences in baseline dopamine activity because PET imaging of MPH-effects in resting healthy adults showed that changes in brain metabolism varied in individuals and brain regions as a function of dopamine receptor availability (38). The present findings, therefore, support the possibility that an important feature of ADHD is atypical dopaminergic modulation of the striatum.
These findings may be useful in the development of biologically valid criteria for ADHD. Our findings are in accord with past imaging studies that have noted abnormalities in frontal–striatal circuitry in ADHD. The diagnostic utility of those studies, however, has been limited either by risks associated with exposure to radioactive agents in the case of functional imaging [PET, single photon emission-computed tomography (SPECT)] or by the absence of a landmark lesion in the case of structural imaging. Furthermore, those techniques rely on averaged data whereas diagnostic tools need to be reliable in single subjects. In contrast, fMRI is well suited as a potential diagnostic tool because it is noninvasive and can reveal information at the level of individual subjects. Indeed, the characteristically opposite striatal response to MPH was apparent in eight of 10 ADHD and five of six controls (Table 1).
The etiology for ADHD is suspected to include a genetic component. There is a fivefold increase in risk to first degree relatives of ADHD subjects compared with that in the general population (39). The striatal response characteristic of the ADHD group in the present study also was observed in two of the three ADHD siblings (Table 1). These children did not meet behavioral criteria for ADHD, which suggests that brain abnormalities in ADHD may be necessary but are not sufficient for the manifestation of ADHD. Evidence of shared characteristics of dopaminergic transmission with affected siblings, however, lends biological support to findings of increased familial risk in ADHD. Indeed, studies have found associations with ADHD of specific variations in some dopaminergic genes (3). The consensus among researchers, however, is that the power to detect genetic variations in ADHD will be aided greatly by findings of biological markers for the disorder. fMRI in the present study suggests one biological marker for ADHD, atypical dopaminergic modulation. Combining functional imaging with genetic studies in the future ought to be fruitful.
Our findings yield novel information about dopaminergic modulation of inhibitory control in healthy children. First, similar to other nonspecific monoamine agonists such as dextroamphetamine (40), MPH benefited healthy children to the same extent as ADHD on one task. Second, drug-related modulation was region-specific and task-specific: Activation increased in frontal cortex but decreased in the striatum only on the stimulus-controlled task. Regional and task specificity in the effects of nonspecific monoamine agonists has been also observed in studies with healthy and disordered populations. In healthy adults, dextroamphetamine increased activation in the left inferior frontal gyrus but decreased it in the right hippocampus during Wisconsin Card Sort performance relative to a control task; the opposite pattern was observed during performance on Raven’s Progressive Matrices (36). In schizophrenic adults, dextroamphetamine increased activation selectively in the dorsolateral frontal cortex during Wisconsin Card Sort performance (41). The present study indicates that regional and task-specific modulation is evident in developing brains and is not unique to adults.
These findings, although promising, have some important limitations. First, although our results were consistent and statistically reliable, the sample sizes were small. Our findings should be regarded with caution until replicated in larger samples. Second, the ADHD subjects had a history of stimulant medication ranging from 1 to 3 years. Replication of this study in a newly diagnosed ADHD group would reveal whether the atypical striatal response to MPH occurs before chronic treatment. Third, we restricted our sample to males because rates of prevalence of ADHD differ by gender. Whether our findings will generalize to females is unknown. Fourth, the study was not placebo-controlled, and thus performance and activation in conditions that departed from children’s routines (off-drug for ADHD and on-drug for controls) could be unduly influenced by psychological factors such as anxieties and expectancies related to success or failure. This is unlikely, however, because MPH effects on performance were similar in the two groups but differed in specific brain regions. Furthermore, ADHD children’s performance on sustained attention tasks is unaffected by their beliefs of whether they received MPH or placebo (42). Fifth, our ADHD sample is not representative of the ADHD population. For example, the ADHD children had high IQs, albeit, matched to the control group. Further, severely hyperactive children could not be included in the study because motion artifacts prevent successful fMRI. Despite these limitations, our findings concur with current hypotheses about the neurobiology of ADHD and reveal that ADHD and normal children differ neurophysiologically in frontal–striatal brain regions important for inhibitory control and in the striatal response to MPH.
Figure 4.
Percentage of active pixels in frontal lobe gyri in control and ADHD children during response inhibition on the stimulus-controlled go/no-go task as a function of MPH.
Acknowledgments
We thank J. Chapman, A. Heberlen, J. Mack, B. Rypma, and E. Temple for help with data analysis, and F. Annis and P. Gioia for help with subject selection. This research was supported by a grant from the El Camino Hospital.
ABBREVIATIONS
- ADHD
Attention Deficit Hyperactivity Disorder
- fMRI
functional MRI
- MPH
methylphenidate
- ROI
regions of interest
- PET positron-emission tomography.
Footnotes
This was done to avoid genetic similarities between ADHD and control groups because studies suggest that ADHD is associated with genes regulating dopaminergic function and therefore are likely to be involved in responses to medication that affect dopamine activity, such as MPH.
We also characterized our sample in terms of the hyperactivity index on the Conners Teacher Rating Scale (43), because it often is used as a screening measure in the clinic. All but nos. 6, 7, and 8 (Table 1) of the ADHD group and none of the controls had T-scores of 2 SD above the population mean (mean 50, SD 10).
Since these ROIs had to be drawn manually, two raters came to a consensus about criteria for delineating ROIs based on the atlas by Duvernoy. The orbital frontal ROI included the lateral and anterior/posterior orbital gyri; medial orbital gyrus and gyrus rectus were not included to avoid inclusion of spurious activation induced by susceptibility artifacts resulting from signal dropoff in the nearby air-filled nasal cavity.
References
- 1.Barkley R A. Attention Deficit Hyperactivity Disorder: A Handbook For Diagnosis And Treatment. New York: Guilford Press; 1990. [Google Scholar]
- 2.Mannuzza S, Klein R G, Bessler A, Malloy P, Hynes M E. Am Acad Child Adolesc Psychiatry. 1997;36:1222–1227. doi: 10.1097/00004583-199709000-00014. [DOI] [PubMed] [Google Scholar]
- 3.Swanson J M, Sergeant J A, Taylor E, Sonuga-Barke E J S, Jensen P S, Cantwell D P. Lancet. 1998;351:429–433. [PubMed] [Google Scholar]
- 4.Amen D G, Carmichael B D. Ann Clin Psychiatry. 1997;9:81–86. doi: 10.1023/a:1026201218296. [DOI] [PubMed] [Google Scholar]
- 5.Lou H C, Henriksen L, Bruhn P. Arch Neurol. 1984;41:825–829. doi: 10.1001/archneur.1984.04050190031010. [DOI] [PubMed] [Google Scholar]
- 6.Lou H C, Henrikson L, Bruhn P, Berner H, Nielsen J B. Arch Neurol. 1989;46:48–52. doi: 10.1001/archneur.1989.00520370050018. [DOI] [PubMed] [Google Scholar]
- 7.Sieg K G, Gaffney G R, Preston D F, Hellings J A. Clin Nucl Med. 1995;20:55–60. doi: 10.1097/00003072-199501000-00014. [DOI] [PubMed] [Google Scholar]
- 8.Zametkin A J, Nordahl T E, Gross M, King A C, Semple W E, Rumsey J, Hamburger S, Cohen R M. N Engl J Med. 1990;323:1361–1366. doi: 10.1056/NEJM199011153232001. [DOI] [PubMed] [Google Scholar]
- 9.Aylward E H, Reiss A L, Reader M J, Singer H S, Brown J E, Denckla M B. J Child Neurol. 1996;11:112–115. doi: 10.1177/088307389601100210. [DOI] [PubMed] [Google Scholar]
- 10.Castellanos F X, Giedd J N, Eckburg P, Marsh W L, Vaituzis A C, Kaysen D, Hamburger S D, Rapoport J L. Am J Psychiatry. 1994;151:1791–1796. doi: 10.1176/ajp.151.12.1791. [DOI] [PubMed] [Google Scholar]
- 11.Castellanos F X, Giedd J N, Marsh W L, Hamburger S D, Vaituzis A C, Dickstein D P, Sarfatti S E, Vauss Y C, Snell J W, Lange N, et al. Arch Gen Psychiatry. 1996;53:607–616. doi: 10.1001/archpsyc.1996.01830070053009. [DOI] [PubMed] [Google Scholar]
- 12.Filipek P A, Semrud-Clikeman M, Steingard R J, Renshaw P F, Kennedy D N, Biederman J. Neurology. 1997;48:589–601. doi: 10.1212/wnl.48.3.589. [DOI] [PubMed] [Google Scholar]
- 13.Hynd G W, Hern K L, Novey E S, Eliopulos D, Marshall R, Gonzalez J J, Voeller K K. J Child Neurol. 1993;8:339–347. doi: 10.1177/088307389300800409. [DOI] [PubMed] [Google Scholar]
- 14.Mataro M, Garcia-Sanchez-C, Junque C, Estevez-Gonzalez A, Pujol J. Arch Neurol. 1997;54:963–968. doi: 10.1001/archneur.1997.00550200027006. [DOI] [PubMed] [Google Scholar]
- 15.Ernst M, Zametkin A J, Matochik J A, Jons P H, Cohen R M. J Neurosci. 1998;15:5901–5907. doi: 10.1523/JNEUROSCI.18-15-05901.1998. [DOI] [PMC free article] [PubMed] [Google Scholar]
- 16.Volkow N D, Fowler J S, Ding Y S, Wang G J, Gatley S J. Adv Pharmacol. 1998;42:211–214. doi: 10.1016/s1054-3589(08)60730-9. [DOI] [PubMed] [Google Scholar]
- 17.Gill M, Daly G, Heron S, Hawi Z, Fitzgerald M. Mol Psychiatry. 1997;2:311–313. doi: 10.1038/sj.mp.4000290. [DOI] [PubMed] [Google Scholar]
- 18.Swanson J M, Sunohara G A, Kennedy J L, Regino R, Fineberg E, Wigal T, Lerner M, Williams L, LaHoste G J, Wigal S. Mol Psychiatry. 1998;3:38–41. doi: 10.1038/sj.mp.4000354. [DOI] [PubMed] [Google Scholar]
- 19.Kwong K K, Belliveau J W, Chesler D A, Goldberg I E, Weisskoff R M, Poncelet B P, Kennedy D N, Hoppel B E, Cohen M S, Turner R, et al. Proc Natl Acad Sci USA. 1992;89:5675–5679. doi: 10.1073/pnas.89.12.5675. [DOI] [PMC free article] [PubMed] [Google Scholar]
- 20.Trommer B L, Hoeppner J B, Zecker S G. J Child Neurol. 1991;6:S128–S131. doi: 10.1177/0883073891006001s13. [DOI] [PubMed] [Google Scholar]
- 21.Godefroy O, Lhullier C, Rousseaux M. Brain. 1996;119:191–202. doi: 10.1093/brain/119.1.191. [DOI] [PubMed] [Google Scholar]
- 22.Leimkuhler M E, Mesulam M M. Ann Neurol. 1985;18:617–619. doi: 10.1002/ana.410180518. [DOI] [PubMed] [Google Scholar]
- 23.Casey B J, Trainor R J, Orendi J L, Schubert A B, Nystrom L E, Giedd J N, Castellanos F X, Haxby J V, Noll D C, Cohen J D, et al. J Cognit Neurosci. 1997;9:835–847. doi: 10.1162/jocn.1997.9.6.835. [DOI] [PubMed] [Google Scholar]
- 24.American Psychiatric Association. Diagnostic and Statistical Manual of Mental Disorders. 4th Ed. Washington, DC: Am. Psychiatr. Assoc.; 1994. [Google Scholar]
- 25.Barkeley R A. Attention-Deficit Hyperactivity Disorder: A Clinical Workbook. New York: Guilford; 1991. [Google Scholar]
- 26.Meyer C H, Hu B S, Nishimura D G, Macovski A. Magn Reson Med. 1992;28:202. doi: 10.1002/mrm.1910280204. [DOI] [PubMed] [Google Scholar]
- 27.Talairach J, Tourneaux P. Co-Planar Stereotaxic Atlas of the Human Brain. Stuttgart: Thieme; 1988. [Google Scholar]
- 28.Desmond J E, Lim K O. Hum Brain Mapp. 1997;5:58–73. doi: 10.1002/(SICI)1097-0193(1997)5:1<58::AID-HBM6>3.0.CO;2-M. [DOI] [PubMed] [Google Scholar]
- 29.Woods R P, Cherry S R, Mazziota J C. J Comput Assist Tomogr. 1992;16:620–633. doi: 10.1097/00004728-199207000-00024. [DOI] [PubMed] [Google Scholar]
- 30.Friston K J, Jezzard P, Turner R. Hum Brain Mapp. 1994;1:153–171. [Google Scholar]
- 31.Duvernoy H M. The Human Brain: Surface Three-Dimensional Section Anatomy and MRI. New York: Springer; 1991. [Google Scholar]
- 32.Iverson S D, Mishkin M. Exp Brain Res. 1970;11:376–386. doi: 10.1007/BF00237911. [DOI] [PubMed] [Google Scholar]
- 33.Swedo S E, Pietrini P, Leonard H L, Schapiro M B, Retew D C, Goldberger E L, Rapoport S I, Rapoport J L, Grady C L. Arch Gen Psychiatry. 1989;46:518–523. doi: 10.1001/archpsyc.1989.01810060038007. [DOI] [PubMed] [Google Scholar]
- 34.Doyon J. Int Rev Neurobiol. 1997;41:273–294. doi: 10.1016/s0074-7742(08)60356-6. [DOI] [PubMed] [Google Scholar]
- 35.Casey B J, Castellanos F X, Giedd J N, Marsh W L, Hamburger S D, Schubert A B, Vauss Y C, Vaituzis A C, Dickstein D P, Sarfatti S E, et al. J Am Acad Child Adolesc Psychiatry. 1997;36:374–383. doi: 10.1097/00004583-199703000-00016. [DOI] [PubMed] [Google Scholar]
- 36.Mattay V S, Berman K F, Ostrem J L, Esposito G, Van Horn J D, Bigelow L B, Weinberger D R. J Neurosci. 1996;16:4816–4822. doi: 10.1523/JNEUROSCI.16-15-04816.1996. [DOI] [PMC free article] [PubMed] [Google Scholar]
- 37.McDowell, S., Whyte, J. & D’Esposito, M. (1998) Brain, in press.
- 38.Volkow N D, Wang G J, Fowler J S, Logan J, Angrist B, Hitzemann R, Lieberman J, Pappas N. Am J Psychiatry. 1997;154:50–55. doi: 10.1176/ajp.154.1.50. [DOI] [PubMed] [Google Scholar]
- 39.Smalley S L. Am J Hum Genet. 1997;60:1276–1282. doi: 10.1086/515485. [DOI] [PMC free article] [PubMed] [Google Scholar]
- 40.Rapoport J L, Buchsbaum M S, Weingartner H, Zahn T P, Ludlow C, Mikkelsen E J. Arch Gen Psychiatry. 1980;37:933–943. doi: 10.1001/archpsyc.1980.01780210091010. [DOI] [PubMed] [Google Scholar]
- 41.Daniel D G, Weinberger D R, Jones D W, Zigun J R, Coppola R, Handel S, Bigelow L B, Goldberg T E, Berman K F, Kleinman J E. J Neuropsychiatry Clin Neurosci. 1991;1:377–384. [Google Scholar]
- 42.Pelham W E, Hoza B, Kipp H L, Gnagy E M, Trane S T. Exp Clin Psychopharmacol. 1997;5:3–13. doi: 10.1037/1064-1297.5.1.3. [DOI] [PubMed] [Google Scholar]
- 43.Conners C K. Conners Rating Scales: CPRS-39, CTRS-39. North Tonawanda, NY: Multi-Health Systems; 1989. [Google Scholar]


