Abstract
Drug metabolism can be affected by chronic renal failure (CRF). Although it is known that several drugs that are known to be acetylated accumulate in CRF, the effect of CRF on N-acetyltransferase (NAT), the enzyme responsible for this acetylation, is unknown. Herein is reported that protein and gene expression of both Nat isoforms in the liver was reduced by >30% and Nat2 activity was reduced by 50% in rats with CRF compared with control rats. Incubation of hepatocytes with serum from rats with CRF suggested that a circulating factor is responsible for the decrease in protein and gene expression. For testing the hypothesis that parathyroid hormone may be this factor, CRF was induced in parathyroidectomized rats; downregulation of Nat expression and activity was not observed in these rats. Furthermore, addition of parathyroid hormone to cultured hepatocytes induced a decrease in Nat2 protein and gene expression. In conclusion, liver acetylation of drugs in a rat model of CRF is reduced by a downregulation of Nat1 and Nat2 isoforms, secondary to decreased gene expression. Parathyroid hormone seems to be an important mediator of this phenomenon.
Reduction in renal function alters the disposition of many drugs mainly by decreasing the elimination of those excreted by the kidney1,2; however, drug metabolism by the liver may also be altered in patients with chronic renal failure (CRF).3 Indeed, several studies have shown that the metabolic clearance of various substrates is reduced in patients with CRF.1–10 Liver enzymes implicated in drug metabolism are classified in phase I (mainly oxidative reaction mediated by cytochrome P450) and phase II (conjugation reactions). Up to now, the studies on the repercussions of CRF on drug metabolism have been primarily focused on cytochrome P450. Indeed, several studies have demonstrated that CRF in rats was associated with a reduction in protein and gene expression as well as a significant decrease in the activity of several liver cytochrome P450 isoforms.11–16 Moreover, we recently reported that this decrease was secondary to uremic circulating factors, particularly parathyroid hormone (PTH).17
Phase II enzymes are also critical for the metabolism of drugs.18,19 These enzymes are responsible for the conjugation of drugs, and glucuronidation mediated by uridine diphosphate-glucuronosyl transferase (UGT) and acetylation mediated by N-acetyltransferases (NAT) are among the most important reactions.19 Interestingly, several human studies have reported a reduction in the liver metabolism of drugs that are cleared by glucuronidation or acetylation in patients with CRF, suggesting that CRF could impede these metabolic pathways.6–9 For instance, zidovudine and morphine (two glucuronidated molecules) have a significantly reduced metabolic clearance in CRF.20,21 Moreover, several drugs extensively acetylated (e.g., isoniazid, procainamide) also accumulate in patients with decreased renal function,2,22–24 suggesting a reduction in hepatic acetylation. Recently, Yu et al.25 showed that liver UGT was unchanged in a CRF rat model; however, no study has been done on the effect of CRF on hepatic acetylation in rat.
Human NAT are composed of two isoforms (NAT1 and NAT2), and both are involved in drug metabolism processes, although human NAT1 is also thought to have an endogenous role.26 These enzymes are expressed in the liver; they catalyze acetyl group transfer from acetyl-CoA to an aromatic or heterocyclic amine, hydrazine, hydrazide, or N-hydroxylamine acceptor substrate. NAT metabolize several drugs, such as sulfonamides and isoniazid.26 In the rat, similar to human, there are two isoforms (Nat1 and Nat2), although a third isoform (Nat3) with less metabolic activity was recently characterized.27
The objectives of this study were to determine the effects of CRF on hepatic NAT and to define the mechanisms leading to their downregulation. For this purpose, we measured in control and CRF rats (1) liver Nat1 and 2 protein and gene expression and (2) specific metabolic activity of Nat2. We also evaluated the effects of uremic serum on Nat1 and Nat2 expression by incubating normal rat hepatocytes with control or CRF sera. Finally, the implication of PTH (as a potential uremic factor) in the downregulation of rat Nat genes was also evaluated in vivo in parathyroidectomized rats and in vitro in rat hepatocytes incubated with PTH.
RESULTS
Biochemical Parameters and Body Weight in Control and CRF Rats
Table 1 presents the body weight and the biochemical parameters of the animals studied. As shown, body weights were similar in all groups. CRF rats had higher levels of plasma creatinine and a lower creatinine clearance reduced by 79% (P < 0.001) compared with control rats.
Table 1.
Physiologic characteristics of ratsa
| Characteristic | Control | CRF |
|---|---|---|
| Rats (n) | 38 | 39 |
| Final body weight (g) | 345.00 ± 6.00 | 303.00 ± 9.00 |
| Serum chemistry | ||
| creatinine (μmol/L) | 55.00 ± 1.00 | 230.00 ± 13.00b |
| urea (mmol/L) | 5.00 ± 0.20 | 50.00 ± 5.00b |
| calcium (mmol/L)c | 1.39 ± 0.03 | 1.28 ± 0.08 |
| phosphate (mmol/L) | 3.36 ± 0.10 | 3.78 ± 0.27 |
| Creatinine clearance (μl/100 g per min) | 337.00 ± 14.00 | 69.00 ± 7.00b |
Data are means ± SEM.
P < 0.01 versus control group.
Ionized calcium concentration corrected at pH 7.4.
Nat Isoforms in the Liver
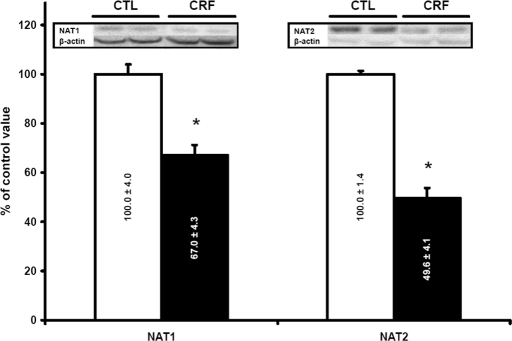
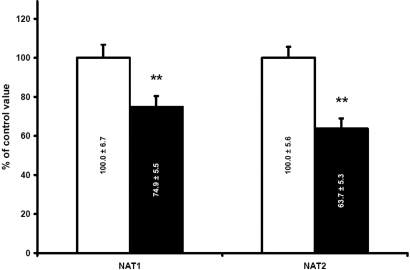
The levels of Nat1 and Nat2 in CRF rat (n = 10) liver were reduced by 33 and 50%, respectively, compared with control animals (P < 0.001; Figure 1). There was a significant negative correlation of Nat protein levels and creatinine clearance (r = 0.76, P < 0.001). To evaluate whether the downregulation of Nat in the liver of CRF rat was secondary to a decrease in the proteins synthesis, we evaluated mRNA encoding the different isoforms by multiplex quantitative PCR. This reveals a significant decrease in mRNA encoding Nat1 and Nat2 in CRF animals (n = 19) compared with controls (n = 16; Figure 2). Thus, the decrease in protein levels of the different Nat isoforms observed in CRF is secondary to reduced gene expression.
Figure 1.
Protein expression of liver Nat1 and 2 in control (CTL; □) and CRF (▪) rats. Control results were defined as 100%. Data are means ± SEM. Representative blots are shown in insert. *P < 0.001 versus CTL rats.
Figure 2.
Expression of liver Nat1 and 2 mRNA in CTL (□) and CRF (▪) rats. Control results were defined as 100%. Data are means ± SEM, **P < 0.01 versus CTL rats.
In Vitro Metabolism of p-Aminobenzoic Acid
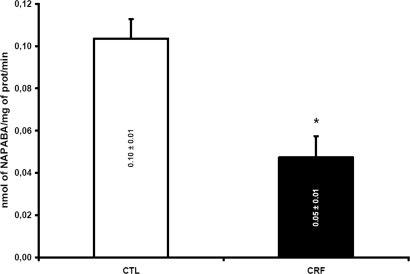
To determine the repercussion of CRF on the metabolism of drugs by Nat, we assessed the in vitro N-acetylation of p-aminobenzoic acid (PABA; Sigma-Aldrich, Oakville, ON, Canada) in liver cytosols. This enzymatic reaction was mediated primarily by the rat Nat2 isoform. The N-acetylation of PABA was decreased by 50% in rats with CRF (n = 8), compared with control animals (P < 0.001; n = 6; Figure 3).
Figure 3.
Nat2 metabolizing activity as measured by using PABA as specific substrate in CTL (□) and CRF (▪) rats liver. Results expressed by nmol of N-acetyl-PABA (NAPABA) produced per mg of protein per minute. Data are means ± SEM. *P < 0.001 versus CTL rats.
Effects of Uremic Serum on Nat Protein and mRNA Levels
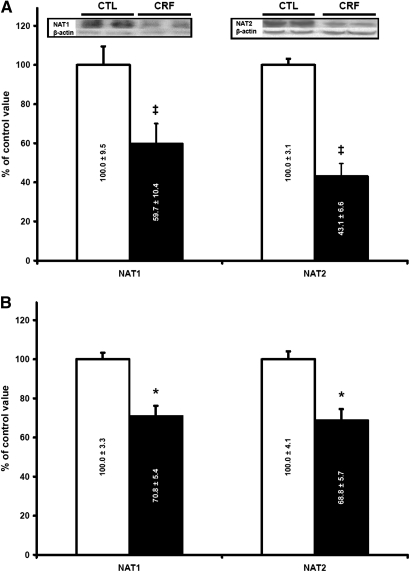
The objective of this experiment was to determine the effects of CRF serum on liver Nat. After 48 h of incubation of normal hepatocytes with serum (10%) from rats with CRF (n = 15), the amounts of Nat1 and 2 proteins were decreased by 40 and 57% (P < 0.005), respectively, compared with hepatocytes incubated with serum from control animals (n = 12; Figure 4A). The mRNA levels of Nat1 and Nat2 were both decreased by 30% (P < 0.005; Figure 4B). Thus, uremic serum contains mediators that downregulate Nat expression in normal hepatocytes.
Figure 4.
(A and B) Protein (A) and mRNA (B) expression of Nat1 and Nat2 in 48-h cultured hepatocytes incubated with CTL (□) and CRF (▪) rat serum (10%). Expression in hepatocytes incubated with CTL serum was defined as 100%. Representative blots are shown in insert. Data are means ± SEM. ‡P < 0.005 versus CTL rats; *P < 0.001 versus CTL rats.
Physical and Biochemical Characteristics of Rats with Parathyroidectomy
For clarification of the role of PTH in the downregulation of Nat genes, some CRF (n = 6) and control (n = 6) rats were surgically treated to remove parathyroid glands. Table 2 presents the body weight and the biochemical characteristics of the animals used in this experiment. Once again, no difference was observed between groups for body weights, whereas clearance and creatinine were significantly reduced in both CRF groups. There was a 40-fold increase in PTH in CRF rats, confirming the severity of secondary hyperparathyroidism in these animals. PTH was undetectable in rats with parathyroidectomy (PTX).
Table 2.
Physiologic characteristics of rats with PTXa
| Characteristic | Control | CRF | Control PTX | CRF PTX |
|---|---|---|---|---|
| Rats (n) | 6 | 6 | 6 | 6 |
| Final body weight (g) | 349.00 ± 21.00 | 291.00 ± 26.00 | 350.00 ± 16.00 | 310.00 ± 18.00 |
| Serum chemistry | ||||
| creatinine (μmol/L) | 58.00 ± 2.00 | 208.00 ± 38.00b | 53.00 ± 1.00 | 221.00 ± 54.00b |
| urea (mmol/L) | 5.00 ± 0.40 | 52.00 ± 14.00b | 4.50 ± 0.30 | 37.00 ± 9.00b |
| calcium (mmol/L)c | 1.44 ± 0.04 | 1.38 ± 0.05 | 1.23 ± 0.13 | 1.35 ± 0.11 |
| phosphate (mmol/L) | 3.14 ± 0.08 | 3.45 ± 0.12 | 4.01 ± 0.47 | 3.57 ± 0.32 |
| PTH (pg/ml) | 62.00 ± 18.00 | 2790.00 ± 825.00b | <20.00b | <20.00b |
| Creatinine clearance (μl/100 g per min) | 332.00 ± 30.00 | 100.00 ± 20.00b | 373.00 ± 14.00 | 76.00 ± 17.00b |
Data are means ± SEM.
P < 0.01 versus control group.
Ionized calcium concentration corrected at pH 7.4.
Role of PTH in the In Vivo Downregulation of Rat Nat1 and Nat2 Induced by CRF
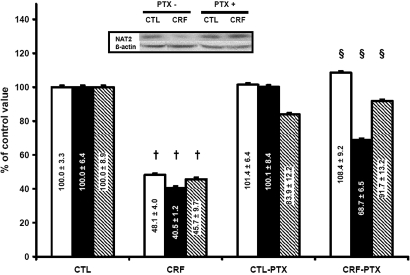
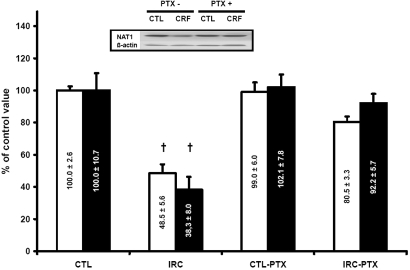
To determine whether PTH was implicated in the in vivo decrease of Nat by CRF, we evaluated the effects of PTX in CRF rats on Nat1 and 2 protein levels. As shown in Figure 5, preventing the development of secondary hyperparathyroidism by PTX prevents the negative effect of CRF on Nat2 protein and the Nat2 gene. We also observed a significant difference in Nat2 metabolic activity in CRF rats with PTX compared with CRF rats (Figure 5). Similar results were obtained for Nat1 (Figure 6).
Figure 5.
Expression of Nat2 protein (□), mRNA (▪) and activity (  ) in CTL and CRF rat liver with or without PTX. CTL rats were defined as 100%. Data are means ± SEM. Representative blots are shown in insert. †P < 0.05 versus control rats; §P < 0.05 versus CRF group.
Figure 6.
Expression of Nat1 protein (□) and mRNA (▪) in CTL and CRF rat liver with or without PTX. CTL rats were defined as 100%. Data are means ± SEM. Representative blots are shown in insert. †P < 0.05 versus CTL rats.
In Vitro Effect of PTH on Nat2 in Cultured Hepatocytes
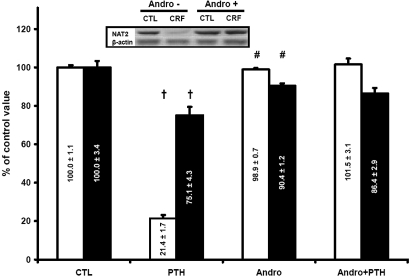
To confirm the implication of PTH in the downregulation of Nat2 in CRF, we incubated normal hepatocytes during 48 h with 10−9 M synthetic 1-34 rat PTH (n = 12). As shown on Table 2, this concentration of PTH is similar to the one observed in vivo in our CRF rats. The effects of PTH on the Nat2 protein and mRNA levels are shown on Figure 7. When hepatocytes where incubated with PTH, Nat2 protein and Nat2 mRNA levels were decreased by 80% (P < 0.01) and 25% (P < 0.01), respectively. There was no effect of PTH on other control hepatocyte proteins (glyceraldehyde 3-phosphate dehydrogenase, aspartate aminotransferase, or β-actin; data not shown).
Figure 7.
Protein (□) and mRNA (▪) expression of Nat2 in hepatocytes incubated for 48 h with 10−9 M PTH in 10% calf serum with or without 30 μM andrographolide (andro). Results of samples incubated with calf serum without PTH and andrographolide were defined as 100%. Data are means ± SEM. Representative blots are shown in insert. †P < 0.05 versus CTL group; #P < 0.05 versus PTH group.
Although PTH could act via several signaling pathways, we tested the hypothesis that the downregulation of Nat2 was through activation of NF-κB, as previously shown for CYP450.17 Addition of 30 μM andrographolide to hepatocytes cultured in the presence of 10−9 M PTH (n = 6) prevented the decrease in Nat2 gene expression induced by PTH with a subsequent effect on Nat2 protein level (Figure 7).
DISCUSSION
This study demonstrates that in the rat, CRF induces a marked decrease in liver protein levels of Nat1 and Nat2 isoforms, secondary to a reduction in the levels of mRNA encoding these proteins. The repercussions on the metabolism of drugs by the liver are important, because we observed a 50% reduction of PABA metabolism mediated by Nat2 isoform. The mechanism underlying the downregulation of Nat genes is the presence of endogenous inhibitors in the uremic blood, PTH being one of the major inhibitors.
Enzymatic reactions leading to drug biotransformation are classified in phase I and phase II reactions. Phase I reactions usually convert parent drugs to a more polar metabolite and are mediated by cytochrome P450. Parent drugs or their phase I metabolites could also undergo conjugation reactions with an endogenous substrate, such as glucuronic acid, acetic acid, or sulfuric acid, to yield drug conjugates. The two major phase II reactions implicated in drug metabolism are glucuronidation, mediated by UGT, and acetylation, mediated by Nat.
Renal failure has been generally thought mainly to decrease the renal clearance of drugs1,2; however, many studies have demonstrated that humans with CRF also present decreased hepatic drug metabolism.1–10 Because the cytochrome P450 is the major enzymatic system involved in drug biotransformation, most studies have focused on liver P450. The results of these studies showed that in CRF rats, liver total P450, several P450 isoforms,11–16,28 and enzymatic reactions normally carried by the liver P450 are significantly decreased.10 We also showed that both patients’ and rats’ uremic serum contain mediators that downregulate liver P450.29,30
Many drugs commonly used in clinical practice are metabolized by phase II enzymes. Several pharmacokinetics studies have revealed a decrease in glucuronidation or acetylation of drugs in patients with CRF, suggesting that not only P450 could be altered in CRF but also phase II enzymes. For instance, the metabolism of zidovudine and metoclopramide, which is primarily mediated by glucuronidation, is reduced in patients with renal failure.20,31,32 Acetylation also seems to be reduced in patients with CRF; several reports have demonstrated that the metabolic clearance of procainamide is reduced by approximately 60% in renal failure.2,23,24 Moreover, a decrease in the acetylation of isoniazid has been reported in patients with CRF.22
The mechanism leading to a decrease in phase II enzymatic reactions in CRF is unknown. Although many animal studies have been done on P450, very few have been performed on the effects of CRF on phase II enzymes. Paterson and Cohn14 studied the uridine diphosphate (UDP)-glucuronyl transferase activity in microsomes from control rats and rats with CRF and reported a 19% reduction in UDP-glucuronyl transferase activity, although this difference was NS (P = 0.06). More recently, Yu et al.25 did not confirm these results: They found no significant difference in liver UGT in CRF rats compared with control rats, although the number of animals was small (n = 4 per group) and the degree of renal failure was moderate. Taburet et al.,33 however, reported that incubation of microsomes, prepared from healthy human livers, with serum of patients with CRF was associated with a decrease in the metabolism of zidovudine, reflecting an inhibition of UDP-glucuronosyltransferase and suggesting that uremic mediators are responsible for the reduction in drug metabolism.
Our study is the first to evaluate the effects of CRF on acetylation of drugs. Our results demonstrate a significant decrease in both Nat1 and Nat2 with a major impact on their in vitro activity. Interestingly, we found a strong correlation between creatinine clearance and protein expression, suggesting that as renal function decreases, downregulation of Nat is more important. As shown for CYP450, the mechanism of protein downregulation is secondary to a reduced gene expression. These results could explain why the clearance of drugs cleared by acetylation is reduced in patients with CRF.
Another hypothesis to explain decreased drug metabolism in CRF have been raised by Sun et al.,34,35 who demonstrated that hepatic uptake of erythromycin (a CYP450 substrate) by hepatocytes incubated with uremic toxins was decreased. Because uptake by hepatic transporters (e.g., organic anion transporter protein) is the first step in the elimination of several drugs, making it available for metabolizing enzymes, a decrease in organic anion transporter protein as shown in hepatocytes incubated with uremic toxins and more recently in CRF rats could probably explain in part the decrease in drug metabolism induced by CRF.34–36 In this study, we found a decrease in Nat activity using cytosolic preparations that only reflect the metabolic activity and not the uptake or the efflux of drugs that could also be modulated in CRF.
In this study, we tested the hypothesis that uremic mediators were implicated in the decrease of NAT in CRF. The results clearly demonstrate that uremic serum contains mediators that are able to downregulate hepatic NAT. Interestingly, the results obtained with uremic serum also closely mimic what we showed in vivo in rats with CRF (Figures 1 and 4). Our results also demonstrate that there is an association between lower levels of Nat mRNA and the corresponding protein (Figure 4) in hepatocytes incubated with serum from rats with CRF. This suggests that gene expression is reduced by mediators present in uremic serum. Although the mechanisms responsible for the diminished hepatic gene expression in CRF are not known, this study suggests that uremic mediator(s) could affect NAT promoters.
CRF is often associated with secondary hyperparathyroidism. High levels of PTH have been linked to impaired protein synthesis, by reduced gene expression, in the liver, the skeletal muscle, and the cardiomyocytes.37–39 More recently, we also showed that PTH was an important factor implicated in the decreased of liver P450 in CRF.17 In this study, we tested the hypothesis that PTH could also be implicated in the decrease in liver acetylation. First, we evaluated whether PTX could prevent the downregulation of Nat genes. As shown in Figures 5 and 6, CRF rats with PTX have essentially the same level and metabolic activity of Nat as control rats, demonstrating that PTH is a major in vivo mediator of CRF-induced downregulation of Nat2. Moreover, our results demonstrate that PTH could decrease Nat2 gene expression and cause a corresponding reduction in Nat2 protein in normal hepatocytes (Figure 7).
Our results emphasize the deleterious effects of PTH on protein synthesis by the liver. The signaling pathway through which this occur remains poorly described. PTH could act by an increase in cAMP or intracellular calcium.40,41 More recently, we suggested that PTH could also act by activation of NF-κB to downregulate liver CYP450.17 In this study, we also demonstrated that inhibiting the activation of NF-κB prevents the decrease of Nat activity induced by PTH in culture hepatocytes. Further studies are needed to elucidate the effect of PTH on NAT and to investigate further the possible role of transcription factors including NF-κB.
In conclusion, this study demonstrated that CRF induces a decrease in rat Nat1 and Nat2 protein secondary to a decrease in gene expression. We also found a major reduction of Nat2 activity, which could explain the decrease in drug acetylation observed in patients with CRF. As shown for other major liver enzymes, the results of this study emphasize that uremic serum contains mediators that downregulate hepatic protein synthesis. PTH seems to be a major culprit in hepatocellular dysfunction in CRF.
CONCISE METHODS
Experimental Model
Male Sprague-Dawley rats (Charles River, Saint-Charles, PQ, Canada) that weighed 200 to 300 g were housed in the Research Center animal care facility and maintained on Harlan Teklad rodent diet (Harlan Teklad Global Diets, Montreal, PQ, Canada) and water ad libitum. All of the experiments were conducted according to the Canadian Council on Animal Care guidelines for care and use of laboratory animals and under the supervision of our local animal care committee.
CRF was induced by two-stage five-sixths nephrectomy as previously reported.15 Control rats were pair-fed the same quantity of rat chow that was ingested by the rats with CRF on the previous day. At day 41 after the nephrectomy, the rats were housed in metabolic cages and urine was collected for 24 h to determine the clearance of creatinine. Rats were killed by decapitation at 42 d after nephrectomy. Blood and tissues were stored at −80°C up to analysis.
Total PTX was performed, as described previously,17,37 7 d before the first nephrectomy. For avoidance of hypocalcemia, rats were then supplemented in calcium by addition of calcium gluconate to drinking water (control 2.5%; CRF 5%). Control rats received sham surgery in the neck region.
Primary Hepatocyte Culture
Hepatocytes were isolated from normal rats according to the modified two-step liver perfusion method of Seglen as previously published.29 Collagenase type 4 (Worthington, Lakewood, NJ) was used. Isolated hepatocytes were plated and cultured in 2 ml of William E medium containing 10% of serum from rats with CRF or from control animals. The serum of one rat was used for one experiment. Hepatocytes were incubated during 48 h and were then harvested by scraping. Samples were stored at −80°C up to analysis.
To assess whether liver Nat2 could be downregulated by PTH, we measured the ability of rat synthetic 1-34 PTH (Sigma-Aldrich) to depress the Nat of normal hepatocytes. The concentration of PTH used was 10−9 M. Incubation time was 48 h (medium was changed completely after 24 h to maintain PTH concentration). To determine whether NF-κB pathway could be involved in the effect of PTH on Nat2, we blocked this pathway using andrographolide (Calbiochem, San Diego, CA), a widely known NF-κB inhibitor.42
Liver Cytosol Preparation
Cytosols were prepared according to the method of Schneck et al.43 with slight modifications.
Western Blot Analysis
Nat1 and Nat2 were assessed by Western blotting according to a previously published procedure.44,45 Rat Nat2 was detected using a specific polyclonal rabbit antiserum, raised against the C-terminal dodecapeptide common to human NAT1 and mouse and rat Nat2 as described previously.46 β-Actin was detected using a mouse anti-chicken β-actin (Neo-Markers, Fremont, CA). Immune complexes were revealed by peroxidase-conjugated AffiniPure Goat Anti-Rabbit IgG (Jackson ImmunoResearch Laboratories, West Grove, PA) and goat anti-mouse IgG coupled to peroxidase (Sigma-Aldrich), respectively.
Rat Nat1 was detected using rabbit anti-rat antibodies recognizing both Nat1 and 2. For achievement of a specific quantification of rat Nat1, the Nat2 isoform is immunoprecipitated before SDS-gel electrophoresis. Cytosols were diluted 1:1 with IP buffer pH 7.4 (300 mM NaCl, 20 mM Tris, 2 mM EDTA, 2 mM EGTA [pH 8], and 0.1% Tween 20) to which Complete miniprotease inhibitor cocktail (Roche) was added. Diluted cytosols were incubated with the same amount of prewashed Protein A Sepharose (GE Healthcare Bio-Sciences, Baie d'Urfé, PQ, Canada) for 10 min at 4°C and then centrifuged for 1 min to pellet the beads. The supernatant was subsequently incubated with anti-Nat2 for 2 h at 4°C. Fresh Protein A Sepharose CL-4B was added to the samples, and incubation was continued overnight at 4°C. Sepharose beads were removed by centrifugation, and supernatants were frozen up to analysis of rat Nat1 by Western blot.
RNA Isolation and Real-Time Quantitative PCR Analysis
Total RNA were extracted from liver and hepatocytes by using the RNeasy Midi and Mini Kit (Qiagen, Mississauga, ON, Canada), respectively. Specific primer and probe sets for rat Nat1 and 247 and for glyceraldehydes-3-phosphate dehydrogenase48 were used for quantitative PCR analysis. Resulting data were processed by the delta Ct method.49
Evaluation of Nat2 Activity
The metabolic activity of rat Nat2 in either treated hepatocytes or cytosolic liver preparation of the different groups of rats was determined on the basis of the method described by Andres et al.,50 which has been modified by Mattano and Weber.51 The method measures the production of N-acetyl-PABA while samples are incubated with PABA. Controls and samples were run in triplicate.
Evaluation of Rat PTH
PTH was measured by using the Rat intact PTH ELISA Kit (Alpco Diagnostics, Salem, NH), which measures the intact 1-84 PTH. The lowest detectable level is 1.6 pg/ml.
Statistical Analysis
The results are expressed as means ± SEM. Differences between groups were assessed by using either unpaired t test or an ANOVA test followed by Scheffe post hoc comparison. The threshold of significance was P < 0.05.
DISCLOSURES
None.
Acknowledgments
This work was supported by the Canadian Institute of Health Research and Fonds de la Recherche en Santé du Québec. V.P. is a scholar of the Fonds de la Recherche en Santé du Québec. Edith Sim thanks the Wellcome Trust for financial support.
Part of this work was presented at the 14th annual meeting of the North American International Society for the Study of Xenobiotics; October 22 to 26, 2006; Rio Grande, Puerto Rico.
Published online ahead of print. Publication date available at www.jasn.org.
REFERENCES
- 1.Matzke GR, Frye RF: Drug administration in patients with renal insufficiency: Minimising renal and extrarenal toxicity. Drug Saf 16: 205–231, 1997 [DOI] [PubMed] [Google Scholar]
- 2.Lam YW, Banerji S, Hatfield C, Talbert RL: Principles of drug administration in renal insufficiency. Clin Pharmacokinet 32: 30–57, 1997 [DOI] [PubMed] [Google Scholar]
- 3.Touchette MA, Slaughter RL: The effect of renal failure on hepatic drug clearance. DICP 25: 1214–1224, 1991 [DOI] [PubMed] [Google Scholar]
- 4.Talbert RL: Drug dosing in renal insufficiency. J Clin Pharmacol 34: 99–110, 1994 [DOI] [PubMed] [Google Scholar]
- 5.Cantu TG, Ellerbeck EF, Yun SW, Castine SD, Kornhauser DM: Drug prescribing for patients with changing renal function. Am J Hosp Pharm 49: 2944–2948, 1992 [PubMed] [Google Scholar]
- 6.Pichette V, Leblond F: Metabolism of drugs in chronic renal failure. Recent Res Dev Drug Metab Dispos 1: 43–56, 2002 [PubMed] [Google Scholar]
- 7.Pichette V, Leblond FA: Drug metabolism in chronic renal failure. Curr Drug Metab 4: 91–103, 2003 [DOI] [PubMed] [Google Scholar]
- 8.Nolin TD, Frye RF, Matzke GR: Hepatic drug metabolism and transport in patients with kidney disease. Am J Kidney Dis 42: 906–925, 2003 [DOI] [PubMed] [Google Scholar]
- 9.Dreisbach AW, Lertora JJ: The effect of chronic renal failure on hepatic drug metabolism and drug disposition. Semin Dial 16: 45–50, 2003 [DOI] [PubMed] [Google Scholar]
- 10.Gibson TP: Renal disease and drug metabolism: An overview. Am J Kidney Dis 8: 7–17, 1986 [DOI] [PubMed] [Google Scholar]
- 11.Leber HW, Gleumes L, Schutterle G: Enzyme induction in the uremic liver. Kidney Int Suppl S43–S48, 1978 [PubMed]
- 12.Leber HW, Schutterle G: Oxidative drug metabolism in liver microsomes from uremic rats. Kidney Int 2: 152–158, 1972 [DOI] [PubMed] [Google Scholar]
- 13.Uchida N, Kurata N, Shimada K, Nishimura Y, Yasuda K, Hashimoto M, Uchida E, Yasuhara H: Changes of hepatic microsomal oxidative drug metabolizing enzymes in chronic renal failure (CRF) rats by partial nephrectomy. Jpn J Pharmacol 68: 431–439, 1995 [DOI] [PubMed] [Google Scholar]
- 14.Patterson SE, Cohn VH: Hepatic drug metabolism in rats with experimental chronic renal failure. Biochem Pharmacol 33: 711–716, 1984 [DOI] [PubMed] [Google Scholar]
- 15.Leblond F, Guevin C, Demers C, Pellerin I, Gascon-Barre M, Pichette V: Downregulation of hepatic cytochrome P450 in chronic renal failure. J Am Soc Nephrol 12: 326–332, 2001 [DOI] [PubMed] [Google Scholar]
- 16.Leblond FA, Giroux L, Villeneuve JP, Pichette V: Decreased in vivo metabolism of drugs in chronic renal failure. Drug Metab Dispos 28: 1317–1320, 2000 [PubMed] [Google Scholar]
- 17.Michaud J, Naud J, Chouinard J, Desy F, Leblond FA, Desbiens K, Bonnardeaux A, Pichette V: Role of parathyroid hormone in the downregulation of liver cytochrome P450 in chronic renal failure. J Am Soc Nephrol 17: 3041–3048, 2006 [DOI] [PubMed] [Google Scholar]
- 18.Boukouvala S, Fakis G: Arylamine N-acetyltransferases: What we learn from genes and genomes. Drug Metab Rev 37: 511–564, 2005 [DOI] [PubMed] [Google Scholar]
- 19.Klaassen CD: Cassarett and Doull's Toxicology: The Basic Science of Poisons, 6th Ed., New York, McGraw-Hill Professional Publishing, 2001
- 20.Singlas E, Pioger JC, Taburet AM, Colin JN, Fillastre JP: Zidovudine disposition in patients with severe renal impairment: influence of hemodialysis. Clin Pharmacol Ther 46: 190–197, 1989 [DOI] [PubMed] [Google Scholar]
- 21.Osborne R, Joel S, Grebenik K, Trew D, Slevin M: The pharmacokinetics of morphine and morphine glucuronides in kidney failure. Clin Pharmacol Ther 54: 158–167, 1993 [DOI] [PubMed] [Google Scholar]
- 22.Kim YG, Shin JG, Shin SG, Jang IJ, Kim S, Lee JS, Han JS, Cha YN: Decreased acetylation of isoniazid in chronic renal failure. Clin Pharmacol Ther 54: 612–620, 1993 [DOI] [PubMed] [Google Scholar]
- 23.Karlsson E: Clinical pharmacokinetics of procainamide. Clin Pharmacokinet 3: 97–107, 1978 [DOI] [PubMed] [Google Scholar]
- 24.du Souich P, Erill S: Metabolism of procainamide in patients with chronic heart failure, chronic respiratory failure and chronic renal failure. Eur J Clin Pharmacol 14: 21–27, 1978 [DOI] [PubMed] [Google Scholar]
- 25.Yu C, Ritter JK, Krieg RJ, Rege B, Karnes TH, Sarkar MA: Effect of chronic renal insufficiency on hepatic and renal udp-glucuronyltransferases in rats. Drug Metab Dispos 34: 621–627, 2006 [DOI] [PubMed] [Google Scholar]
- 26.Sim E, Westwood I, Fullam E: Arylamine N-acetyltransferases. Expert Opin Drug Metab Toxicol 3: 169–184, 2007 [DOI] [PubMed] [Google Scholar]
- 27.Walraven JM, Doll MA, Hein DW: Identification and characterization of functional rat arylamine N-acetyltransferase 3: Comparisons with rat arylamine N-acetyltransferases 1 and 2. J Pharmacol Exp Ther 319: 369–375, 2006 [DOI] [PubMed] [Google Scholar]
- 28.Van Peer AP, Belpaire FM: Hepatic oxidative drug metabolism in rats with experimental renal failure. Arch Int Pharmacodyn Ther 228: 180–183, 1977 [PubMed] [Google Scholar]
- 29.Guevin C, Michaud J, Naud J, Leblond FA, Pichette V: Down-regulation of hepatic cytochrome P450 in chronic renal failure: role of uremic mediators. Br J Pharmacol 137: 1039–1046, 2002 [DOI] [PMC free article] [PubMed] [Google Scholar]
- 30.Michaud J, Dubé P, Naud J, Leblond FA, Desbiens K, Bonnardeaux A, Pichette V: Effects of serum from patients with chronic renal failure on rat hepatic cytochrome P450. Br J Pharmacol 144: 1067–1077, 2005 [DOI] [PMC free article] [PubMed] [Google Scholar]
- 31.Lehmann CR, Heironimus JD, Collins CB, O'Neil TJ, Pierson WP, Crowe JT, Melikian AP, Wright GJ: Metoclopramide kinetics in patients with impaired renal function and clearance by hemodialysis. Clin Pharmacol Ther 37: 284–289, 1985 [DOI] [PubMed] [Google Scholar]
- 32.Bateman DN, Gokal R, Dodd TR, Blain PG: The pharmacokinetics of single doses of metoclopramide in renal failure. Eur J Clin Pharmacol 19: 437–441, 1981 [DOI] [PubMed] [Google Scholar]
- 33.Taburet AM, Vincent I, Perello L, Coret B, Baune B, Furlan V: Impairment of drug biotransformation in renal disease an in vitro model. Am Soc Clin Pharmacol Ther 59: 136, 1996 [Google Scholar]
- 34.Sun H, Huang Y, Frassetto L, Benet LZ: Effects of uremic toxins on hepatic uptake and metabolism of erythromycin. Drug Metab Dispos 32: 1239–1246, 2004 [DOI] [PubMed] [Google Scholar]
- 35.Sun H, Frassetto L, Benet LZ: Effects of renal failure on drug transport and metabolism. Pharmacol Ther 109: 1–11, 2006 [DOI] [PubMed] [Google Scholar]
- 36.Naud J, Michaud J, Boisvert C, Desbiens K, Leblond FA, Mitchell A, Jones C, Bonnardeaux A, Pichette V: Down-regulation of intestinal drug transporters in chronic renal failure in rats. J Pharmacol Exp Ther 320: 978–985, 2007 [DOI] [PubMed] [Google Scholar]
- 37.Klin M, Smogorzewski M, Ni Z, Zhang G, Massry SG: Abnormalities in hepatic lipase in chronic renal failure: role of excess parathyroid hormone. J Clin Invest 97: 2167–2173, 1996 [DOI] [PMC free article] [PubMed] [Google Scholar]
- 38.Qing DP, Ding H, Vadgama J, Wu YY, Kopple JD: Elevated myocardial cytosolic calcium impairs insulin-like growth factor-1-stimulated protein synthesis in chronic renal failure. J Am Soc Nephrol 10: 84–92, 1999 [DOI] [PubMed] [Google Scholar]
- 39.Ding H, Gao XL, Hirschberg R, Vadgama JV, Kopple JD: Impaired actions of insulin-like growth factor 1 on protein synthesis and degradation in skeletal muscle of rats with chronic renal failure: Evidence for a postreceptor defect. J Clin Invest 97: 1064–1075, 1996 [DOI] [PMC free article] [PubMed] [Google Scholar]
- 40.Swarthout JT, D'Alonzo RC, Selvamurugan N, Partridge NC: Parathyroid hormone-dependent signaling pathways regulating genes in bone cells. Gene 282: 1–17, 2002 [DOI] [PubMed] [Google Scholar]
- 41.Picotto G, Massheimer V, Boland R: Parathyroid hormone stimulates calcium influx and the cAMP messenger system in rat enterocytes. Am J Physiol 273: C1349–C1353, 1997 [DOI] [PubMed] [Google Scholar]
- 42.Munoz C, Pascual-Salcedo D, Castellanos MC, Alfranca A, Aragones J, Vara A, Redondo JM, de Landazuri MO: Pyrrolidine dithiocarbamate inhibits the production of interleukin-6, interleukin-8, and granulocyte-macrophage colony-stimulating factor by human endothelial cells in response to inflammatory mediators: Modulation of NF-kappa B and AP-1 transcription factors activity. Blood 88: 3482–3490, 1996 [PubMed] [Google Scholar]
- 43.Schneck DW, Sprouse JS, Hayes AH Jr, Shiroff RA: The effect of hydralazine and other drugs on the kinetics of procainamide acetylation by rat liver and kidney N-acetyltransferase. J Pharmacol Exp Ther 204: 212–218, 1978 [PubMed] [Google Scholar]
- 44.Laemmli UK: Cleavage of structural proteins during the assembly of the head of bacteriophage T4. Nature 227: 680–685, 1970 [DOI] [PubMed] [Google Scholar]
- 45.Towbin H, Staehlin T, Gordon J: Electrophoretic transfer of proteins from polyacrylamide gels to nitrocellose sheets. Proc Natl Acad Sci U S A 76: 4350–4354, 1979 [DOI] [PMC free article] [PubMed] [Google Scholar]
- 46.Stanley LA, Coroneos E, Cuff R, Hickman D, Ward A, Sim E: Immunochemical detection of arylamine N-acetyltransferase in normal and neoplastic bladder. J Histochem Cytochem 44: 1059–1067, 1996 [DOI] [PubMed] [Google Scholar]
- 47.Takeshita F, Ogawa K, Asamoto M, Shirai T: Mechanistic approach of contrasting modifying effects of caffeine on carcinogenesis in the rat colon and mammary gland induced with 2-amino-1-methyl-6-phenylimidazo[4,5-b]pyridine. Cancer Lett 194: 25–35, 2003 [DOI] [PubMed] [Google Scholar]
- 48.Kobayashi K, Utsumi H, Okada M, Sakairi T, Ikeda I, Kusakabe M, Takagi S: One-step RT-PCR without initial RNA isolation step for laser-microdissected tissue sample. J Vet Med Sci 65: 917–919, 2003 [DOI] [PubMed] [Google Scholar]
- 49.Livak KJ, Schmittgen TD: Analysis of relative gene expression data using real-time quantitative PCR and the 2(-Delta Delta C(T)) Method. Methods 25: 402–408, 2001 [DOI] [PubMed] [Google Scholar]
- 50.Andres HH, Klem AJ, Szabo SM, Weber WW: New spectrophotometric and radiochemical assays for acetyl-CoA: Arylamine N-acetyltransferase applicable to a variety of arylamines. Anal Biochem 145: 367–375, 1985 [DOI] [PubMed] [Google Scholar]
- 51.Mattano SS, Weber WW: Kinetics of arylamine N-acetyltransferase in tissues from rapid and slow acetylator mice. Carcinogenesis 8: 133–137, 1987 [DOI] [PubMed] [Google Scholar]


