Abstract
Acute renal failure (ARF) sensitizes the kidney to endotoxin (LPS)-driven production of cytokines and chemokines. This study assessed whether this LPS hyperresponsiveness exists at the genomic level. Three heterogeneous mouse models of ARF were studied: Maleate nephrotoxicity, unilateral ureteral obstruction, and LPS preconditioning. In all cases, LPS was injected approximately 18 h after injury was induced, and over the next 0 to 90 min, RNA polymerase II recruitment to the genome at three LPS-responsive genes (TNF-α, monocyte chemoattractant-1 [MCP-1], and heme oxygenase-1 [HO-1]) was assessed by chromatin immunoprecipitation. LPS hyperresponsiveness was noted in each model, measured by exaggerated increases in TNF-α and MCP-1 mRNA (approximately two to 10 times higher than LPS-injected controls). Corresponding increases in the recruitment of RNA polymerase II to the TNF-α and MCP-1 genes were observed, and increased trimethylation of histone 3 lysine 4 (H3K4m3) at these sites may have played a role in this recruitment. Conversely, recruitment of RNA polymerase II to the HO-1 gene was suppressed (“tolerance”), and no increase in H3K4m3 was observed at HO-1 exons. The ARF-induced changes in mRNA did not correlate with mRNA stability, suggesting the mechanistic importance of RNA polymerase II–mediated transcriptional events. In conclusion, LPS hyperresponsiveness after ARF is likely mediated at the genomic level, possibly by H3K4m3.
Recent observations from this laboratory suggested that a paradox exists in the setting of acute renal failure (ARF). On the one hand, acute tubular injury initiates adaptive changes that protect the kidney against subsequent ischemic or toxic damage (so-called “acquired cytoresistance”; e.g., references1–4). On the other hand, ARF can cause exaggerated renal tubular cytokine and chemokine production in response to superimposed stress (most notably, endotoxemia5–11). With renal venous efflux, elevated plasma concentrations of inflammatory mediators result,5–11 potentially contributing to extrarenal tissue damage and multiorgan failure.
To date, we have documented the following characteristics of the ARF-induced renal hyperinflammatory state5–11: (1) It is due to heightened renal tubular sensitivity to selected Toll receptor ligands (e.g., endotoxin, lipoteichoic acid); (2) it can be expressed despite normal baseline renal cytokine/chemokine levels; (3) Toll ligand hyperresponsiveness can develop despite reduced Toll receptor protein levels,11 suggesting that postreceptor events are involved; (4) diverse forms of acute renal injury can induce this hyperresponsive state, including ischemia-reperfusion,5 cisplatin nephrotoxicity,6 myohemoglobinuria,7 previous endotoxin exposure (i.e., “endotoxin preconditioning”8), or obstructive renal damage6; (5) overproduction of both proinflammatory (e.g., TNF-α, monocyte chemoattractant protein-1 [MCP-1], nitric oxide) and anti-inflammatory (e.g., IL-10) mediators can result; and (6) heightened cytokine and chemokine production is paralleled by increases in their respective renal cortical mRNA. However, it is not known whether enhanced transcription and/or stress-induced increases in mRNA stability12–17 account for these increased transcript levels.
This study was undertaken to gain new insights into this phenomenon. Toward this end, we assessed degrees of endotoxin (LPS)-driven renal cortical RNA polymerase II (Pol II) recruitment to three LPS responsive genes (TNF-α, MCP-1, and heme oxygenase-1 [HO-1]). The rationale for these assessments is that, together with mRNA levels, Pol II density at genomic site(s) reflects rates of gene transcription and serves as a surrogate marker of this process.18–20 Tissues from three very different models of acute renal injury were studied (previous endotoxin exposure, maleate-induced tubular injury, and ureteral obstruction) in an effort to assess potential broad-based biologic relevance. TNF-α, a proinflammatory cytokine, MCP-1, a proinflammatory chemokine, and HO-1, a cytoprotective stress protein, were selected for study to assess further the biologic scope. To ascertain degrees of mRNA stability, we isolated proximal tubules from kidneys subjected to these in vivo injury protocols and assessed degrees of in vitro mRNA degradation.
RESULTS
Renal LPS Responsiveness: Effects of “LPS Preconditioning”
Previous LPS exposure (“preconditioning”) is known to induce relative systemic resistance to a second LPS challenge (e.g., as denoted by suppressed cytokine/chemokine generation [i.e., “endotoxin tolerance”21–27]); however, we previously demonstrated that in kidney, LPS preconditioning (LPS-PC) causes a paradoxic increase in renal cytokine/chemokine production after a second LPS injection.8 For further characterization of this renal LPS hyperresponsive state, Pol II recruitment to selected LPS target genes was assessed and correlated with renal cortical mRNA levels and mRNA stability. Assessments were made in LPS-PC mice (approximately 18 h after LPS injection) and control mice either before or after (15, 30, and 90 min) an acute LPS challenge/rechallenge.
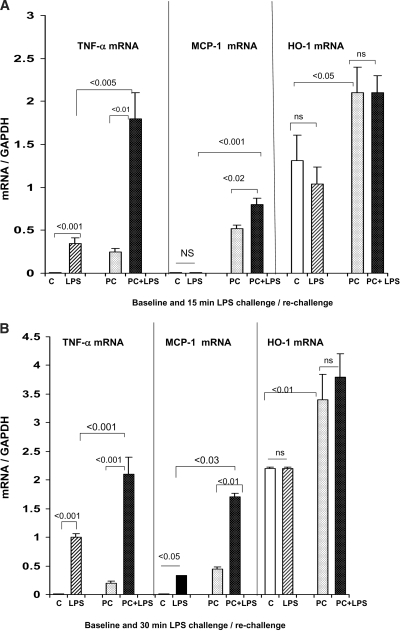
mRNA for TNF-α, MCP-1, and HO-1.
The LPS-PC mice had increased basal levels of TNF-α, MCP-1, and HO-1 mRNA, compared with values seen in control kidneys (compare controls, “C” versus“PC” in Figure 1, A and B; P < 0.01 in each instance). When these PC mice were rechallenged with LPS, significantly greater TNF-α and MCP-1 mRNA increases above these basal values were observed, compared with the LPS-induced increases in control kidneys (Figure 1A, 15 min after LPS time point; Figure 1B, 30 min after LPS time point). In contrast to TNF-α/MCP-1 mRNA, no increase in HO-1 mRNA was observed in LPS-PC mice upon LPS re-exposure, despite that HO-1 was clearly an LPS-responsive gene (based on the finding that basal mRNA levels were approximately two-fold higher in LPS-PC mice, versus controls). As described in the next section, these renal cortical mRNA responses were reflected by degrees of Pol II recruitment to their respective genes.
Figure 1.
(A and B) Renal mRNA responses to LPS injection in control and LPS-PC mice. Mice that were pretreated with LPS 18 h previously had modest but significant TNF-α and MCP-1 mRNA elevations, compared with control (C) mice. When the LPS-PC mice were rechallenged with LPS, significantly greater increases in TNF-α and MCP-1 mRNA were observed, versus those seen in LPS-challenged naive controls. This was true whether the measurements were made at 15 (A) or 30 min (B) after repeat LPS injection. HO-1 mRNA levels were approximately twice as high in the preconditioned versus the control mice (P < 0.01); however, no acute increases were seen in either group at either 15 or 30 min after LPS injection. LPS, 15 or 30 min after LPS injection; PC, 18 h after LPS injection; PC+LPS, preconditioned mice rechallenged with LPS.
Pol II Density at TNF-α Exons 1 and 4.
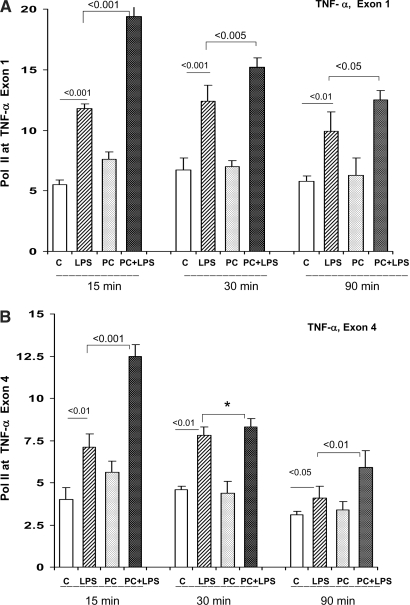
At 15, 30, and 90 min after LPS injection, both the control and the LPS-PC mice manifested increased Pol II localization at exons 1 and 4 of the TNF-α gene (Figure 2, A and B, exons 1 and 4, respectively). The degree of these LPS-driven increases were significantly greater in the LPS-PC mice, compared with LPS-challenged naive controls (P < 0.01 to <0.05). This heightened responsiveness was seen in the absence of any significant difference in baseline levels of Pol II–TNF-α gene localization between the control and LPS-PC mice, as assessed by overall statistical analysis for all mice.
Figure 2.
(A and B) LPS preconditioning: Pol II levels at start and end exons1,4 of the TNF-α gene. Pol II levels at TNF-α exon 1 (A) and exon 4 (B) were assessed at 15, 30, or 90 min after LPS injection in control (C) or LPS-PC mice. In each instance, Pol II recruitment was observed. The degree of this recruitment was significantly greater in the LPS-PC mice, compared with that seen in the LPS-challenged naive controls (*overall statistical comparison at the three time points at exon 4; P < 0.001).
Pol II Density at MCP-1 Exons 1 and 3.
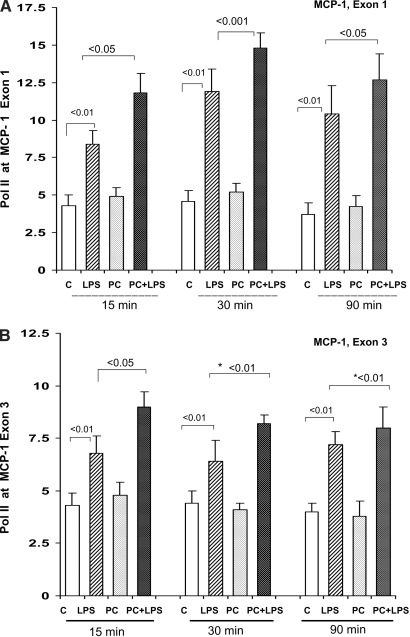
The MCP-1/Pol II results (Figure 3) mirrored those just described for TNF-α: (1) Overall statistical analyses (15, 30, and 90 min after LPS data combined) demonstrated that the LPS-PC mice had greater LPS-driven Pol II increases at both exons 1 and 3 of the MCP-1 gene, versus the LPS-induced increases seen in the controls (P < 0.01), and (2) these differences were observed in the absence of any significant baseline differences in Pol II levels at either MCP-1 gene locus.
Figure 3.
(A and B) LPS-PC: Pol II levels at start and end exons (1 and 3) of the MCP-1 gene. The preconditioned and control mice had comparable degrees of Pol II at both MCP-1 exons. When rechallenged with LPS, greater increases were observed in the preconditioned mice, compared with LPS-injected naive controls, particularly at the 15-min time point (*overall statistical analysis for all time points, exon 3, P < 0.01).
Pol II Density at HO-1 Exons 1 and 5.
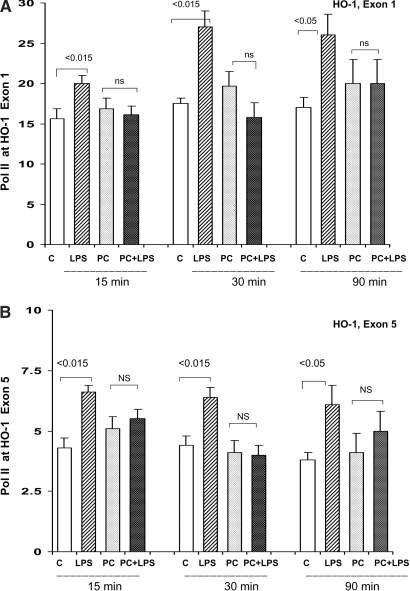
LPS injection into control mice induced significant increases in Pol II density at both exons 1 and 5 (Figure 4) of the HO-1 gene, indicating LPS responsiveness; however, in striking contrast to these findings, LPS injection into LPS-PC mice failed to acutely increase Pol II levels at HO-1 loci. As noted already (Figure 1 data), this failure of LPS-driven Pol II recruitment to HO-1 exons in the LPS-PC mice was associated with a failure of any further LPS induction of HO-1 mRNA (i.e., tolerance).
Figure 4.
(A and B) LPS-PC: Pol II levels at start and end exons (1 and 5) of the HO-1 gene. Acute LPS injection into naive controls caused acute, statistically significant Pol II recruitment to both HO-1 exons. This was true at each of the three time points. In striking contrast, when the preconditioned mice were rechallenged with LPS, no significant increase in Pol II levels was observed (at any time point or at either exon). This suggests LPS tolerance vis à vis Pol II recruitment.
Pol II Density at Ribosomal Genes.
None of the treatment protocols resulted in any change in Pol II localization at 18S ribosomal DNA (rDNA; data not shown). Thus, this served as a negative control for the positive Pol II binding to the TNF-α and MCP-1 genes, as described already.
mRNA Stability in Control and LPS-Challenged Mice.
Incubating control tubules with actinomycin D for 3 h resulted in approximately 80% TNF-α mRNA degradation (Figure 5A, left). Neither LPS-PC mice nor control mice subjected to a 30-min LPS challenge manifested any change in this amount of TNF-α mRNA degradation (again, approximately 80%; Figure 5A, left); however, when tubules were harvested from LPS-PC mice 30 min after LPS rechallenge, reduced TNF-α mRNA degradation was observed (approximately 50% TNF-α mRNA degradation; P < 0.001 versus the 80% seen in the other groups). This was not a transient finding: When the in vitro incubations were continued for 6 h with actinomycin D, no further decrease in TNF-α mRNA levels was observed (Figure 5A, right). Thus, these data indicate that LPS preconditioning permits stabilization of newly formed (LPS stimulated) TNF-α mRNA.
Figure 5.
(A) Assessments of in vitro TNF-α mRNA stability in isolated tubules harvested after in vivo LPS injection. Proximal tubules from control (C) mice and LPS-PC mice (PC) were harvested 30 min after either LPS or vehicle injection, and they were incubated in vitro for 3 or 6 h with or without actinomycin D (AD). Tubules from PC mice that were rechallenged with LPS manifested decreased mRNA degradation, as assessed at either the 3- or 6-h time point. Conversely, neither preconditioning alone nor LPS injection alone altered TNF-α mRNA degradation rates. (B) Assessments of in vitro MCP-1 and HO-1 stability after intravenous LPS injection. LPS induced MCP-1 mRNA stability, whether the assessments were made at 30 min or 18 h (preconditioned mice) after LPS injection. Conversely, only a minimal increase in HO-1 mRNA stability was observed in response to LPS, and this was observed only in preconditioned tubules that were rechallenged with LPS (P < 0.01).
To complement the TNF-α mRNA stability results, we assessed MCP-1 and HO-1 mRNA degradation (6 h incubation with or without actinomycin D). As shown in Figure 5B, control tubules manifested approximately 70% and approximately 60% MCP-1 and HO-1 mRNA degradation, respectively, during this period. LPS treatment markedly stabilized MCP-1 mRNA, such that virtually no degradation was observed in any of the tubules harvested from LPS-treated animals (Figure 5B). HO-1 mRNA degradation was not altered with LPS-PC; however, with LPS rechallenge, a modest decrease in HO-1 degradation was observed.
Maleate Nephrotoxicity: Impact on Pol II and mRNA Responses to LPS
mRNA.
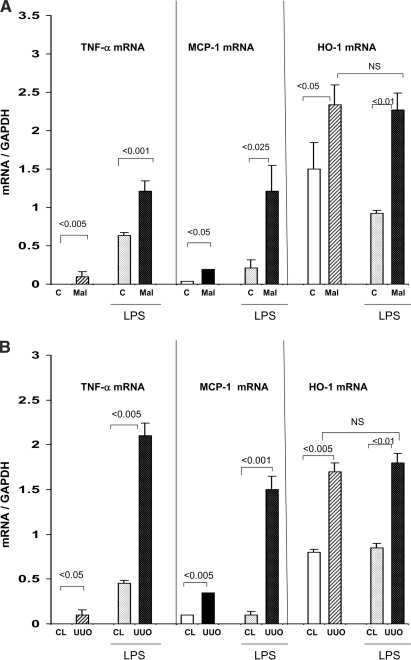
By itself, maleate toxicity caused modest but significant baseline increases in TNF-α, MCP-1, and HO-1 mRNAs (P < 0.025; Figure 6A). When these maleate mice were challenged with LPS, significantly greater TNF-α mRNA and MCP-1 mRNA increases (above basal values) were observed, versus those seen in LPS-injected controls. In contrast, LPS failed to increase HO-1 mRNA above basal values, suggesting LPS “tolerance” vis à vis this gene.
Figure 6.
(A) Renal cortical mRNA responses to LPS injection in the setting of maleate nephrotoxicity. By 15 to 30 min after LPS injection, significant increases in TNF-α, MCP-1, and HO-1 mRNA were observed in both the control (C) and maleate treatment groups. The degree of these TNF-α and MCP-1 mRNA increases were two- to four-fold greater in the maleate treatment group (compared with their basal values). Conversely, maleate pretreatment did not alter the HO-1 mRNA responses to LPS, given that the post-LPS values were essentially identical between the control and maleate groups. All three mRNAs were somewhat higher at baseline in the maleate versus control groups. (B) Renal cortical mRNA responses 15 to 30 min after LPS injection in the setting of UUO and in CL kidneys. These results mirrored those described for the maleate experiments, as follows: (1) UUO significantly increased TNF-α, MCP-1, and HO-1 mRNA in the absence of LPS; (2) LPS induced dramatic increases in all three mRNAs; (3) the degrees of TNF-α and MCP-1 mRNA increases were significantly greater in UUO versus CL kidneys; and (4) HO-1 mRNA in the UUO kidney did not acutely respond to LPS injection.
Pol II Levels.
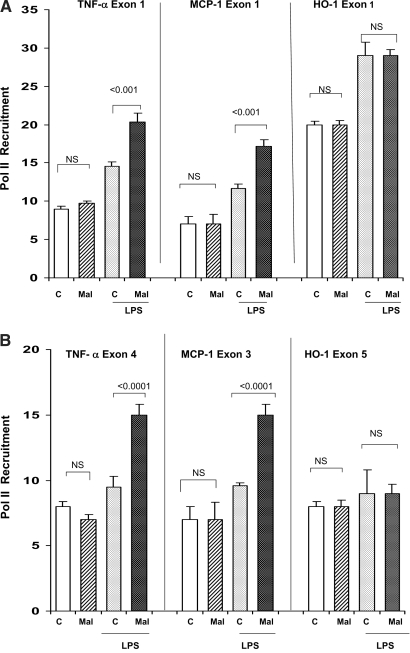
The Pol II data mirrored the described mRNA results: With LPS injection, the maleate mice showed hyperresponsive Pol II recruitment to both TNF-α (exons 1 and 4) and MCP-1 loci (exons 1 and 3), compared with LPS-injected controls (Figure 7). This difference could not be explained by differences in basal Pol II expression, which was not different for the control and maleate groups. LPS failed to acutely recruit Pol II to HO-1 exons 1 or 5, mirroring the associated failure of HO-1 mRNA induction. This further suggested acute LPS tolerance at the HO-1 gene. Pol II was not altered at rDNA (negative control).
Figure 7.
(A and B) Maleate nephrotoxicity: Pol II expression at start (A) and end (B) exons of TNF-α, MCP-1, and HO-1 genes. Maleate did not independently alter Pol II levels at either the start or end exons of any of the three assessed genes; however, when injected with LPS, Pol II recruitment occurred and was greater at both exons of the TNF-α and MCP-1 genes, compared with the recruitment seen in the controls. Conversely, no preferential recruitment of Pol II was seen at either exon of the HO-1 gene. Thus, these data were highly analogous to the observed corresponding mRNA levels, as presented in Figure 6A.
mRNA Stability.
No changes in TNF-α, MCP-1, or HO-1 mRNA degradation were observed in tubules harvested from maleate ± (with and without) LPS-treated mice (values recapitulating the control data shown in the LPS experiments) (data not shown). This suggests that the mRNA stabilization observed in the LPS-PC experiments may have been unique to that model.
Overnight Unilateral Ureteral Obstruction: Responses to LPS
mRNA.
Unilateral ureteral obstruction (UUO), by itself, caused modest increases in basal TNF-α, MCP-1, and HO-1 mRNA (versus values seen in contralateral [CL] kidneys). UUO also dramatically enhanced renal cortical TNF-α mRNA and MCP-1 mRNA responses to LPS (approximately four and 10 times greater increases after LPS, compared with CL, unobstructed, control kidneys; Figure 6B). In striking contrast, UUO did not alter renal cortical HO-1 mRNA responsiveness to LPS (NS versus their basal values; Figure 6B). Thus, these findings exactly paralleled those observed in the LPS-PC as well as the maleate experiments.
Pol II Levels.
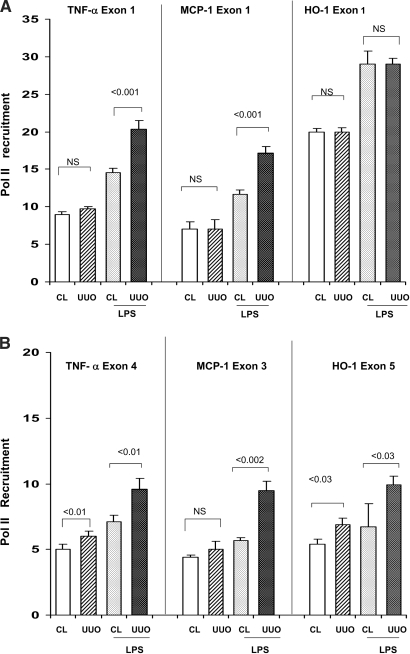
As shown in Figure 8, UUO, by itself, induced either minimal or nonsignificant Pol II recruitment to TNF-α, MCP-1, or HO-1 exons. LPS induced significant Pol II recruitment to both exons of each of the three assessed genes (P < 0.025, CL versus CL + LPS). The degrees of increase at the TNF-α and MCP-1 exons were statistically greater in the LPS-challenged UUO kidneys, compared with their CL unobstructed kidneys; however, LPS failed to raise Pol II levels at HO-1 exon 1 above basal values (suggesting LPS “tolerance” at this site). Conversely (and unlike the results in the LPS-PC and maleate experiments), UUO did increase LPS-driven Pol II binding to exon 5 of the HO-1 gene. No Pol II increase was seen at rDNA (again, serving as a negative control).
Figure 8.
(A and B) UUO: Pol II expression at start (A) and end (B) exons of TNF-α, MCP-1, and HO-1 genes. UUO did not independently alter Pol II levels at exon 1 of any of the assessed genes. It also had either a quantitatively minimal or no impact on Pol II at end exons. When the mice were administered an injection of LPS, significantly greater increases in Pol II recruitment was observed at both start and end exons of the TNF-α and MCP-1 genes. Conversely, no preferential increase was seen at HO-1 exon 1, highly consistent with the previously described HO-1 mRNA data (Figure 6B); however, a modest preferential increase of Pol II was observed at HO-1 exon 5.
mRNA Stability.
The presence of UUO did not alter TNF-α, MCP-1, or HO-1 mRNA stability in the presence or absence of LPS (as reflected by equal degradation in CL and obstructed kidneys at 3 to 6 h of incubation; data not shown). Thus, as with the maleate results, these findings suggest that the observed increase in TNF-α stability upon LPS rechallenge in the LPS-PC experiments was relatively unique to that model.
Histone 3-Lysine 4 Trimethylation at Target Genes
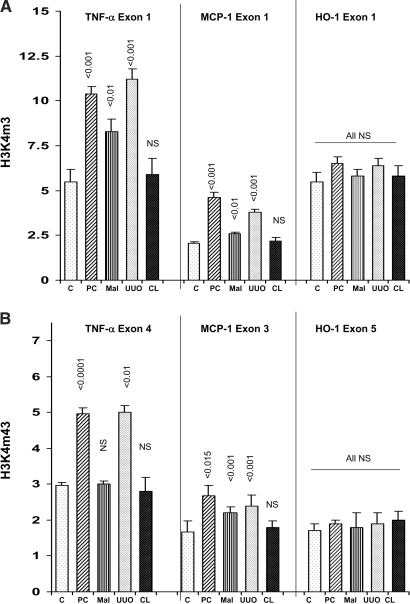
Histone modifications can alter Pol II binding and gene expression. In particular, trimethylation of H3 lysine 4 (H3K4m3) is associated with actively transcribed genes and an open chromatin state.28–33 Thus, we probed each of the ARF models to ascertain whether H3K4m3 is elevated at target genes. As shown in Figure 9, each of the three ARF models increased H3K4m3 at exon 1 of the TNF-α and MCP-1 genes. UUO and LPS-PC also increased H3K4m3 at TNF-α and MCP-1 end exons. Conversely, no increase in H3K4m3 was observed at either exon 1 or 5 of the HO-1 gene. Thus, these changes, observed 18 h after LPS injection, maleate injection, or induction of UUO, correlated with subsequent LPS-induced enhancement of Pol II recruitment to the TNF-α and MCP-1 genes but not the HO-1 gene.
Figure 9.
(A) H3K4m3 at the start of the TNF-α, MCP-1, and HO-1 genes. LPS-PC, maleate nephrotoxicity (Mal), and UUO each induced significant increases in the extent of H3K4m3 at exon 1 of the TNF-α and MCP-1 genes. Conversely, no change in H3K4m3 at HO-1 exon 1 was observed. CL, contralateral kidney in mice subjected to UUO. The CL results did not significantly differ from those observed in normal control (C) kidneys. (B) H3K4m3 at exons 4, 3, and 5 of the TNF-α, MCP-1, and HO-1 genes, respectively. H3K4m3 levels at both TNF-α and MCP-1 end exons were significantly increased with both UUO and LPS (but not maleate) preconditioning. Conversely, no increase in H3K4m3 was observed at HO-1 exon 5. Results in CL kidneys from UUO mice did not differ from normal controls (C).
Blood Urea Nitrogen Concentrations
The LPS-PC and maleate protocols induced modest azotemia, as assessed 18 h after injections (42 ± 3 and 75 ± 5 mg/dl, respectively; controls 24 ± 2 mg/dl). As expected, UUO only slightly raised blood urea nitrogen concentrations (28 ± 3; NS versus control values).
DISCUSSION
In a Science editorial34 that introduced Kornberg's elucidation of Pol II's crystallographic structure,35,36 Marx advanced the following view: “If any enzyme does the cell's heavy lifting, it's RNA polymerase II. Its job: Getting the synthesis of all of the proteins in higher cells under way by copying their genes into RNA, and doing it at just the right time and in just the right amounts. As such, Pol II is the heart of the machinery that controls everything that cells do—from differentiating into all of the tissues of a developing embryo to responding to every day stress.” A clinically relevant “stress” that befalls patients with ARF is Gram-negative sepsis. Hence, this study sought to determine whether increased Pol II recruitment is a proximate event underlying our recent observations5–11 that the ARF kidney hyperresponds to LPS. We recently documented that Fast Chromatin Immunoprecipitation (ChIP) assay can be used to assess in vivo genomic Pol II recruitment.37 Hence, we applied this technique to help probe this issue.
In each of three highly divergent models of acute renal injury (LPS-PC, maleate nephrotoxicity, and UUO), we demonstrate almost immediate LPS hyperresponsiveness, as assessed by greater renal cortical TNF-α and MCP-1 mRNA increments versus those elicited by LPS in normal kidneys. We previously documented that these mRNA increases translate into enhanced renal TNF-α/MCP-1 protein synthesis, as reflected by elevations in their renal cortical and plasma concentrations.5–11 The key finding of this study is that this mRNA hyperresponsiveness is accompanied by enhanced Pol II recruitment to the TNF-α and MCP-1 genes. That this same result was documented in each of three unrelated ARF models underscores its potential broad-based relevance. In contrast, ARF failed to sensitize the kidney to LPS-mediated HO-1 mRNA accumulation, and Pol II recruitment to the HO-1 locus was suppressed. This suggests that selective “LPS tolerance” vis à vis HO-1 responsiveness had emerged. The reason for this remains unknown; however, it clearly indicates that the observed Pol II elevations at TNF-α/MCP-1 gene loci were not simply a nonspecific consequence of LPS injection. That LPS also did not alter Pol II binding to rDNA underscores this point. Finally, it is noteworthy that essentially parallel changes were observed at both the start and the end exons of the TNF-α and MCP-1 genes. Because Pol II recruitment along the gene is required for increased gene transcription to occur, these results support the pathophysiologic relevance of the Pol II data.
Along with increased transcription, mRNA stabilization may also raise mRNA levels (e.g., 12–17). Thus, we addressed whether this mechanism, rather than Pol II–driven gene transcription, might have caused the preferential LPS-mediated TNF-α/MCP-1 mRNA increases in the setting of ARF. Toward this end, isolated proximal tubules were harvested from each of the three injury models, and then in vitro mRNA degradation was assessed in the presence and absence of actinomycin D (to inhibit new mRNA synthesis). The available data strongly support the mechanistic importance of increased transcription for the previously described TNF-α/MCP-1 mRNA results: First, none of the injury models, by themselves, changed the amount of TNF-α, MCP-1, or HO-1 mRNA degradation. Second, although acute LPS injection acutely stabilized MCP-1 mRNA, this was the same in control and ARF tubules. This strongly suggests that the observed differences in MCP-1 mRNA responses to LPS reflected different transcription rates. Third, although the LPS-PC mice exhibited greater TNF-α mRNA stability upon LPS rechallenge than did control mice, no such stabilization was observed after LPS injection in the setting of either UUO or maleate-induced ARF. Thus, although these observations underscore the potential emergence of selective mRNA stabilization after LPS injection, they also indicate that this mechanism is an insufficient explanation, by itself, for the ARF-induced LPS hyperresponsive state; however, exact assessments of relative contributions of stabilization versus transcription for each gene/mRNA would require direct in vivo quantification of absolute transcription rates.
In our previous studies of induction of LPS hyperresponsiveness after renal injury, the mRNA assessments were made from 2 to 4 h after LPS injection. The longer the interval between LPS injection and tissue sampling, the greater is the potential for changes in mRNA stability to affect mRNA levels at any given transcription rate; therefore, in this study, we assessed mRNA levels shortly (15 min) after LPS injection. As noted, in each of the three test models, marked increases in TNF-α and MCP-1 mRNA were documented at this early time point. Thus, when these results are interpreted along with the changes in Pol II recruitment, they further support the concept that increased transcription was the dominant mechanism for the preferential TNF-α/MCP-1 mRNA increases in ARF kidneys upon exposure or re-exposure to LPS.
The specific mechanism(s) that dictates these Pol II responses needs to be defined. In this regard, recent work suggested that epigenetic histone modifications, including methylation, acetylation, phosphorylation, and ubiquitination, can enhance or suppress Pol II recruitment to target genes.38–41 By modulating Pol II binding, these changes can induce cellular “memory” and thereby alter subsequent injury responses. Because H3K4m3 can augment gene expression,30–32,42,43 we probed ARF kidneys for this mark at target genes. In each of the ARF models, increased H3K4m3 levels were observed at TNF-α and MCP-1 gene loci. Conversely, H3K4m3 was unchanged at HO-1 exons. Thus, these results exactly parallel the Pol II recruitment and mRNA responses that were observed. It is premature to conclude that changes in H3K4m3 directly mediate LPS hyperresponsiveness or tolerance because multiple histone modifications may coexist. Furthermore, the mechanisms that mediate these histone modifications (e.g., possible increases in methyltransferase activities) and the potential indirect impact(s) of other injury responses (e.g., HO-1 induction, cholesterol accumulation4,8) remain to be defined; however, the H3K4m3 results do underscore the principal conclusion of this work: That heightened or suppressed ARF “stress” responses reflect and likely stem from changes at the genomic level. Further exploration of this concept will likely yield important new insights into our understanding of tissue adaptations to injury, in general, as well as defining downstream consequences of ARF.
CONCISE METHODS
LPS-PC Model: Effects on Subsequent LPS Responsiveness
All animal experiments were approved by the institution's IACUC in accordance with NIH guidelines. LPS-PC was induced by intravenous injection of 2 mg/kg Escherichia coli LPS (0111:B4; L-2630; Sigma Chemicals, St. Louis, MO).8 Controls received an equal volume of vehicle (approximately 100 μl). Approximately 18 h later, the mice were rechallenged either with the same dosage of LPS or with vehicle. Kidneys were resected 15, 30, or 90 min later and assessed for either Pol II recruitment to start/end exons of TNF-α, MCP-1, or HO-1 (see ChIP Assay) or their respective mRNA5,6 (n = 5 to 6 animals to establish each group).
Maleate ARF Model: Effects on LPS Responsiveness
Na maleate (600 mg/kg) or saline vehicle was administered intraperitoneally.31 At approximately 18 h after maleate injection, these mice and control mice were subjected to either the 2 mg/kg intravenous LPS challenge or intravenous vehicle (saline) injection. Kidneys were resected either 15 or 30 min later and were analyzed for Pol II localization at TNF-α, MCP-1, and HO-1 exons (start and end) and their cognate mRNAs (n = 5 mice per group).
UUO Effects on LPS Responsiveness
Left UUO was induced in 10 mice as described previously.6 Approximately 18 h later, four of these mice were subjected to bilateral nephrectomy. The remaining six mice were administered an injection of LPS, followed 15 min later by bilateral nephrectomy. Each kidney was cut in half, the cortices were dissected, and the tissues were used for either mRNA analysis (TNF-α, MCP-1, and HO-1) or for Pol II localization at the start and end exons of each gene (see ChIP Assay).
Renal Cortical ChIP Assay
Renal cortical tissue samples were probed for RNA Pol II localization at TNF-α, MCP-1, and HO-1 genomic DNA sites with a previously described Fast ChIP assay.31 In brief, approximately 25 mg of tissue was fixed in formaldehyde, minced, pelleted, extensively washed, and sheared by sonication. ChIP was conducted using anti–Pol II antibody (Santa Cruz Biotechnologies, Santa Cruz, CA; SC899). Nonimmune (mock) IgG served as a control. Protein A beads were used to capture anti–Pol II and associated DNA fragments. After proteinase K treatment (to release DNA), analyses for start and end exons of TNF-α (exons 1 and 4), MCP-1 (exons 1 and 3), and HO-1 (exons 1 and 5) were performed using real-time PCR.31 The primer sets are listed in Table 1. 18S ribosomal DNA was quantified to serve as a negative control. Pol II density at genomic sites was expressed as a signal-to-noise ratio (R) using the formula R = exp2(CTmock − CTspecific), where CTmock and CTspecific are mean threshold cycles of PCR done in triplicate on DNA samples from specific and mock immunoprecipitations.
Table 1.
Primers used for Pol II binding analysis
| Gene | Primer |
|---|---|
| TNF-α exon 1 | |
| right | 5′-GCAGGTTCTGTCCCTTTCAC-3′ |
| left | 5′-αGTGCCTCTTCTGCCAGTTC-3′ |
| TNF-α exon 4 | |
| right | 5′-TATGGCTCAGGGTCCAACTC-3′ |
| left | 5′-GCTCCAGTGAATTCGGAAAG-3′ |
| MCP-1 exon 1 | |
| right | 5′-GCCAACACGTGGATGCTC-3′ |
| left | 5′-αGCCAACTCTCACTGAAGCC-3′ |
| MCP-1, exon 3 | |
| right | 5′-TTAAGGCATCACAGTCCGAG-3′ |
| left | 5′-TTGAATGTGAAGTTGACCCG-3′ |
| HO-1, exon 1 | |
| right | 5′-αGCTACAGGTAGACTGGGCG-3′ |
| left | 5′-GAGCCTGAATCGAGCAGAAC-3′ |
| HO-1, exon 5 | |
| right | 5′-GGCTGCTGGTTTCAAAGTTC-3′ |
| left | 5′-TCTTGCCTGGCTCTCTTCTC-3′ |
| 18S | |
| forward | 5′-CCGCAGCTAGGAATAATGGAATA-3′ |
| reverse | 5′-TGAAAACATTCTTGGCAAATGCT-3′ |
mRNA Stability Assay
LPS-PC.
Renal cortical proximal tubules were isolated31 from the following groups of mice, as described previously: (1) Control mice, (2) LPS-PC mice, (3) normal mice 30 min after intravenous LPS injection, and (4) LPS-PC mice 30 min after LPS re-injection. Each tubule preparation was divided into four aliquots and incubated for 3 to 6 h at 37°C in the presence or absence of actinomycin D (2 μg/ml). Actinomycin D was used to inhibit new mRNA synthesis such that changes in mRNA levels reflected degradation rates. Tubule incubation medium31 was supplemented with 5 mM glycine to help maintain tubule viability (<10% lactate dehydrogenase release over the course of incubations). At the completion of the incubations, total RNA was extracted and assayed for TNF-α, MCP-1, and HO-1 mRNA by reverse transcriptase–PCR.5,6,11 The percentage of mRNA degradation was assessed by comparing mRNA values after control versus actinomycin D incubations. At least six sets of tubule preparations per each experimental group were analyzed. (Note: TNF-α mRNA was assessed after both 3- and 6-h incubations; MCP-1 and HO-1 mRNA were assayed only after 6-h incubations because of their greater half-lives.)
Maleate Toxicity.
Tubules were harvested from 10 mice at 18 h after maleate injection and from 10 control mice. Thirty minutes before isolation, half of each group were administered an injection of LPS or vehicle. Each preparation was divided into four aliquots: Control incubation for 3 or 6 h or incubation with actinomycin D for 3 or 6 h, as already described. At the end of the 3- to 6-h incubations, TNF-α, MCP-1, and HO-1 mRNA were assessed and analyzed as already.
UUO.
Twenty mice were subjected to UUO. Approximately 18 h later, half were administered an injection of either LPS or vehicle. Thirty minutes later, tubules were harvested from obstructed left kidneys or from CL right kidneys and incubated as noted previously (with or without actinomycin D). To have sufficient tissue for study, two UUO kidneys and two CL kidneys were combined for tubule isolation and analysis. This yielded five separate samples for each analysis (UUO with or without LPS; contralateral kidneys with or without LPS; each incubated with or without actinomycin D).
Statistical Analysis
All results are presented as means ± 1 SEM. Statistical comparisons were made by unpaired t test (significance judged by P < 0.05). When multiple statistical comparisons were made, the Bonferroni correction was applied. Cortical tissue mRNA results were expressed as a ratio to simultaneously measured glyceraldehyde-3-phosphate dehydrogenase mRNA.5,6
DISCLOSURES
None.
Acknowledgments
This work was supported by research grants from the National Institutes of Health (DK-R37-38431 and DK-68520[R.Z.] and DK-R37–45978 and GM45134 [K.B.]).
We thank Ali Johnson, Steve Lund, and Nayeon Kim for expert technical support on this project.
Published online ahead of print. Publication date available at www.jasn.org.
REFERENCES
- 1.Honda N, Hishida A, Ikuma K, Yonemura K: Acquired resistance to acute renal failure. Kidney Int 31: 1233–1238, 1987 [DOI] [PubMed] [Google Scholar]
- 2.Elliott WC, Houghton DC, Gilbert DN, Baines-Hunter J, Bennett WM: Gentamicin nephrotoxicity. I. Degree and permanence of acquired insensitivity. J Lab Clin Med 100: 501–512, 1982 [PubMed] [Google Scholar]
- 3.Zager RA, Baltes LA, Sharma HM, Jurkowitz MS: Responses of the ischemic acute renal failure kidney to additional ischemic events. Kidney Int 26: 689–700, 1984 [DOI] [PubMed] [Google Scholar]
- 4.Nath KA, Balla G, Vercellotti GM, Balla J Jacob HS, Levitt MD, Rosenberg ME: Induction of heme oxygenase in a rapid protective response in rhabdomyolysis in the rat. J Clin Invest 90: 267–270, 1992 [DOI] [PMC free article] [PubMed] [Google Scholar]
- 5.Zager RA, Johnson AC, Hanson SY, Lund S: Ischemic proximal tubular injury primes mice to endotoxin-induced TNF-α generation and systemic release. Am J Physiol 289: F289–F297, 2005 [DOI] [PubMed] [Google Scholar]
- 6.Zager RA, Johnson AC, Hanson SY, Lund S: Acute nephrotoxic and obstructive injury primes the kidney to endotoxin-driven cytokine/chemokine production. Kidney Int 69: 1181–1188, 2006 [DOI] [PubMed] [Google Scholar]
- 7.Zager RA, Johnson AC, Lund S, Hanson S: Acute renal failure: Determinants and characteristics of the injury-induced hyperinflammatory response. Am J Physiol 291: F546–F556, 2006 [DOI] [PubMed] [Google Scholar]
- 8.Zager RA, Johnson AC, Lund S: ′Endotoxin tolerance’: TNF-α hyper-reactivity and tubular cytoresistance in a renal cholesterol loading state. Kidney Int 71: 496–503, 2007 [DOI] [PubMed] [Google Scholar]
- 9.Zager RA: Subclinical gentamicin nephrotoxicity: A potential risk factor for exaggerated endotoxin driven TNF-α production. Am J Physiol 293: F43–F49, 2007 [DOI] [PubMed] [Google Scholar]
- 10.Zager RA, Johnson AC, Hanson SY: Parenteral iron nephrotoxicity: Potential mechanisms and consequences. Kidney Int 66: 144–156, 2004 [DOI] [PubMed] [Google Scholar]
- 11.Zager RA, Johnson ACM, Lund S, Randolph-Habecker J: Toll-like receptor (TLR4) shedding and depletion: Acute proximal tubular cell responses to hypoxic and toxic injury. Am J Physiol 292: F304–F312, 2007 [DOI] [PubMed] [Google Scholar]
- 12.Wang Y, Stricker HM, Gou D, Liu L: MicroRNA: Past and present. Front Biosci 12: 2316–2329, 2007 [DOI] [PubMed] [Google Scholar]
- 13.Sanchez-Diaz P, Penalva LO: Post-transcription meets post-genomic: The saga of RNA binding proteins in a new era. RNA Biology 3: 101–109, 2006 [DOI] [PubMed] [Google Scholar]
- 14.Newbury SF: Control of mRNA stability in eukaryotes. Biochem Soc Trans 34: 30–34, 2006 [DOI] [PubMed] [Google Scholar]
- 15.Meyer S, Temme C, Wahle E: Messenger RNA turnover in eukaryotes: Pathways and enzymes. Crit Rev Biochem Mol Biol 39: 197–216, 2004 [DOI] [PubMed] [Google Scholar]
- 16.Osborne HB: An insight into the post-transcriptional control of gene expression in cell function. Biology of the Cell 95: 125–137, 2003 [DOI] [PubMed] [Google Scholar]
- 17.Bevilacqua A, Ceriani MC, Capaccioli S, Nicolin A: Post-transcriptional regulation of gene expression by degradation of messenger RNAs. J Cell Physiol 195: 356–372, 2003 [DOI] [PubMed] [Google Scholar]
- 18.Kornberg RD: The molecular basis of eukaryotic transcription. Proc Natl Acad Sci U S A 104: 12955–12961, 2007 [DOI] [PMC free article] [PubMed] [Google Scholar]
- 19.Li B, Carey M, Workman JL: The role of chromatin during transcription. Cell 128: 707–719, 2007 [DOI] [PubMed] [Google Scholar]
- 20.Thomas MC, Chiang CM: The general transcription machinery and general cofactors. Crit Rev Biochem Mol Biol 41: 105–178, 2006 [DOI] [PubMed] [Google Scholar]
- 21.Fan H, Cook JA: Molecular mechanisms in endotoxin tolerance. J Endotoxin Res 10: 71–84, 2004 [DOI] [PubMed] [Google Scholar]
- 22.Ziegler-Heitbrock HW: Molecular mechanism in tolerance to lipopolysaccharide. J Inflamm 45: 13–26, 1995 [PubMed] [Google Scholar]
- 23.Cross AS: Endotoxin tolerance-current concepts in historical perspective. J Endotoxin Res 8: 83–98, 2002 [DOI] [PubMed] [Google Scholar]
- 24.Tracz MJ, Juncos JP, Grande JP, Croatt AJ, Ackerman AW, Rajagopalan G, Knutson KL, Badley AD, Griffin MD, Alam J, Nath KA: Renal hemodynamic, inflammatory, and apoptotic responses to lipopolysaccharide in HO-1−/− mice. Am J Pathol 170: 1820–1830, 2007 [DOI] [PMC free article] [PubMed] [Google Scholar]
- 25.Nath KA: Renal response to repeated exposure to endotoxin: Implications for acute kidney injury. Kidney Int 71: 477–479, 2007 [DOI] [PubMed] [Google Scholar]
- 26.Nath KA: Heme oxygenase-1: A provenance for cytoprotective pathways in the kidney and other tissues. Kidney Int 70: 432–443, 2006 [DOI] [PubMed] [Google Scholar]
- 27.Vogt BA, Alam J, Croatt AJ, Vercellotti GM, Nath KA: Acquired resistance to acute oxidative stress. Possible role of heme oxygenase and ferritin. Lab Invest 72: 474–483, 1985 [PubMed] [Google Scholar]
- 28.Miao F, Natarajan R: Mapping global histone methylation patterns in the coding regions of human genes. Mol Cell Biol 25: 4650–4661, 2005 [DOI] [PMC free article] [PubMed] [Google Scholar]
- 29.Morillon A, Karabetsou N, Nair A, Mellor J: Dynamic lysine methylation on histone H3 defines the regulatory phase of gene transcription. Mol Cell 18: 723–734, 2005 [DOI] [PubMed] [Google Scholar]
- 30.Santos-Rosa H, Schneider R, Bannister AJ, Sherriff J, Bernstein BE, Emre NC, Schreiber SL, Mellor J, Kouzarides T: Active genes are tri-methylated at K4 of histone H3. Nature 419: 407–411, 2002 [DOI] [PubMed] [Google Scholar]
- 31.Kouzarides T: Chromatin modifications and their function. Cell 128: 693–705, 2007 [DOI] [PubMed] [Google Scholar]
- 32.Vermeulen M, Mulder KW, Denissov S, Pijnappel WW, van Schaik FM, Varier RA, Baltissen MP, Stunnenberg HG, Mann M, Timmers HT: Selective anchoring of TFIID to nucleosomes by trimethylation of histone H3 lysine 4. Cell 131: 58–69, 2007 [DOI] [PubMed] [Google Scholar]
- 33.Guenther MG, Jenner RG, Chevalier B, Nakamura T, Croce CM, Canaani E, Young RA: Global and Hox-specific roles for the MLL1 methyltransferase. Proc Natl Acad Sci U S A 102: 8603–8608, 2005 [DOI] [PMC free article] [PubMed] [Google Scholar]
- 34.Marx J: Transcription enzyme structure solved. Science 292: 411–414, 2001 [DOI] [PubMed] [Google Scholar]
- 35.Cramer P, Bushnell DA, Kornberg RD: Structural basis of transcription: RNA polymerase II at 2.8 angstrom resolution. Science 292: 1863–1876, 2001 [DOI] [PubMed] [Google Scholar]
- 36.Gnatt AL, Cramer P, Fu J, Bushnell DA, Kornberg RD: Structural basis of transcription: An RNA polymerase II elongation complex at 3.3 A resolution. Science 292: 1876–1882, 2001 [DOI] [PubMed] [Google Scholar]
- 37.Zager RA, Johnson AC, Naito M, Bomsztyk K: Maleate nephrotoxicity: Mechanisms of injury and correlates with ischemic/hypoxic tubular cell death. Am J Physiol Renal Physiol 294: F187–F197, 2007 [DOI] [PubMed] [Google Scholar]
- 38.Razin SV, Iarovaia OV, Sjakste N, Sjakste T, Bagdoniene L, Rynditch AV, Eivazova ER, Lipinski M, Vassetzky YS: Chromatin domains and regulation of transcription. J Mol Biol 369: 597–607, 2007 [DOI] [PubMed] [Google Scholar]
- 39.Clayton AL, Hazzalin CA, Mahadevan LC: Enhanced histone acetylation and transcription: A dynamic perspective. Molec Cell 23: 289–296, 2006 [DOI] [PubMed] [Google Scholar]
- 40.Turner BM: Histone acetylation and an epigenetic code. Bioessays 9: 836–845, 2000 [DOI] [PubMed] [Google Scholar]
- 41.Bantignies F, Cavalli G: Cellular memory and dynamic regulation of polycomb group proteins. Curr Opinion Cell Biol 18: 275–283, 2006 [DOI] [PubMed] [Google Scholar]
- 42.Chen L, Firozi P, Barton M, Templeton NS: Widespread, exceptionally high levels of histone H3 lysine 4 trimethylation largely mediate “privileged” gene expression. Gene Expr 13: 271–282, 2007 [DOI] [PMC free article] [PubMed] [Google Scholar]
- 43.Wysocka J, Swigut T, Xiao H, Milne TA, Kwon SY, Landry J, Kauer M, Tackett AJ, Chait BT, Badenhorst P, Wu C, Allis CD: A PHD finger of NURF couples histone H3 lysine 4 trimethylation with chromatin remodelling. Nature 442: 86–90, 2006 [DOI] [PubMed] [Google Scholar]


