

Abstract
Niemann-Pick type C (NPC) is a fatal autosomal recessive lipidosis that is characterized by lysosomal storage of cholesterol and glycosphingolipids. Patients exhibit prolonged neonatal jaundice, hepatosplenomegaly, and progressive neurodegeneration that generally result in death by the teen years. Most clinical cases are caused by mutations in the NPC1 gene. Current mouse models of NPC are not well suited for studying the liver disease due to the rapidly progressing neurological disease. To facilitate study of NPC-associated liver dysfunction, we have developed a novel mouse model using antisense oligonucleotides to ablate NPC1 expression primarily in the liver. Here, we show that the NPC1 knockdown leads to a liver disease phenotype similar to that of patients with NPC and the NPCnih mouse model. Key features include hepatomegaly, lipid storage, elevated serum liver enzymes, and increased apoptosis.
Conclusion
This novel NPC1 antisense mouse model will allow delineation of the mechanism by which NPC1 dysfunction leads to liver cell death.
Niemann-Pick type C (NPC) is an autosomal recessive lysosomal storage disease with an estimated prevalence of 1:150,000, which is characterized by cellular accumulation of cholesterol and glycosphingolipids in all tissues of the body.1 The majority of patients with NPC have mutations in the NPC1 gene and a small number have mutations in NPC2.2 Symptoms of NPC include vertical gaze palsy, ataxia, dystonia, and progressive neurodegeneration. The majority of patients with NPC die as a consequence of their neurological disease; however, approximately 45%−65% of patients with NPC also suffer from cholestasis, prolonged jaundice, and hepatosplenomegaly.2-4 Ten percent of these patients die from liver failure before they reach 6 months of age.3 NPC disease is the second most common cause of neonatal cholestasis.5 Multiple cases have reported patients suffering from liver failure.4,6-11 Thus, liver disease in patients with NPC is more common than previously perceived.
A key function of the liver is to maintain the whole-body cholesterol balance.12 The liver is responsible for clearing cholesterol circulating in the blood in the form of low-density lipoproteins (LDL), high-density lipoproteins (HDL), and chylomicron remnants. Both chylomicron remnants and LDL particles are internalized via a clathrin-mediated endocytic pathway in which the cholesteryl ester core is hydrolyzed in endosomes to unesterified cholesterol. NPC1 and NPC2 encode proteins found in late endosomes and lysosomes and are hypothesized to participate in cholesterol egress from those organelles.13 The cholesterol can then be sent to the endoplasmic reticulum for re-esterification or utilized for bile acid synthesis, leading to its elimination from the body. When NPC1 or NPC2 is mutated, cholesterol transport out of endosomes and lysosomes is impaired, leading to the formation of storage bodies.
Previous studies investigating NPC liver disease have used the NPCnih mouse model, which lacks a functional NPC1 protein.14 These studies report that NPCnih mice exhibit a liver disease phenotype similar to that seen in the NPC infant.15-19 Characteristic features include hepatomegaly, liver cholesterol accumulation, increased plasma liver enzymes, and apoptotic cells.16 Fibrosis occurs when the mice are fed a high-cholesterol diet.17 Although liver disease is observed in NPCnih mice, the neurodegeneration is overwhelming, causing declining body weight and a lifespan shortened to approximately 60−80 days.17,20-22
To study NPC liver disease without the confounding effects of neurodegeneration, we have developed a mouse model in which the liver disease is predominant. In this study, we used second-generation 2′-O-methoxyethyl–modified antisense oligonucleotides (ASOs) to block NPC1 expression. We show that ASO treatment causes reduced NPC1 expression in liver and lung, but not in brain or other tissues. This leads to changes in liver histology and physiology that are characteristic of NPC disease.
Materials and Methods
Oligonucleotides
ASOs modified by the 20-unit oligomer 2′-O-methoxyethyl were synthesized and purified as described.23,24 The sequence of the ASO targeted to the NPC1 messenger RNA is: 5′-CCCGATTGAGCTCATCTTCG-3′. As a control, we used an ASO with a mismatched sequence 5′-CCTTCCCTGAAGGTTCCTCC-3′. ASOs were dissolved in 0.9% saline and stored at −20°C.
Animal Care and Treatment
All of the following procedures were approved by the Institutional Animal Care and Use Committee at Tufts University and were in compliance with the NIH Guide for the Care and Use of Laboratory Animals. Female BALB/c mice (8 weeks of age) were purchased from The Jackson Laboratory (Bar Harbor, ME) and Taconic Farms (Hudson, NY). They were housed five animals per cage and fed rodent chow. Mice were injected intraperitoneally with either NPC1 ASO or a mismatched control ASO at a dose of 50 mg/kg body weight twice a week for 2, 4, 6, and 9 weeks. At the end of the treatment period, animals were fasted overnight, then euthanized and blood samples taken by cardiac puncture. Mice were perfused with cold phosphate-buffered saline via cardiac puncture, after which tissues were dissected and fixed in 10% formalin or snap-frozen.
Western Blots
Tissues were homogenized in high salt lysis buffer (0.5 M NaCl and 0.2% sodium dodecyl sulfate in phosphate-buffered saline, protease inhibitor cocktail, and 0.2 mM sodium orthovanadate). For analysis of NPC1 and NPC1L1, lysates were heated to 80°C for 2 minutes, then subjected to electrophoresis on 7.5% Tris-HCl gels (Bio-Rad Laboratories, Hercules, CA) and transferred to 0.4 μm nitrocellulose. Blots were blocked in Tween–tris-buffered saline (TBS) containing 5% nonfat dry milk and incubated overnight at 4°C with primary antibody (NPC1, 1:2000, Abcam, Cambridge, MA; NPC1L1, 1:1000, Novus, Littleton, CO). Blots were then washed three times for 15 minutes with Tween-TBS, then incubated for 1 hour with goat anti-rabbit secondary antibody conjugated to horseradish peroxidase (HRP, 1:2000; Bio-Rad Laboratories). Blots were washed with Tween-TBS and developed using the Immobilon Western Chemiluminescent HRP substrate (Millipore, Billerica, MA). For analysis of NPC2, lysates were subjected to electrophoresis on 4%−20% Tris-HCl gels (Bio-Rad Laboratories) without prior heating. The polyclonal rabbit anti-NPC2 antibody was graciously provided by Peter Lobel (University of Medicine and Dentistry of New Jersey) and used at 1:2000 dilution. Anti-β-actin monoclonal antibody was purchased from Sigma-Aldrich, St. Louis, MO, and used at 1:1000 dilution.
Measurement of Tissue Cholesterol Content
Aliquots of liver, lung, and spleen homogenate were subjected to Folch extraction.25 Stigmasterol (15 μg) was added to each sample as an internal standard. The Folch organic phase was then used for unesterified cholesterol measurements quantified by a Hewlett-Packard 5890 gas chromatograph using a DB-17 capillary column (15 m × 0.53 mm, Alltech) at 245°C.
Serum Chemistries
Blood was centrifuged at 2000g for 15 minutes and serum cholesterol, HDL, LDL, triglycerides, bile acids, and liver enzymes were measured by Idexx Laboratories (Grafton, MA).
Quantitative Polymerase Chain Reaction
Total RNA was isolated from liver tissue using the PARIS kit (Ambion, Austin, TX), and complementary DNA was prepared using an oligo-dT primer and Superscript III reverse transcriptase (Invitrogen, Carlsbad,CA). Real-time polymerase chain reaction was performed with a Stratagene cycler using SYBR green quantitative polymerase chain reaction Master Mix (Superarray, Frederick, MD). Many primers were previously designed22,26,27; however, tumor necrosis factor receptor I (TNF-RI) primers were purchased from Superarray (Frederick, MD). Results were evaluated by the comparative CT method using gapdh as the invariant control gene. RNA levels are expressed relative to those of the mismatched ASO-treated mice and reflect the average ± standard deviation (SD) for three mice/group.
Histology
Liver tissue was fixed in 10% formalin and were paraffin-embedded. Four-micrometer sections were stained with Masson Trichrome, hematoxylin-eosin, anti–alpha-smooth muscle actin (α-SMA), anti-vimentin, and anti-hepatocyte by the Tufts-New England Medical Center Histology Core. Lipid laden cells were quantified by counting the number of foamy cells per field at 200× magnification (500 cells per field). Ten fields were examined per liver; three to eight animals were evaluated per treatment group.
Detection of Apoptotic and Proliferating Cells
Apoptotic and proliferating cells in formalin-fixed, paraffin-embedded liver tissue sections were detected using the DeadEnd Fluorometric terminal deoxynucleotidyl transferase biotin-deoxyuridine triphosphate nick-end labeling (TUNEL) System (Promega, Madison, WI) and the BrdU In-Situ Detection Kit (BD Pharmingen, San Diego, CA) respectively. Procedures were done according to the manufacturer's protocol. For proliferating cells, animals were injected with BrdU (50 mg/kg) intraperitoneally 2 hours before sacrifice. The percentage of apoptotic and proliferating cells was determined by counting the number of positively stained cells per 10 random 200× fields (500 cells per field) per treatment group.
Results
Administration of NPC1 ASO Leads to Knockdown of NPC1 Protein Levels in Visceral Organs but not the Brain
Wild-type BALB/c mice were injected twice weekly with a NPC1 ASO, a mismatched control ASO, or vehicle. NPC1 protein levels in the liver were knocked down after 2 weeks of ASO treatment (Fig. 1A), whereas NPC1 protein levels in mismatched ASO-treated mice were indistinguishable from that in vehicle-treated mice (data not shown). The liver and kidney represent the primary sites for 2′-O-methoxyethyl–modified ASOs following systemic administration.24 Nine weeks of NPC1 ASO treatment had modest effect on NPC1 protein levels in the lung, and no effect in the brain, heart, spleen, or kidney (Fig. 1B). NPC1 ASO treatment had no effect on NPC1L1 levels in the liver (Fig. 1C); however, NPC2 levels were increased by NPC1 ASO treatment, which is consistent with reports in the NPCnih mouse.28 These data indicate that NPC1 ASO is specific for NPC1 and not other homologous genes.
Fig. 1.

Expression of NPC1, NPC1L1, and NPC2 in mismatched (MM) ASO–treated and NPC1 ASO–treated mice. (A) NPC1 western blot using liver homogenates from different time points and (B) multiple tissues at the 9 week time point. (C) NPC1L1 and NPC2 western blot with 9 week liver homogenate. Immunoblots of glyceraldehyde 3-phosphate dehydrogenase (GAPDH) and actin were used as internal controls.
Knockdown of NPC1 Induces Hepatomegaly, Cholesterol Storage, and Altered Serum Lipoprotein Levels
NPCnih mice show significant weight loss by 7 weeks of age, at which time their neurological disease is marked16; however, NPC1 ASO-treated mice showed no decline in body weight as compared to mismatched ASO-treated animals (Fig. 2A). There was a significant increase in the absolute weight of liver tissue (Fig. 2B) as well as the relative liver weight (Fig. 2C) in the NPC1 ASO-treated mice. NPC1 ASO treatment significantly increased the amount of unesterified cholesterol stored in the liver to approximately 10−20 times that of the mismatch control (Table 1). However, in the spleen and lung where NPC knockdown was nominal, the unesterified cholesterol content was not significantly altered (Table 1).
Fig. 2.
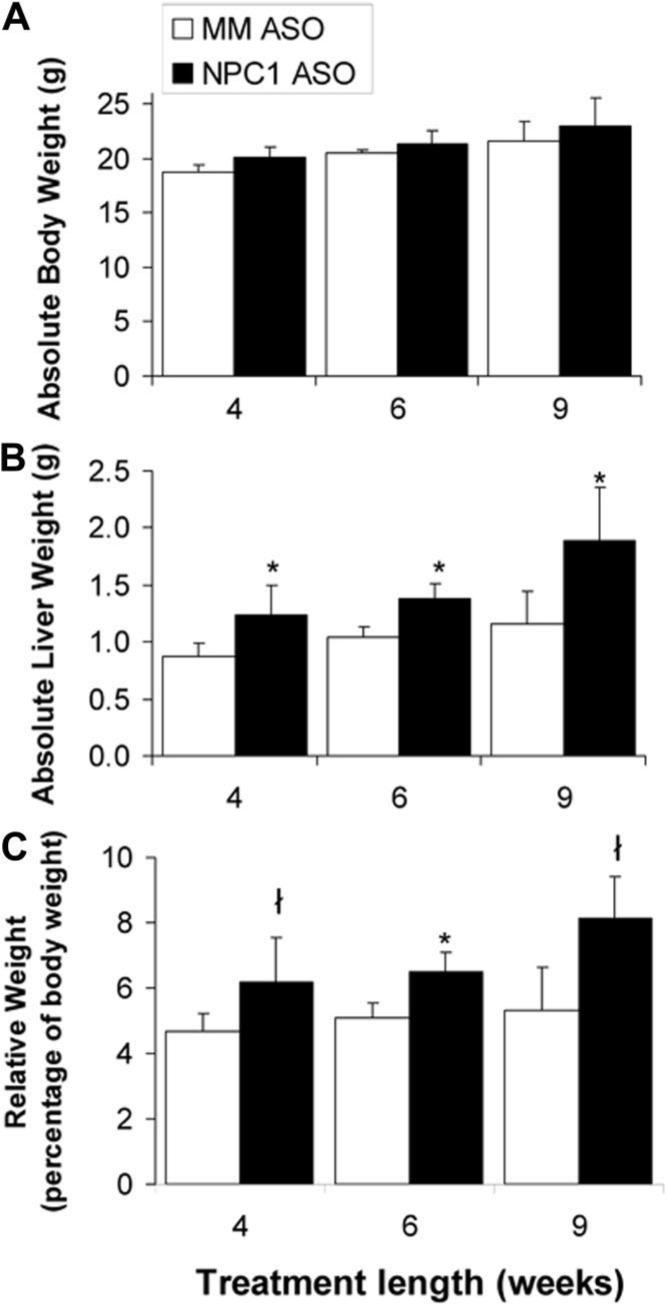
The effect of NPC1 knockdown on whole-body and liver weights. Absolute (A) body and (B) liver weights are shown of mice treated for 4, 6, and 9 weeks with mismatched (MM) ASOs and NPC1 ASOs. The weight of the liver (C) is also presented as a percentage of whole-body weight. Each bar represents the mean ± SD of nine to 13 animals in each treatment group. *P < 0.001, ł P < 0.05 when compared to mismatched ASO–treated mice as determined by Student t test.
Table 1.
Unesterified Cholesterol Content of Liver, Spleen, and Lung
| Liver Weeks | MM ASO n = 3 | Unesterified Cholesterol (mg/organ) NPC1 ASO n = 3 |
|---|---|---|
| 4 | 1.89 ± 0.57 | 13.06 ± 3.15* |
| 6 | 1.52 ± 0.50 | 7.04 ± 2.40* |
| 9 | 1.09 ± 0.24 | 24.95 ± 8.05* |
| Liver Weeks | Unesterified Cholesterol (μg/μg protein) MM ASO n = 3 | NPC1 ASO n = 3 |
|---|---|---|
| 4 | 0.012 ± 0.003 | 0.085 ± 0.018* |
| 6 | 0.011 ± 0.006 | 0.046 ± 0.009* |
| 9 | 0.008 ± 0.003 | 0.085 ± 0.014* |
| Spleen Weeks | Unesterified Cholesterol (μg/μg protein) MM ASO n = 3 | NPC1 ASO n = 3 |
|---|---|---|
| 4 | 0.037 ± 0.011 | 0.045 ± 0.005 |
| 6 | 0.032 ± 0.005 | 0.030 ± 0.002 |
| 9 | 0.032 ± 0.009 | 0.044 ± 0.019 |
| Lung Weeks | Unesterified Cholesterol (μg/μg protein) MM ASO n = 3−5 | NPC1 ASO n = 3−5 |
|---|---|---|
| 4 | 0.13 ± 0.03 | 0.22 ± 0.08 |
| 6 | 0.12 ± 0.06 | 0.12 ± 0.03 |
| 9 | 0.13 ± 0.08 | 0.20 ± 0.13 |
Values are means ± SD.
P < 0.001
Four weeks of NPC1 knockdown produced no significant effect on serum lipoprotein levels; however, serum total cholesterol, LDL-cholesterol, and HDL-cholesterol levels were increased by 6 and 9 weeks of NPC1 knockdown (Table 2). The NPCnih mouse has been shown to exhibit no change,29 decreases,18 or increases in serum cholesterol, HDL-cholesterol,30 and LDL-cholesterol levels.30-32
Table 2.
Serum Chemistries After NPC1 ASO Treatment
|
4 Weeks |
6 Weeks |
9 Weeks |
||||
|---|---|---|---|---|---|---|
| Analyte | MM ASO n = 3 | NPC1 ASO n = 5 | MM ASO n = 2 | NPC1 ASO n = 5 | MM ASO n = 3 | NPC1 ASO n = 5 |
| Cholesterol | 62.8 ± 17.1 | 73.3 ± 11.0 | 65.7 | 103.5 ± 19.1 | 41.3 ± 5.1 | 98.2 ± 24.7* |
| LDL-Cholesterol | 28.0 ± 6.2 | 19.6 ± 6.3 | 22.0 | 41.5 ± 8.3 | 11.3 ± 0.06 | 43.8 ± 13.3* |
| HDL-Cholesterol | 38.7 ± 6.2 | 35.4 ± 10.5 | 34.0 | 50.0 ± 10.4 | 22.7 ± 4.5 | 46.2 ± 8.8* |
| Triglycerides | 27.7 ± 4.5 | 39.6 ± 8.6 | 57.5 | 59.3 ± 3.9 | 36.0 ± 5.3 | 41.4 ± 5.0 |
| Bile Acids* | 8.4 ± 1.2 | 9.05 ± 3.2 | 9.95 | 16.0 ± 12.7 | 40.3 ± 17.2 | 127.8 ± 134.7 |
| Alkaline Phosphatase† | 111.5 ± 16.0 | 106.0 ± 17.2 | 107.0 ± 19.5 | 60.75 ± 15.6 | 60.7 ± 20.6 | 74.0 ± 10.4 |
Values are means ± SD.
P < 0.01. Units are mg/dL
μmol/L, or
units/L.
Knockdown of NPC1 Increases Serum ALT and AST, Indicating Liver Damage
We next determined if NPC1 ASO treatment induces liver damage by measuring serum levels of the liver enzymes alanine aminotransferase (ALT) and aspartate aminotransferase (AST). ALT activity was elevated in NPC1 ASO–treated animals starting at 4 weeks of treatment and remained unchanged in the mismatched ASO–treated animals (Fig. 3A). Serum AST was unaffected by NPC1 knockdown until 9 weeks of NPC1 ASO treatment (Fig. 3B). The mismatched ASO animals had AST and ALT levels equivalent to those of saline-treated animals for all time points (data not shown). Our values were always above the range of values reported by other investigators15,16,32; however, our control values match those of other Tufts University investigators. These results suggest that NPC1 knockdown decreased the integrity of the hepatic tissue. The serum alkaline phosphatase levels remained unchanged (Table 2) which is consistent with previous studies.16 To better assess liver function, fasting serum bile acid levels were measured. NPC1 ASO–treated mice had elevated levels of bile acids compared to mismatched controls (Table 2), suggesting impaired liver function. There was no change in either serum bilirubin or serum albumin, indicating no alteration in hepatic protein synthesis which is characteristic of late-stage liver disease (data not shown). These data are consistent with findings in the NPCnih mouse model.16-18
Fig. 3.
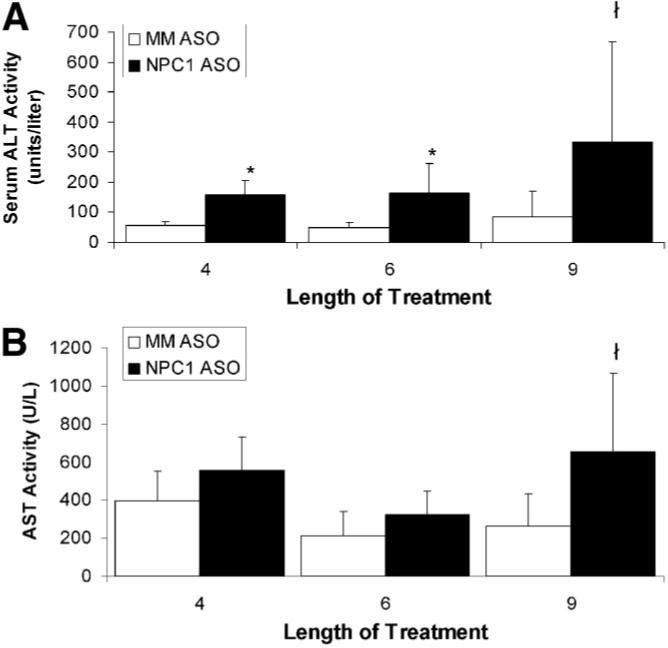
The effect of NPC1 knockdown on plasma liver enzyme levels. (A) Alanine aminotransferase (ALT) and (B) aspartate aminotransferase (AST) from mice treated with mismatched (MM) ASOs and NPC1 ASOs for 4, 6, and 9 weeks. Each bar represents the mean ± SD for 6 to 13 animals per treatment group. *P < 0.01, ł P < 0.05 when compared to mismatched ASO–treated mice as determined by Student t test.
Alterations in Hepatic Gene Expression Upon NPC1 ASO Treatment
To better understand the molecular mechanisms responsible for hepatic cholesterol accumulation, we analyzed the expression of genes involved in hepatic cholesterol uptake (ATP-binding cassette A1 [ABCA1], low-density lipoprotein [LDL] receptor, scavenger receptor class B type I [SR-BI]), synthesis (3-hydroxy-3-methyl-glutaryl-coenzyme A [HMG-CoA] synthase, HMG-CoA reductase, Liver X receptor [LXR], sterol response element binding protein 2 [SREBP2]), catabolism (cytochrome P450 7A1 [CYP7A1]), and bile secretion (ATP-binding cassette B4 [ABCB4], ATP-binding cassette B11 [ABCB11], ATP-binding cassette G5 [ABCG5], and ATP-binding cassette G8 [ABCG8]). NPC1 ASO induced up-regulation of these genes when compared to mismatched ASO control. Some genes were up-regulated only two-fold to three-fold for all time points, whereas others showed significant differences with time when analyzed by analysis of variance (Table 3). It is well documented that NPC cells are unable to respond to unesterified cholesterol that traffics through the endocytic pathway, which leads to constitutive activation of sterol regulatory element binding protein (SREBP)-mediated gene expression.33-35 Interestingly, TNF-RI expression was elevated upon NPC1 ASO treatment, implicating the TNF pathway in the pathogenesis of NPC disease, which is consistent with previous findings in patients and mice.16,36
Table 3.
Fold mRNA Expression in NPC1 ASO Liver Tissue
| Gene Name | 4 Weeks | 6 Weeks | 9 Weeks | P value |
|---|---|---|---|---|
| ABCB4 | 3.0 ± 1.7 | 3.8 ± 2.6 | 9.6 ± 5.7 | 0.07 |
| ABCB11 | 11.9 ± 1.4 | 18.0 ± 2.8 | 67.0 ± 34.6 | 0.001 |
| LXR alpha | 13.2 ± 3.1 | 13.8 ± 4.5 | 50.3 ± 31.0 | 0.06 |
| SREBP2 | 1.8 ± 0.6 | 39.3 ± 3.9 | 47.3 ± 26.3 | 0.001 |
| ABCG5 | 3.9 ± 1.3 | 2.9 ± 0.9 | 4.3 ± 2.3 | 0.34 |
| ABCG8 | 1.4 ± 0.2 | 2.0 ± 1.2 | 2.0 ± 0.4 | 0.55 |
| HMG CoA synthase | 6.9 ± 3.0 | 30.5 ± 20.8 | 80.9 ± 56.9 | 0.008 |
| HMG CoA reductase | 24.0 ± 17.5 | 13.1 ± 1.2 | 30.1 ± 10.5 | 0.15 |
| SR-BI | 10.9 ± 3.7 | 23.6 ± 12.5 | 18.5 ± 11.0 | 0.15 |
| Cyp7A1 | 14.3 ± 5.3 | 21.8 ± 15.4 | 86.3 ± 47.1 | 0.005 |
| LDLr | 15.5 ± 7.2 | 17.4 ± 10.7 | 14.7 ± 7.6 | 0.99 |
| ABCA1 | 2.4 ± 1.2 | 0.8 ± 0.7 | 2.3 ± 0.6 | 0.0004 |
| TNF-RI | 1.8 ± 0.2 | 3.0 ± 0.6 | 2.4 ± 0.7 | 0.26 |
The mRNA relative expression level in the MM ASO control mice was set to 1.0. These data were analyzed by ANOVA. Values were all normalized to GAPDH. N = 3.
Histological Changes in the Liver Due to NPC1 ASO Treatment
In sections of mismatched ASO-treated mouse livers, less than 1% of cells were foamy and vacuolated (Fig. 4A,B), whereas 7%−12% of cells were foamy and vacuolated in the NPC1 ASO–treated mouse liver sections (Fig. 4A,C, arrowhead). The majority of these lipid-laden cells were not hepatocytes because they did not stain with anti-hepatocyte antibody (Fig. 4D); instead, the lipid-laden cells were stained with anti-vimentin (Fig. 4E), which identifies mesenchymal cells, such as blood cells and vessels, connective tissue, and lymphatics. The cells appeared to be macrophages, which is consistent with findings in the NPCnih mouse model.15,16
Fig. 4.

Hepatic lipid accumulation and fibrosis in mismatched (MM) ASO–treated and NPC1 ASO–treated mice. (A) Quantification of lipid laden cells where each bar represents the mean ± SD from three to five animals in each treatment group. *P < 0.001 when compared to mismatched ASO–treated as determined by Student t test. Hematoxylin-eosin–stained liver sections from mice treated for 9 weeks with mismatched (B) ASOs and (C) NPC1 ASOs. The arrowhead points to a cluster of lipid-laden cells; the arrow indicates a site of inflammation. Anti-Hepatocyte (D) and anti-vimentin (E) stained liver sections from mice treated for 9 weeks with NPC1 ASOs. The arrowhead (D) points to a hepatocyte positively stained with anti-hepatocyte and the black arrows in both (D) and (E) represent sites of lipid accumulation. Trichrome-staining of liver sections from mice treated for 9 weeks with (F) mismatched ASOs and (G) NPC1 ASOs reveals collagen deposition as indicated by blue staining. (H) Collagen is interspersed throughout clusters of lipid-laden cells. PV, portal vein; CV, central vein.
Increased extramedullary hematopoiesis and sinusoidal dilation were also noted in NPC1 ASO–treated mice at the 9-week time point, whereas scattered necrotic hepatocytes were present at all time points in the NPC1 ASO–treated liver. Inflammatory cells were present in NPC1 ASO–treated mouse liver sections, particularly in areas of foamy macrophage accumulation (Fig. 4C, arrow). Macrophage infiltration has also been characterized in NPCnih mouse liver.15 Trichrome staining of mismatched ASO–treated mouse liver sections revealed normal collagen lining the blood vessels (Fig. 4F), whereas that of NPC1 ASO–treated liver sections exhibited collagen deposition interspersed throughout the foamy macrophages and surrounding parenchyma (Fig. 4G,H). At 4 and 6 weeks, collagen was deposited surrounding lipid accumulations near the vessels. By 9 weeks, collagen was not only in vessel areas, but also within the parenchyma.
NPC1 ASO Treatment Leads to Increased Apoptosis and Proliferation
In the NPCnih mouse model, both neurons and hepatocytes have been reported to undergo apoptosis.15,16,36 Approximately 0.1% of cells were identified as apoptotic in mismatched ASO–treated liver sections at all time points, whereas approximately 1% of cells were apoptotic after 4, 6, or 9 weeks of NPC1 ASO treatment (Fig. 5A). Figure 5B,C shows representative TUNEL-stained sections of mismatched ASO–treated and NPC ASO–treated liver, respectively. Similar numbers of apoptotic cells were also detected by examining sections stained with hematoxylin and eosin for cells with condensed nuclei. This identified the apoptotic cells as hepatocytes.
Fig. 5.

NPC1 knockdown leads to increased apoptosis. Liver sections of mismatched (MM) ASO–treated and NPC1 ASO–treated mice were subjected to fluorometric TUNEL staining. (A) Quantification of apoptotic cells where each bar represents the mean ± SD from three to five animals in each treatment group. Liver sections from mice treated for 6 weeks with (B) mismatched ASOs and (C) NPC1 ASOs. *P < 0.0001, ł P < 0.01 when compared to mismatched ASO–treated mice as determined by Student t test.
At all time points, the number of proliferating cells was greater in the NPC1 ASO–treated samples than in the mismatched ASO–treated samples (Fig. 6A). Figure 6B,C shows representative sections of mismatched ASO–treated and NPC1 ASO–treated livers stained for BrdU. NPC1 knockdown led to proliferating cells in the sinusoids (Fig. 6C).
Fig. 6.

Cell proliferation is increased by NPC1 knockdown. (A) Quantification of proliferating cells where each bar represents the mean ± SD from three to five animals in each treatment group. Liver sections from mice treated for 9 weeks with (B) mismatched ASOs and (C) NPC1 ASOs. The arrowhead points to a stellate cell with anti-BrdU-HRP reaction product. Immunohistochemistry for α-SMA was performed on liver sections from mice treated for 9 weeks with (D) mismatched ASO and (E) NPC1 ASOs. The arrow points to an α-SMA–positive stellate cell. ł P < 0.01, * P < 0.00001 when compared to mismatched ASO–treated mice as determined by Student t test.
The observed fibrosis suggested that the proliferative cells were likely hepatic stellate cells. Stellate cells are normally quiescent perisinusoidal fat-storing cells; however, after liver injury, they become activated and transform into proliferative and fibrogenic myofibroblasts.37 Stellate cells produce most of the extracellular matrix that is laid down upon liver injury, such as the collagen deposition seen after NPC1 ASO treatment (Fig. 4G,H). To identify stellate cells, we performed immunohistochemistry with an antibody against α-SMA, a marker of activated stellate cells. Mismatched ASO–treated liver sections showed few cells with α-SMA staining (Fig. 6D); however, NPC1 knockdown led to a proliferation of α-SMA–expressing cells lining the sinusoids (Fig. 6E). These cells also had a more granular appearance, which is characteristic of activated stellate cells due to increased endoplasmic reticulum and depleted vitamin A stores.38
Discussion
The goal of our study was to develop a novel NPC disease model in which the liver disease predominates over the neurological disease. In our model, wild-type mice injected with NPC1 ASO completely ablated hepatic NPC1 protein expression. NPC1 knockdown was confined to the liver and, to a lesser extent, the lung. There was no effect on NPC1 levels in the brain or on behavior of the mice. Phenotypic characteristics of the NPC1 knockdown mice closely resemble that of the NPCnih mice.16,17 They exhibited hepatomegaly, hepatic unesterified cholesterol storage, elevated serum liver enzymes, fibrosis, and formation of foamy, vacuolated macrophages which, in turn, recruited inflammatory cell infiltrates. The signals involved in the inflammatory recruitment are not defined. It is not clear whether the signals are generated from engorged macrophages or hepatocytes which can both release proinflammatory signaling molecules such as TNF-alpha and transforming growth factor-beta.
Both apoptotic and proliferative responses were initiated by NPC1 knockdown. Approximately 1% of hepatic cells underwent apoptosis, primarily representing hepatocytes. A loss of 1% of the liver's hepatocytes every 24−72 hours would severely diminish liver mass with time; however, the rate of cell death appeared offset by proliferation of hepatic stellate cells. Stellate cells are responsible for collagen deposition and are critical mediators of fibrosis. The replacement of hepatocytes with fibrotic tissue likely leads to loss of liver function, potentiating the observed increases in plasma liver aminotransferases. Both hepatocyte cell death and stellate cell proliferation may be caused by signaling from foamy macrophages.
Unlike the NPCnih mice, the NPC1 knockdown mice showed no loss of body weight and no obvious neurological symptoms. They exhibited increased serum total cholesterol and LDL and HDL levels, whereas findings are variable for the NPCnih mouse, that is, no change,29 decreased,18 or increased.31,32 We also observed fibrosis, which is not observed in chow-fed NPCnih mice15 but is when NPCnih mice are fed a high-fat diet17 and in the feline model of NPC disease.39 It is possible that the NPCnih mice do not develop fibrosis because of their shortened lifespan.
The NPC1 knockdown mouse model has several useful features. The model can be established in any strain of wild-type mouse, which alleviates the problem of maintaining a breeding colony of heterozygous NPCnih mice. Also, NPC1 ASOs can be administered to any other knockout/transgenic mouse model or in conjunction with an ASO targeting another gene. Our future work will focus on determining which signaling cascades are activated by NPC1 dysfunction and lead to the proliferative and apoptotic responses. Findings from previous studies as well as ours implicate the TNF-alpha pathway as one target which is appealing because it is involved in both proinflammatory and apoptotic signaling cascades. It may be possible to alleviate both the fibrotic response and hepatocellular apoptosis by interfering with specific molecular targets downstream of the primary NPC1 disease–producing inactivation mutation. Preventative therapy for hepatocellular cell death, inflammation, and fibrosis is not only useful for patients with NPC but also for patients with many other liver diseases.
Acknowledgment
Special thanks to Lauren Richey, D.V.M., Joseph Alroy, D.V.M., and Cynthia Webster, D.V.M., for all their helpful insight regarding pathological liver disease. We also thank Laura Smukler and Marina Simeone-Penney for their technical expertise.
Supported by grants from the National Institutes of Health (R01 DK49564, R01 DK70592, and T32 DK07542), a predoctoral fellowship from the American Heart Association (0615665T), and the Center for Gastroenterology Research on Absorptive and Secretory Processes (P30 DK34928).
Abbreviations
- ALT
alanine aminotransferase
- ASO
antisense oligonucleotide
- AST
aspartate aminotransferase
- BrdU
bromodeoxyuridine
- HDL
high-density lipoprotein
- HRP
horseradish peroxidase
- LDL
low-density lipoprotein
- NPC
Niemann-Pick type C
- SD
standard deviation
- TNF
tumor necrosis factor
- TUNEL
terminal deoxynucleotidyl transferase biotin-deoxyuridine triphosphate nick-end labeling.
Footnotes
Potential conflict of interest: Drs. Crooke and Graham own stock in Isis Pharmaceutical.
References
- 1.Patterson MC, Vanier MT, Suzuki MT, Morris JA, Carstea E, Neufeld EB, Blanchette-Mackie JE, Pentchev PG. The Metabolic and Molecular Bases for Inherited Diseases. McGraw-Hill; New York: 2000. pp. 2625–2640. [Google Scholar]
- 2.Vanier MT, Millat G. Niemann-Pick disease type C. Clin Genet. 2003;64:269–281. doi: 10.1034/j.1399-0004.2003.00147.x. [DOI] [PubMed] [Google Scholar]
- 3.Kelly DA, Portmann B, Mowat AP, Sherlock S, Lake BD. Niemann-Pick disease type C: diagnosis and outcome in children, with particular reference to liver disease. J Pediatr. 1993;123:242–247. doi: 10.1016/s0022-3476(05)81695-6. [DOI] [PubMed] [Google Scholar]
- 4.Yerushalmi B, Sokol RJ, Narkewicz MR, Smith D, Ashmead JW, Wenger DA. Niemann-pick disease type C in neonatal cholestasis at a North American Center. J Pediatr Gastroenterol Nutr. 2002;35:44–50. doi: 10.1097/00005176-200207000-00011. [DOI] [PubMed] [Google Scholar]
- 5.Vanier MT, Duthel S, Rodriguez-Lafrasse C, Pentchev P, Carstea ED. Genetic heterogeneity in Niemann-Pick C disease: a study using somatic cell hybridization and linkage analysis. Am J Hum Genet. 1996;58:118–125. [PMC free article] [PubMed] [Google Scholar]
- 6.Rutledge JC. Progressive neonatal liver failure due to type C Niemann-Pick disease. Pediatr Pathol. 1989;9:779–784. doi: 10.3109/15513818909022387. [DOI] [PubMed] [Google Scholar]
- 7.Putterman C, Zelingher J, Shouval D. Liver failure and the sea-blue his-tiocyte/adult Niemann-Pick disease. Case report and review of the literature. J Clin Gastroenterol. 1992;15:146–149. doi: 10.1097/00004836-199209000-00013. [DOI] [PubMed] [Google Scholar]
- 8.Dumontel C, Girod C, Dijoud F, Dumez Y, Vanier MT. Fetal Niemann-Pick disease type C: ultrastructural and lipid findings in liver and spleen. Virchows Arch A Pathol Anat Histopathol. 1993;422:253–259. doi: 10.1007/BF01621810. [DOI] [PubMed] [Google Scholar]
- 9.Reif S, Spirer Z, Messer G, Baratz M, Bembi B, Bujanover Y. Severe failure to thrive and liver dysfunction as the main manifestations of a new variant of Niemann-Pick disease. Clin Pediatr (Phila) 1994;33:628–630. doi: 10.1177/000992289403301010. [DOI] [PubMed] [Google Scholar]
- 10.Fu LS, Wu TC, Lai CR, Huang B. Niemann-Pick disease type C presenting as neonatal hepatitis: report of one case. Zhonghua Min Guo Xiao Er Ke Yi Xue Hui Za Zhi. 1995;36:221–226. [PubMed] [Google Scholar]
- 11.Zhou H, Linke RP, Schaefer HE, Mobius W, Pfeifer U. Progressive liver failure in a patient with adult Niemann-Pick disease associated with generalized AL amyloidosis. Virchows Arch. 1995;426:635–639. doi: 10.1007/BF00192120. [DOI] [PubMed] [Google Scholar]
- 12.Dietschy JM, Turley SD, Spady DK. Role of liver in the maintenance of cholesterol and low density lipoprotein homeostasis in different animal species, including humans. J Lipid Res. 1993;34:1637–1659. [PubMed] [Google Scholar]
- 13.Vance JE. Lipid imbalance in the neurological disorder, Niemann-Pick C disease. FEBS Lett. 2006;580:5518–5524. doi: 10.1016/j.febslet.2006.06.008. [DOI] [PubMed] [Google Scholar]
- 14.Carstea ED, Morris JA, Coleman KG, Loftus SK, Zhang D, Cummings C, et al. Niemann-Pick C1 disease gene: homology to mediators of cholesterol homeostasis. Science. 1997;277:228–231. doi: 10.1126/science.277.5323.228. [DOI] [PubMed] [Google Scholar]
- 15.Beltroy EP, Liu B, Dietschy JM, Turley SD. Lysosomal unesterified cholesterol content correlates with liver cell death in murine Niemann-Pick type C disease. J Lipid Res. 2007;48:869–881. doi: 10.1194/jlr.M600488-JLR200. [DOI] [PubMed] [Google Scholar]
- 16.Beltroy EP, Richardson JA, Horton JD, Turley SD, Dietschy JM. Cholesterol accumulation and liver cell death in mice with Niemann-Pick type C disease. Hepatology. 2005;42:886–893. doi: 10.1002/hep.20868. [DOI] [PubMed] [Google Scholar]
- 17.Erickson RP, Bhattacharyya A, Hunter RJ, Heidenreich RA, Cherrington NJ. Liver disease with altered bile acid transport in Niemann-Pick C mice on a high-fat, 1% cholesterol diet. Am J Physiol Gastrointest Liver Physiol. 2005;289:G300–G307. doi: 10.1152/ajpgi.00568.2004. [DOI] [PubMed] [Google Scholar]
- 18.Garver WS, Jelinek D, Oyarzo JN, Flynn J, Zuckerman M, Krishnan K, et al. Characterization of liver disease and lipid metabolism in the Niemann-Pick C1 mouse. J Cell Biochem. 2007;101:498–516. doi: 10.1002/jcb.21200. [DOI] [PubMed] [Google Scholar]
- 19.Kulinski A, Vance JE. Lipid homeostasis and lipoprotein secretion in Niemann-Pick C1-deficient hepatocytes. J Biol Chem. 2007;282:1627–1637. doi: 10.1074/jbc.M610001200. [DOI] [PubMed] [Google Scholar]
- 20.Langmade SJ, Gale SE, Frolov A, Mohri I, Suzuki K, Mellon SH, et al. Pregnane X receptor (PXR) activation: a mechanism for neuroprotection in a mouse model of Niemann-Pick C disease. Proc Natl Acad SciUSA. 2006;103:13807–13812. doi: 10.1073/pnas.0606218103. [DOI] [PMC free article] [PubMed] [Google Scholar]
- 21.Loftus SK, Erickson RP, Walkley SU, Bryant MA, Incao A, Heidenreich RA, et al. Rescue of neurodegeneration in Niemann-Pick C mice by a prion-promoter-driven Npc1 cDNA transgene. Hum Mol Genet. 2002;11:3107–3114. doi: 10.1093/hmg/11.24.3107. [DOI] [PubMed] [Google Scholar]
- 22.Liu Y, Wu YP, Wada R, Neufeld EB, Mullin KA, Howard AC, et al. Alleviation of neuronal ganglioside storage does not improve the clinical course of the Niemann-Pick C disease mouse. Hum Mol Genet. 2000;9:1087–1092. doi: 10.1093/hmg/9.7.1087. [DOI] [PubMed] [Google Scholar]
- 23.Crooke RM, Graham MJ, Lemonidis KM, Whipple CP, Koo S, Perera RJ. An apolipoprotein B antisense oligonucleotide lowers LDL cholesterol in hyperlipidemic mice without causing hepatic steatosis. J Lipid Res. 2005;46:872–884. doi: 10.1194/jlr.M400492-JLR200. [DOI] [PubMed] [Google Scholar]
- 24.Geary RS, Watanabe TA, Truong L, Freier S, Lesnik EA, Sioufi NB, et al. Pharmacokinetic properties of 2′-O-(2-methoxyethyl)-modified oligonucleotide analogs in rats. J Pharmacol Exp Ther. 2001;296:890–897. [PubMed] [Google Scholar]
- 25.Folch J, Lees M, Sloane Stanley GH. A simple method for the isolation and purification of total lipides from animal tissues. J Biol Chem. 1957;226:497–509. [PubMed] [Google Scholar]
- 26.Yu L, Gupta S, Xu F, Liverman AD, Moschetta A, Mangelsdorf DJ, et al. Expression of ABCG5 and ABCG8 is required for regulation of biliary cholesterol secretion. J Biol Chem. 2005;280:8742–8747. doi: 10.1074/jbc.M411080200. [DOI] [PubMed] [Google Scholar]
- 27.Repa JJ, Turley SD, Quan G, Dietschy JM. Delineation of molecular changes in intrahepatic cholesterol metabolism resulting from diminished cholesterol absorption. J Lipid Res. 2005;46:779–789. doi: 10.1194/jlr.M400475-JLR200. [DOI] [PubMed] [Google Scholar]
- 28.Klein A, Amigo L, Retamal MJ, Morales MG, Miquel JF, Rigotti A, et al. NPC2 is expressed in human and murine liver and secreted into bile: potential implications for body cholesterol homeostasis. Hepatology. 2006;43:126–133. doi: 10.1002/hep.20985. [DOI] [PubMed] [Google Scholar]
- 29.Xie C, Turley SD, Dietschy JM. Centripetal cholesterol flow from the extrahepatic organs through the liver is normal in mice with mutated Niemann-Pick type C protein (NPC1). J Lipid Res. 2000;41:1278–1289. [PubMed] [Google Scholar]
- 30.Wang MD, Franklin V, Sundaram M, Kiss RS, Ho K, Gallant M, et al. Differential regulation of ATP binding cassette protein A1 expression and ApoA-I lipidation by Niemann-Pick type C1 in murine hepatocytes and macrophages. J Biol Chem. 2007;282:22525–22533. doi: 10.1074/jbc.M700326200. [DOI] [PubMed] [Google Scholar]
- 31.Xie C, Turley SD, Dietschy JM. Cholesterol accumulation in tissues of the Niemann-pick type C mouse is determined by the rate of lipoprotein-cholesterol uptake through the coated-pit pathway in each organ. Proc Natl Acad SciUSA. 1999;96:11992–11997. doi: 10.1073/pnas.96.21.11992. [DOI] [PMC free article] [PubMed] [Google Scholar]
- 32.Amigo L, Mendoza H, Castro J, Quinones V, Miquel JF, Zanlungo S. Relevance of Niemann-Pick type C1 protein expression in controlling plasma cholesterol and biliary lipid secretion in mice. Hepatology. 2002;36:819–828. doi: 10.1053/jhep.2002.35617. [DOI] [PubMed] [Google Scholar]
- 33.Liscum L, Faust JR. Low density lipoprotein (LDL)-mediated suppression of cholesterol synthesis and LDL uptake is defective in Niemann-Pick type C fibroblasts. J Biol Chem. 1987;262:17002–17008. [PubMed] [Google Scholar]
- 34.Reddy JV, Ganley IG, Pfeffer SR. Clues to neuro-degeneration in Niemann-Pick Type C disease from global gene expression profiling. PLoS ONE. 2006;1:e19. doi: 10.1371/journal.pone.0000019. [DOI] [PMC free article] [PubMed] [Google Scholar]
- 35.Ory DS. The niemann-pick disease genes; regulators of cellular cholesterol homeostasis. Trends Cardiovasc Med. 2004;14:66–72. doi: 10.1016/j.tcm.2003.12.003. [DOI] [PubMed] [Google Scholar]
- 36.Wu YP, Mizukami H, Matsuda J, Saito Y, Proia RL, Suzuki K. Apoptosis accompanied by up-regulation of TNF-alpha death pathway genes in the brain of Niemann-Pick type C disease. Mol Genet Metab. 2005;84:9–17. doi: 10.1016/j.ymgme.2004.08.017. [DOI] [PubMed] [Google Scholar]
- 37.Alvelius G, Hjalmarson O, Griffiths WJ, Bjorkhem I, Sjovall J. Identification of unusual 7-oxygenated bile acid sulfates in a patient with Niemann-Pick disease, type C. J Lipid Res. 2001;42:1571–1577. [PubMed] [Google Scholar]
- 38.Maher JJ. Hepatic fibrosis caused by alcohol. Semin Liver Dis. 1990;10:66–74. doi: 10.1055/s-2008-1040458. [DOI] [PubMed] [Google Scholar]
- 39.Somers KL, Brown DE, Fulton R, Schultheiss PC, Hamar D, Smith MO, et al. Effects of dietary cholesterol restriction in a feline model of Niemann-Pick type C disease. J Inherit Metab Dis. 2001;24:427–436. doi: 10.1023/a:1010588112003. [DOI] [PubMed] [Google Scholar]