Abstract
Heart failure due to coronary artery disease has considerable morbidity and poor prognosis. An understanding of the underlying mechanics governing myocardial contraction is a prerequisite for interpreting and predicting changes induced by heart disease. Gross changes in contractile behaviour of the myocardium are readily detected with existing techniques. For more subtle changes during early stages of cardiac dysfunction, however, a sensitive method for measuring, as well as a precise criterion for quantifying, normal and impaired myocardial function is required. The purpose of this paper is to outline the role of imaging, particularly cardiovascular magnetic resonance (CMR), for investigating the fundamental relationships between cardiac morphology, function and flow. CMR is emerging as an important clinical tool owing to its safety, versatility and the high-quality images it produces that allow accurate and reproducible quantification of cardiac structure and function. We demonstrate how morphological and functional assessment of the heart can be achieved by CMR and illustrate how blood flow imaging can be used to study flow and structure interaction, particularly for elucidating the underlying haemodynamic significance of directional changes and asymmetries of the cardiac looping. Future outlook on combining imaging with engineering approaches in subject-specific biomechanical simulation is also provided.
Keywords: flow, myocardium, cardiac, magnetic resonance, imaging
1. Introduction
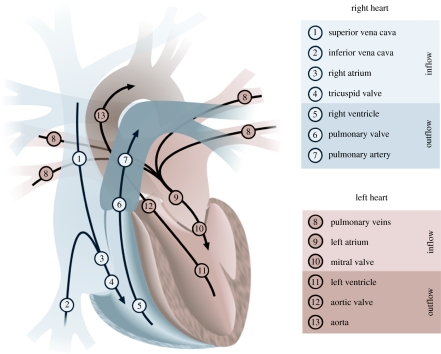
Understanding the structure of the heart and its relation to myocardial function is a challenging problem that has troubled anatomists and physiologists for centuries. The illustration in figure 1 depicts the principal blood flows within the heart. The superior and inferior venae cavae (SVC; IVC) are the veins that bring blood from the upper and lower body to the right atrium. The blood then enters through the tricuspid valve (TV) to the right ventricle. From there it is pumped through the pulmonary valve entering the pulmonary artery and then through to the lungs to be reoxygenated. Once reoxygenated, the blood is carried back to the heart through the pulmonary veins to be circulated to the rest of the body. It enters the left atrium and, once filled, the blood passes through the mitral valve into the left ventricle (LV). The LV does the majority of the work by then pumping the blood through the aortic valve to the aorta and out to the rest of the body.
Figure 1.
The principal blood flows within the heart are shown. The heart is divided into two sides that control the pulmonary (1–7) and the systemic circulations (8–13). Each side of the heart comprises an atrium that acts as a temporary reservoir, a ventricle that generates pulsatile flow, and a pair of valves that ensure flow remains unidirectional.
Following a non-fatal heart attack, a natural process called myocardial remodelling can take place (McKay et al. 1986). This begins with the thinning of the damaged myocardium and follows with the gradual deformation of the surrounding healthy tissue (Mitchell et al. 1992). Over time, the morphological structure of the heart can become significantly affected. Although the mechanics that underlie the remodelling process are not fully understood, it is known that the size and location of the infarct can have a large impact on the way in which the condition develops (McKay et al. 1986). The study of fluid dynamics indicates that the morphological structure of a compliant vessel is inextricably linked to the flow that occurs within it (Hove et al. 2003). As ventricular flow can be affected by the early stages of the remodelling process, it is probable that the flow itself can help to dictate how the condition progresses. The investigation of the relationships between ventricular morphology and blood flow could therefore help to increase our understanding of myocardial remodelling.
Functional changes in the heart due to heart disease are closely linked to the fact that structural remodelling of the ventricle occurs at macro and microscopic levels. Features of remodelling are hypertrophy (the enlargement or overgrowth of an organ or part due to an increase in size of its constituent cells), disruption of the extracellular matrix and LV dilation. It is still not certain whether functional deterioration is caused by a defect in function of individual myocytes, a defect in the extracellular matrix or a combination of the two. By Laplace's law, an increase in the diameter of the ventricle places a greater mechanical burden on the myocytes. This means that structural remodelling leads to reduced efficiency of contraction, due to greater wall stress and increased work, even if the individual myocytes are healthy. On a functional level, the contraction properties of myocytes have been found to be impaired in failing hearts (Gerdes & Capasso 1995). It is thought that irregularities in important cellular processes explain these contractile changes. The overall effect of these irregularities is that the action potential is prolonged and the duration of contraction is increased, thereby reducing both the rates of contraction and relaxation.
An understanding of the underlying mechanics governing myocardial contraction is a prerequisite for interpreting and predicting changes induced by heart disease. To this end, imaging techniques have been developed for quantitative assessment of intrinsic myocardial motion. In vivo measurement of myocardial contractility, however, is not an easy task. Early techniques for quantifying myocardial motion were based on radio-opaque fiducial markers (Brower et al. 1978). These had the disadvantages of being invasive and restricted by the paucity of the physical markers. Even when this imaging method worked well for determining the position and movement of the endocardial and epicardial contours, it did not enable the assessment of intrinsic contractility of the myocardium. Nevertheless, its use made valuable steps towards the goal of creating a general mathematical formulation for the basic mechanics of the heart.
Thus far, the most commonly used imaging techniques for depicting cardiac morphology and function are radionuclide scintigraphy, electron beam computer tomography (CT), echocardiography and magnetic resonance imaging (MRI). Nuclear imaging is extensively used in perfusion studies. Perfusion imaging combined with physical or drug-induced stress is valuable in determining myocardial viability. Electron beam CT, on the other hand, allows assessment of coronary artery calcification and general morphology of the heart and major vessels. To provide indices such as ejection fraction, myocardial mass and chamber volumes, a contrast agent has to be used to allow demarcation of the chamber borders. Echocardiography is useful for detecting ventricular hypokinesis and dilatation of the left atrium and ventricle. Examination of the patient with stress induced, using exercise or drugs, can be employed to observe changes in ventricular function. The main disadvantages of this technique, however, are the limited acoustic windows into the body, which only allow velocity in certain directions to be measured, and low spatial resolution, which limits accuracy of strain rate information. The clear advantages of echocardiography are that it is relatively inexpensive, portable and does not use ionizing radiation, making it ideal for routine clinical use.
As an alternative approach, cardiovascular magnetic resonance (CMR) allows full flexibility in imaging oblique planes, and hence permits access to the intrinsic cardiac axes. It has the added advantage that measurements can be taken without relying on an oversimplified geometric model of the cardiovascular anatomy. It allows a range of indices to be measured, including ejection fraction, wall thickness, perfusion and blood flow. CMR is an established technique with a proven track record in diagnosing a variety of disorders, ranging from valvular disease and congenital heart disease to the more common ischaemic heart disease. For measuring myocardial contractility, CMR offers a number of possibilities including the measurement of myocardial velocities (Karwatowski et al. 1994) and the regional calculation of myocardial strain rate. The purpose of this paper is to provide an overview of the potential of CMR for investigating the fundamental relationships between cardiac morphology, function and flow.
2. Morphological and functional assessment of the heart with CMR
(a) Cardiac morphology and myocardial contractility
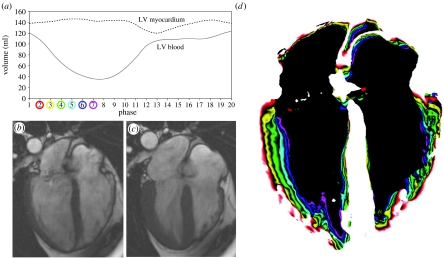
Contractility is defined as the ‘inherent capacity of the myocardium to contract independently of changes in the preload or afterload’ (Berne 1979). It is associated with the heart's inotropic state, i.e. its contractile state. Increased contractility of the heart refers to an increased rate of contraction to reach a greater peak force. Contractility is an important regulator of myocardial oxygen uptake. Factors that increase contractility include exercise, adrenergic stimulators, digitalis and other inotropic agents. In vivo measurement of myocardial contractility is a difficult task. Currently, pressure–volume curves are among the best approaches. However, the ventricular pressure needs to be measured invasively to obtain the full pressure–volume loop, making the technique less suitable for research. Imaging techniques may be used to assist the evaluation of ventricular function, and hence contractility. Thus far, different indices of contractility have been used as indicators of the status of the heart, including wall thickening and shortening, ejection fraction and stroke volume. LV ejection fraction is the most widely used index of LV function. It is defined as the ratio of the difference between end-systolic and end-diastolic volume to the total volume of the LV. CMR allows a great deal of flexibility in deriving these indices as images are anatomically correct and different functional and anatomical indices can be readily calculated. Figure 2 demonstrates the contraction of the normal LV as depicted by CMR. The graph illustrates the volume of the blood pool and myocardium over the cardiac cycle. It can be observed that the myocardial volume remains relatively constant except for small changes due to the varying quantity of blood within the myocardium. The graph was derived with the analysis of a subject-specific three-dimensional model of the heart reconstructed from a set of CMR images. Figure 2b,c shows, as an example, end-diastolic and end-systolic frames acquired using a 1.5 T CMR scanner with a TrueFISP sequence. It can be seen that the LV shortens in length towards end-systole while the wall thickness increases. Figure 2d depicts the motion of the endocardial wall during the contraction process, where the coloured bands represent the shape of the LV at different time points in the contraction process.
Figure 2.
(a) Volume of the blood and myocardium of a normal LV over the cardiac cycle; (b) end-diastolic (7 ms) and (c) end-systolic (332 ms) CMR images of the four chambers of the heart; (d) ventricular contraction (7–332 ms) map that demonstrates the progressive displacements of the endocardial border through systole.
For assessing myocardial contractility in a clinical environment, the technique currently being applied routinely is CMR tagging. CMR tagging (Zerhouni et al. 1988; Axel & Dougherty 1989) is a technique that allows the motion of myocardium to be imaged in a non-invasive manner. This is performed by artificially inducing landmarks within the myocardium. A regular pattern of magnetization is created with the application of radiofrequency pulses that saturate the magnetization of bands of tissue. The saturated tissue is unable to emit signal and is therefore depicted by dark straight lines within the first image acquired. As the magnetization of tissue remains saturated for a period of time, subsequent images within a cine sequence depict the motion of the tissue as the deformation of these saturation bands. This technique, however, does not permit high-resolution imaging of the motion, which is limited by the paucity of tags across the myocardium and tag fading that occurs during the cardiac cycle due to saturation recovery. It also requires time-consuming post-processing steps that often require extensive user intervention to ensure accurate tag tracking. For qualitative assessment, however, the technique allows the direct visual assessment of myocardial deformation.
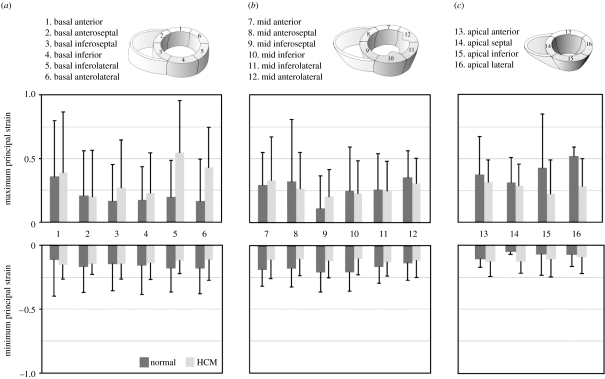
The technique of harmonic phase (HARP) magnetic resonance imaging uses the basic principles of CMR tagging to provide a direct way of calculating strain within the myocardium. It uses an artificially induced grid of magnetization that follows the tissue as it deforms. This spatial modulation of the magnetic resonance (MR) signal in the image domain contributes to spectral peaks in the frequency domain. These spectral peaks can be isolated to obtain the phase properties of the tags. Unlike the amplitude of the signal, the phase does not decrease significantly over the cardiac cycle. The slope of the phase can be used to directly calculate the strain of the myocardium. Both the imaging and the processing involved with HARP are rapid and sufficiently robust to provide a viable and clinically useful functional index of contractility (Osman et al. 1999). Figure 3 shows the results of a study performed using HARP imaging where the maximum and minimum principal strains for each of the segments of the LV myocardium were calculated for five normal subjects and eight hypertrophic cardiomyopathy (HCM) patients. The basal slice exhibited a higher maximum principal strain for the HCM patients. In the mid-ventricular slice and the apical slices, the maximum principal strain was generally lower in the HCM patients than in the normal patients.
Figure 3.
Maximum and minimum principal strain for 16 segments of the LV myocardium calculated using HARP imaging: (a) basal; (b) mid ventricular and (c) apical. Mean±s.d. values are shown for the five normal subjects and eight HCM patients.
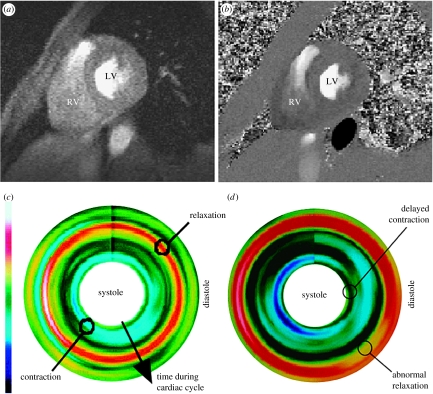
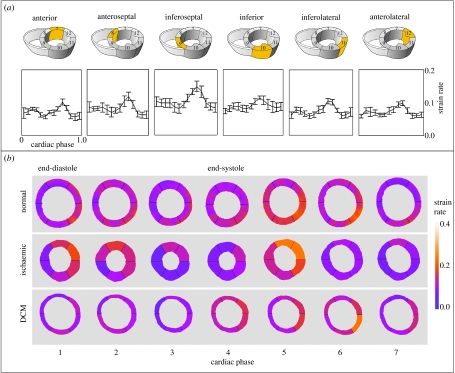
As an alternative to tagging and HARP imaging, the measurement of motion can also be accomplished by using MR phase contrast velocity mapping. The technique employs the phase shifts introduced by the gradient magnetic field to directly encode the velocity of moving tissue. It permits improved motion sensitivity and potentially requires less extensive post-processing than tagging. Figure 4 illustrates an example of CMR myocardial velocity mapping for assessing myocardial contractility, demonstrating the reconstructed longitudinal contractility mapping in a normal subject and a patient with ischaemic heart disease. Despite the advantages of myocardial velocity being recognized for many years, its practical application has been hindered by the low signal-to-noise of in-plane velocity components due to their relatively low velocity magnitude and artefacts arising from the ventricular flow patterns. By incorporating navigator echoes (Ehman & Felmlee 1989) that permit the tracking of the diaphragm and limit the effects of respiratory motion, improved spatial and temporal resolution and higher velocity sensitivity can be achieved. Figure 5 shows the strain rate distribution in different segments of the myocardium by using data from a group of normal subjects and patients with ischaemic heart disease and dilated cardiomyopathy. The mean and standard deviation in different myocardial regions for the normal subjects are shown in the top row, illustrating a tight grouping and a level of similarity between these subjects. The constructed normal strain rate distribution shows a trend of high strain rates in diastole that correspond to the ‘snapping back’ of the myocardium to start rapid filling of the LV. To enable a detailed comparison, a normalized strain rate atlas can be constructed which comprises the probabilistic distribution of all myocardial segments derived from normal subjects. In the example shown, the normalization was implemented both in space and time, where a polar coordinate system was used to derive the mean geometrical shape at different phases of the cardiac cycle. It is evident that after normalization a consistent trend in strain rate distribution across subjects starts to emerge and comparison of the strain rates in patients showed marked differences.
Figure 4.
Assessment of myocardial contractility with high sensitivity MR velocity imaging. (a) Anatomical structure of the image plane, (b) MR velocity measurement, (c) reconstructed longitudinal contractility mapping showing uniform contraction (sky blue) during systole and relaxation (red) during diastole for a normal subject and (d) contractility mapping for a patient with ischaemic heart disease, showing delayed contraction during systole and abnormal relaxation (broken and broadened red strip) during diastole.
Figure 5.
(a) Mean±s.d. of the strain distribution over time for normal subjects in different regions of the heart and (b) normalized results in normal subjects over time for seven frames of the cardiac cycle. This can be compared to the strain rate distribution in an ischaemic and dilated cardiomyopathy patient. The strain rate images are aligned so that the anterior region is at the top of the image.
(b) Myocardial perfusion and diffusion
Myocardial perfusion imaging is a method for identifying and assessing regions of myocardium that receive an inadequate blood supply from blocked or narrowed coronary arteries. With this technique, it is possible to discriminate between tissue that is permanently damaged and tissue that could be salvaged with revascularization techniques such as bypass surgery. MR perfusion imaging typically involves the injection of a contrast agent into the bloodstream followed by the acquisition of a dynamic image series. The series depicts the uptake of the contrast agent within the myocardium as it makes its first pass through the circulatory system. Although severe perfusion defects can be observed while the subject is at rest, it is desirable to identify myocardium that only receives an inadequate blood supply when the heart's workload is increased. Such regions of myocardium are typically supplied by narrowed coronary arteries that are unable to increase their throughput of blood during stress conditions (Braunwald 1997). To identify these regions, imaging is usually repeated under pharmacological stress. Late enhancement imaging may further be combined to identify the location, size and severity of infarcted regions within the myocardium. The technique involves the acquisition of MR images approximately 10–20 min after the injection of a contrast agent. During this period, the concentration of the agent in the bloodstream declines due to redistribution through the body. The contrast agent is normally washed out of healthy myocardium where the myocytes are intact, but it lingers in infarcted myocardium or other fibrous tissue where there is a relatively high proportion of extracellular fluid. This allows damaged tissue to be identified as relatively enhanced bright regions within the acquired images.
In CMR research, diffusion imaging (Reese et al. 1995) is used to study the structure of muscle fibres within the myocardium. This is performed by measuring the diffusivity of water molecules through the fibres, which has been shown to be correlated to the fibre orientation. MR diffusion imaging has been used extensively in studies of brain structure but has only recently been applied to study the architecture of the myocardium. The technique is complicated by many factors, including bulk motion of the tissue, intracellular streaming, temperature and magnetic susceptibility variations. This means that it is not possible to measure the true diffusion properties of the tissue. Instead, it is necessary to measure the apparent diffusion coefficient that results from these complications. Diffusivity may be measured using MR by making the signal phase sensitive to motion. Diffusion results in the dispersion of phases within a voxel. The level of signal loss that occurs for each voxel may be used to measure the diffusion tensor. The maximum eigenvector of the diffusion tensor has been shown to correspond to muscle fibre orientation (Edelman et al. 1994). In practice, diffusion imaging is particularly challenging to perform in vivo. The diffusion sensitizing gradient needs to be switched on for a long period of time to take into account the slow nature of the process. In addition to this, the echo time needs to be long as the resultant signal is relatively weak. These two requirements are largely incompatible with the highly dynamic morphology of the heart. The respiratory and myocardial motion of the ventricle makes it very difficult to image a single slice of tissue for a long period of time. For this reason, it is necessary to use gated imaging with breath-holds or navigators.
3. Blood flow quantification and visualization with CMR
The measurement of blood flow is important to the understanding and management of cardiovascular disease. The concept of blood flow imaging using MR was first introduced by Singer (1978). This technique is based on the observation that as spins move along a magnetic field gradient, their angular position changes relative to stationary spins (Moran 1982). This property is called spin phase shift and is proportional to the velocity with which the spins move. The majority of MR studies for blood flow imaging are based on phase contrast velocity mapping. Early implementations of this technique used a spin echo sequence (van Dijk 1984a). This required extensive imaging time, however, and caused problems due to signal loss in regions of low velocity. These problems were reduced and the technique was made more clinically useful with the incorporation of a gradient echo sequence (Ridgway & Smith 1986; Young et al. 1986) and velocity compensated waveforms (Nayler et al. 1986). CMR techniques to measure blood flow were first developed in the early 1980s (Bryant et al. 1984; van Dijk 1984a,b). The two main methods for measuring blood flow using CMR are time-of-flight and phase contrast. Time-of-flight methods are based on inflow effects. Spins perpendicular to the vessel to be imaged can be magnetically saturated, ‘tagged’, and the time taken for the tagged blood to travel a certain distance can be used to calculate its speed. This method is routinely used in CMR angiography. The phase contrast method employs the inherent property of CMR to alter the phase shifts of the spins, and has become established for clinical application in the major blood vessels and cardiac chambers.
In order to measure flow with phase contrast velocity mapping, two images are acquired with different gradient waveforms in the direction of the flow measurement. The difference in the waveforms is calculated to produce a well-defined phase variation between the two images. The images are subtracted on a pixel-by-pixel basis to derive a measurement of velocity. By using this method of image subtraction, any phase variations that are not related to flow are removed. It is possible to specify the range of velocities that can be measured by changing the imaging parameters. It is conventional to set the parameters such that the expected measurements have phases in the range of −π to π. If values lie outside this range then an artefact called aliasing or wrap around occurs. In such cases, measurements become ambiguous as the phases correspond to multiple velocities. A technique that can remove these artefacts known as phase unwrapping has been developed (Yang et al. 1993). Alternatively, the velocity sensitivity can be varied over the cardiac cycle (Buonocore 1998a). This allows the accuracy of velocity measurements to be maximized for each image within a time-series acquisition. The accuracy of flow imaging techniques is dependent on many factors, including the magnitude of the velocities being measured, the turbulence of the flow and the size and tortuosity of the containing vessel. The spatial resolution must be sufficiently high to accurately image flows with complex topology. In addition, the temporal resolution must be high enough to image transient flow patterns.
Flow-related signal loss is an effect that reduces the accuracy of many velocity measurement techniques. It is due to the presence of a wide range of velocities within a voxel that typically occurs in turbulent, pulsatile and other complex flows. This can cause its spins to lose phase coherence with each other yielding a reduced net phase shift for the voxel. This is characterized by dark regions in the magnitude image where bright signal from blood would be expected. Signal loss is still a problem for imaging sequences that use velocity compensation, as acceleration and higher orders of motion are also able to cause phase incoherence.
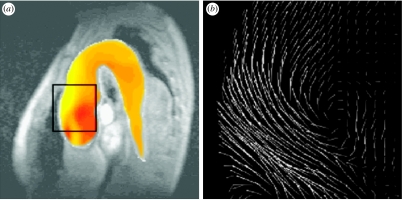
The unique capability of CMR for examining detailed blood flow patterns in vivo makes it an ideal platform for assessing a range of clinical conditions in the heart and great vessels. The method is particularly useful for examining multi-directional velocity profiles of compliant and branching vessels (Mohiaddin et al. 1993; Bogren & Buonocore 1999). Thus far, CMR has been used to study blood flow in all the major blood vessels such as the aorta, pulmonary arteries and veins and the caval veins (Kilner et al. 1993; Paz et al. 1993). Assessment of valvular disease and mitral regurgitation can be analysed using CMR velocity mapping (Aurigemma et al. 1990). As the turbulent regurgitant flow causes a signal void, this signal loss can be used as a semi-quantitative way of measuring the severity of regurgitation (Nayak et al. 2000, 2003). CMR velocity mapping has also become an essential tool for the study of spatial and temporal patterns of blood flow (Buonocore 1998b). It is especially useful for assessing flow pattern changes in the LV in diseases with ventricular remodelling such as dilated cardiomyopathy or HCM. CMR phase contrast velocity mapping can also be used to compute relative pressures in the major vessels and cardiac chambers. The Navier–Stokes equations for incompressible fluids can be used to compute the pressure differences associated with blood flow (Yang et al. 1996; Thompson & McVeigh 2003). The method has been validated against the gold standard of catheter measurements and Doppler ultrasound (Yang et al. 1996; Caruthers et al. 2003). Figure 6 shows an example of a pressure difference map during flow into an aortic aneurysm calculated from CMR phase contrast velocity mapping (Yang et al. 1996). Although this is not a routinely used technique, an online system could be developed to allow simultaneous pressure difference and velocity fields to be mapped in large vessels by CMR. Finally, flow in the coronary arteries has also been studied using CMR, but it is still a challenge due to the small size of the vessels and their movement due to cardiac and respiratory motion (Edelman et al. 1993).
Figure 6.
Pressure differences during flow into an aortic aneurysm: (a) calculated from the MR velocity measurements; (b) obtained by using the Navier–Stokes equations for incompressible fluids.
To maximize the clinical applicability of CMR velocity mapping, ultrafast flow imaging techniques have been developed by combining single-shot echo-planar and spiral techniques with phase contrast velocity mapping (Firmin et al. 1989; Gatehouse et al. 1994). The inherent phase sensitivity of echo planar techniques amplifies the effect of signal loss. Although this can be detrimental to the accurate measurement and quantification of blood flow, it can aid the identification of regions of abnormal flow. This has been used to provide qualitative assessment of flow disturbances (Kose 1991). It is possible to increase imaging speed by using a two-dimensional radiofrequency pulse to excite only a narrow rectangular column within the body. This means that the number of echoes required to spatially encode one of the directions can be significantly reduced. It has been demonstrated that this technique may be used to provide real-time imaging to assess the effect of controlled breathing on the flow in the ascending aorta and SVC (Yang et al. 1997). Real-time imaging sequences usually consist of echo-planar imaging or spiral imaging, which can be adapted to incorporate velocity mapping by adding the necessary bipolar gradients (Gatehouse et al. 1994; Nayak et al. 2000).
4. Flow and structure interaction
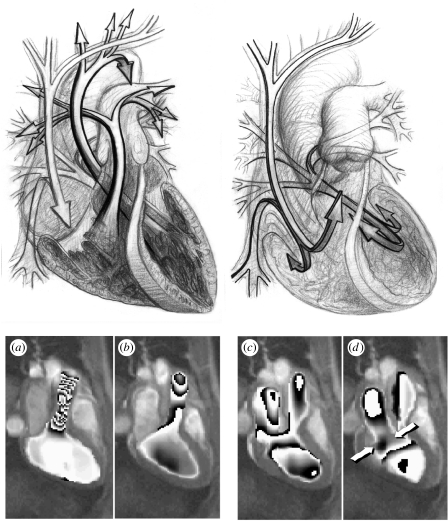
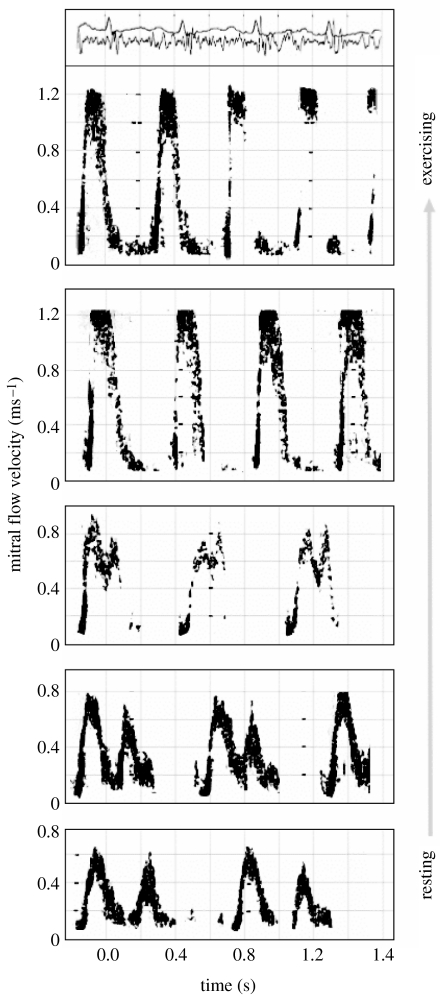
Through cardiac looping during embryonic development, the overall forms of human and other vertebrate hearts adopt sinuous curvatures with marked changes in direction of flow at atrial, ventricular and arterial levels. To understand the basic mechanism of flow and structure interaction, CMR phase velocity mapping combined with Doppler ultrasound has been used to study flow through the hearts of resting volunteers (Kilner et al. 2000) and the associated changes with exercise (Kilner et al. 1997). Figure 7 illustrates the principal directions of blood flow through the heart in systole and early diastole. Each of the main movements of blood involves acceleration followed by deceleration of flow. The pressure differences associated with the changes of momentum have been computed from CMR velocity maps of the left ventricular inflow and outflow tracts, viewed obliquely from below right. Differences of pressure are represented by shaded 1 mm Hg bands in the images below, where figure 7a shows acceleration of flow into the outflow tract in early systole, with higher pressure in the ventricle than at aortic valve level; figure 7b shows subsequent deceleration, with reversal of the outflow pressure gradient; figure 7c shows acceleration from left atrium to LV at the beginning of diastole, with higher pressure in the atrium; and figure 7d shows subsequent deceleration, with reversal of the inflow pressure gradient. During exercise, with greater velocities of flow and more rapid transition between systole and diastole, dynamic pressure differences will be much larger and of greater functional significance. The asymmetric curvatures and changes of direction have functional advantages. It has been found that asymmetric recirculation of blood occurs during the filling phases of all four heart cavities, with blood redirected appropriately for onward passage to the next cavity. The Doppler traces shown in figure 8 demonstrate that biphasic ventricular filling became rapid and monophasic during strenuous exercise. On the basis of these studies, it has been suggested that the asymmetric direction changes confer at least three interrelated advantages. Firstly, more asymmetric, tangential inflow resulting from looping of the developing heart allows more stable, less turbulent filling of each cavity, and so less dissipation of energy through turbulence. Secondly, asymmetrically recirculating inflow at both atrial and ventricular levels redirects blood appropriately for onward passage to the next chamber or vessel. In contrast, symmetric, centrally directed inflow would result in greater instability and turbulence, and inappropriate rather than appropriate redirection of inflow. And thirdly, perhaps the most important of the three: a ventricle that ejects vigorously will recoil, like a gun, away from the direction in which the blood is accelerated. Only in the looped heart, with direction change at ventricular level, is this recoil directed so as to enhance rather than inhibit long-axis movement of the atrioventricular valve plane, so enhancing filling of the atrium during ventricular systole, particularly in the exercising state.
Figure 7.
Drawings illustrate the principal directions of blood flow through the heart in systole and early diastole. Each of the main movements of blood involves acceleration followed by deceleration of flow. The pressure differences associated with the changes of momentum have been computed from magnetic resonance velocity maps of the left ventricular inflow and outflow tracts, viewed obliquely from below right. Differences of pressure are represented by shaded bands in the images below, 1 mm Hg per band. (a) Acceleration of flow into the outflow tract in early systole, with higher pressure in the ventricle than at aortic valve level, 184 ms; (b) subsequent deceleration, with reversal of the outflow pressure gradient, 408 ms; (c) acceleration from left atrium to LV at the beginning of diastole, with higher pressure in the atrium, 464 ms; (d) subsequent deceleration, with reversal of the inflow pressure gradient, 576 ms. The numbers represent the timing in milliseconds from the R wave of the ECG. The arrows indicate the positions of the mitral valve leaflets. On exercise, with greater velocities of flow and more rapid transition between systole and diastole, dynamic pressure differences will be much larger and of greater functional significance.
Figure 8.
Pulsed Doppler ultrasound traces of mitral flow velocity (y-axis of each trace) against time (x-axis). Diastolic mitral inflow is biphasic at rest (lower trace) but monophasic on strenuous exercise (upper trace). At the very top are traces of the electrocardiogram and phonocardiogram corresponding to the exercising Doppler trace.
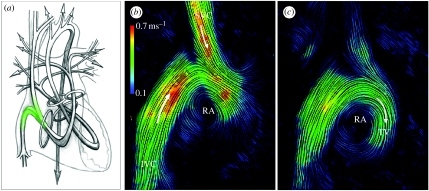
During ventricular systole, the contraction of ventricular myocardium causes a rise of intraventricular pressure against closed inflow valves and acceleration of blood through the outflow tracts into the aorta and pulmonary artery. The exchange of force and energy through the heart as a whole, and through the course of its cycle, is complex. Figure 9 illustrates the principal paths of flow through both sides of the human heart depicted as continuous bands, with the locations of the heart valves represented by rings. This shows the direction changes and asymmetries of the tortuous paths of flow. CMR velocity data have been displayed as instantaneous streamlines. Flow from the SVC and IVC contribute to a forward rotating vortex in both systolic (figure 9b) and diastolic (figure 9c) phases, redirecting inflowing blood towards the region of the TV, which lies to the left of this plane, away from the viewer. Blood returns through veins to the atrial cavities with low levels of pressure and kinetic energy. These contribute to filling and slight stretching of the atrial walls which, according to Starling's law, primes their muscle for subsequent contraction, which delivers a late diastolic peak of flow through the atrio-ventricular valves, giving a boost to ventricular filling and priming ventricular muscle for its subsequent contraction. As stated above, ventricular contraction raises pressure and accelerates blood, but this entails directional as well as circumferential exchanges of force. According to Newton's laws of motion, acceleration of a mass of fluid is itself associated with a directional force and an equal and opposite counterforce. This manifests as a gradient of pressure in the direction of acceleration and an oppositely directed counterforce of ventricular recoil, like the recoil of a discharged gun, tending to force the bodies of the ventricles away from their outlets. This directional force becomes more significant on exercise as rates of change of momentum rise with increased output. Furthermore, there are exchanges of force between atria and ventricles, not only via the flows and momentum changes of blood, but also through direct connection between the compartments. Atrial contraction leads to ventricular stretching, and vice versa, by direct interaction between the two. There is an additional exchange of energy between contracting myocytes and associated elastic fibres which results in elastic recoil of ventricular muscle following contraction. This elastic recoil contributes to the early diastolic peak of ventricular inflow.
Figure 9.
(a) Principal paths of flow through both sides of the human heart depicted as continuous bands, with the locations of the heart valves represented by rings. This shows the direction changes and asymmetries of the tortuous paths of flow. Flow in the right atrium viewed from the subject's right side. Magnetic resonance velocity data have been displayed as instantaneous streamlines. Flow from the SVC and IVC contribute to a forward rotating vortex in both (b) systolic and (c) diastolic phases, redirecting inflowing blood towards the region of the TV, which lies to the left of this plane, away from the viewer.
Myocardial and valvular heart disease can result in a wide range of changes of the quantities, velocities and spatio-temporal patterns of flow. The commonest pathology results from restriction of blood flow to the myocardium itself by atheromatous changes in the coronary arteries. Coronary heart disease can result in impaired myocardial contraction, initially on exercise and in certain regions. In more advanced disease, severe ischaemia can result in infarction and scarring of part of the heart muscle, which in time may stretch and dilate. Consequent deformity and dilatation of the ventricle result in altered patterns of flow. Other causes of impaired myocardial function, for example cardiomyopathies, also cause altered filling patterns and impairment of ejection.
Stenoses of valves or vessels result in high-velocity jet flow and consequent dissipation of energy through turbulence. This results in extra myocardial work and pressure loading of the chamber upstream of the narrowed valve. The peak velocity of a jet, and its time course, can give information on the severity of stenosis. More severe stenoses compromise the rate of flow, and may extend and alter its time course. Valve incompetence and the resulting regurgitant jet also dissipate energy, driving turbulent flow back to the preceding cavity. Regurgitation of either inflow or outflow valves results in additional cardiac work with extra volume loading of the affected ventricle. Valve disease can be one of the causes of arrhythmia, for example atrial fibrillation, when temporal and spatial patterns of flow become further disturbed. In congenital heart disease, heart cavities and their adjacent vessels can be connected abnormally. There may be an atrial or a ventricular septal defect, or an abnormal vascular connection, allowing mixing or shunting of blood from one side of the heart to the other. Measurements of jet velocities through septal defects and valves, or volume flows in the great vessels, can be valuable in assessment of congenital heart disease.
5. Future outlook and conclusions
Myocardial contractility and its interaction with in vivo flow have long been regarded as an important measure of cardiac function. Thus far, cardiac function and its link to morphology and flow remain an active research topic. Current state-of-art CMR imaging is increasingly moving towards real-time imaging to enable the analysis of physiological changes in response to exercise or pharmacological stress. Stress testing with exercise or pharmacological agents has been proven to be a valuable tool for evaluating the prognostic importance of functional abnormalities introduced by coronary artery disease. Previous studies involving CMR for stress testing were limited by the temporal averaging nature of conventional velocity encoding sequences, typically requiring several minutes for acquiring each of the velocity components. Quantitative systolic ejection indices of maximal acceleration, peak velocity, and volume of blood ejected from the LV can be used to assess the functional significance of coronary artery disease and inducible myocardial ischaemia. In order to have a more quantitative evaluation of dynamic changes of the ventricular function related to stress, rapid high-resolution imaging of flow and structural changes is required. This can be achieved through real-time CMR flow imaging techniques. In recent years, many techniques have been developed to increase the effective imaging speed and resolution of cardiovascular MR. These include parallel imaging and the use of prior information for image reconstruction. Parallel imaging uses the spatial characteristics of the phase array coils for minimizing the acquisition time such as the SMASH (Sodickson & Manning 1997) and SENSE (Pruessmann et al. 1999) methods. The use of prior information, on the other hand, exploits the redundancy of k-space values in representing the image or series of images. This is of particular importance where the further development of fast image acquisition is limited by hardware constraints.
Despite the continuing improvement of CMR imaging, velocity mapping techniques are faced with the ultimate spatio-temporal resolution limited by CMR hardware and physiological motion. One important trend in the field is to integrate computational fluid dynamics (CFD) with the acquired flow data to enable visualization of a complete four-dimensional (three-dimensional plus time) flow field without the need to acquire velocity scans of the whole heart (Wood et al. 2001). CFD has traditionally been used in aerodynamics and thermodynamics to perform simulations controlled by the physical laws that govern the motion of fluids. Its application to blood flow modelling (Stroud et al. 2002) has increased the scope of studying vessel-flow dynamics far beyond what is provided by imaging alone. Early techniques of CFD for blood flow simulation were mainly based on simplified/idealized vessel geometries. With the improvement of imaging techniques, the use of patient-specific information for CFD has become increasingly popular. The approach of combining CFD with patient-specific morphology and flow captured with imaging has valuable clinical applications, particularly for the design of vessel prostheses. CFD blood flow simulation has important applications in cardiac imaging as it allows the calculation of flow indices that cannot be directly measured, such as mass transport, wall shear and boundary flow layer (Augst et al. 2003). It also allows the creation of flow fields at a far higher temporal and spatial resolution than can be provided by flow imaging. Furthermore, it permits the prediction of flow parameters and evaluation of efficacy of surgical and therapeutic measures.
As CFD is based on simulation rather than exclusively on measurement, significant errors can be introduced due to numerical errors or inappropriate choice of boundary conditions. It is therefore unsuitable to use it as a direct replacement for flow imaging. Instead, it is desirable to exploit the principal benefits of each of these techniques. In this way, the combination of imaging and simulation will provide a unique and versatile tool for the study of vascular morphology and flow. It is envisaged that subject-specific CFD combined with imaging will have an important role in improved design of vessel prostheses and assessing the efficacy of therapeutic measures. This trend in combining imaging with the ‘engineering of the heart’ is driven by our increased understanding of biomechanics, maturity of computational modelling techniques and advances in imaging.
Footnotes
One contribution of 21 to a Theme Issue ‘Bioengineering the heart’.
References
- Augst D, Barratt D, Hughes A, Glor F, Thom S, Xu X. Accuracy and reproducibility of CFD predicted wall shear stress using 3D ultrasound images. ASME J. Biomed. Eng. 2003;125:218–222. doi: 10.1115/1.1553973. doi:10.1115/1.1553973 [DOI] [PubMed] [Google Scholar]
- Aurigemma G, Reichek N, Schiebler M, Axel L. Evaluation of mitral regurgitation by cine magnetic resonance imaging. Am. J. Cardiol. 1990;66:621–625. doi: 10.1016/0002-9149(90)90491-i. doi:10.1016/0002-9149(90)90491-I [DOI] [PubMed] [Google Scholar]
- Axel L, Dougherty L. MR imaging of motion with spatial modulation of magnetisation. Radiology. 1989;171:841–845. doi: 10.1148/radiology.171.3.2717762. [DOI] [PubMed] [Google Scholar]
- Berne R.M. The heart. vol. 1. American Physiological Society; Bethesda, MD: 1979. Handbook of physiology: a critical, comprehensive presentation of physiological knowledge and concepts. Section 2: the cardiovascular system. [Google Scholar]
- Bogren H.G, Buonocore M.H. 4D magnetic resonance velocity mapping of blood flow patterns in the aorta in young vs elderly normal subjects. J. Magn. Reson. Imaging. 1999;10:861–869. doi: 10.1002/(sici)1522-2586(199911)10:5<861::aid-jmri35>3.0.co;2-e. doi:10.1002/(SICI)1522-2586(199911)10:5<861::AID-JMRI35>3.0.CO;2-E [DOI] [PubMed] [Google Scholar]
- Braunwald, E. 1997 In Heart disease: a textbook of cardiovascular medicine, pp. 288–290. Philadelphia, PA: Saunders Company.
- Brower R.W, Katen H.T, Meester G.J. Direct method for determining regional myocardial shortening after bypass surgery from radio-opaque markers in man. Am. J. Cardiol. 1978;41:1222–1229. doi: 10.1016/0002-9149(78)90879-2. doi:10.1016/0002-9149(78)90879-2 [DOI] [PubMed] [Google Scholar]
- Bryant D, Payne J, Firmin D, Longmore D. Measurement of flow with NMR imaging using a gradient pulse and phase difference technique. J. Comput. Assist. Tomogr. 1984;8:588–593. doi: 10.1097/00004728-198408000-00002. doi:10.1097/00004728-198408000-00002 [DOI] [PubMed] [Google Scholar]
- Buonocore M.H. Blood flow measurement using variable velocity encoding in the RR interval. Magn. Reson. Med. 1998a;40:603. doi: 10.1002/mrm.1910290611. doi:10.1002/mrm.1910400207 [DOI] [PubMed] [Google Scholar]
- Buonocore M.H. Visualizing blood flow patterns using streamlines, arrows and particle paths. Magn. Reson. Med. 1998b;40:210–226. doi: 10.1002/mrm.1910400207. doi:10.1002/mrm.1910400207 [DOI] [PubMed] [Google Scholar]
- Caruthers S, Lin S, Brown P, Watkins M, Williams T, Lehr K, Wickline S. Practical value of cardiac magnetic resonance imaging for clinical quantification of aortic valve stenosis: comparison with echocardiography. Circulation. 2003;108:2236–2243. doi: 10.1161/01.CIR.0000095268.47282.A1. doi:10.1161/01.CIR.0000095268.47282.A1 [DOI] [PubMed] [Google Scholar]
- Edelman R, Manning W, Gervino E, Li W. Flow velocity quantification in human coronary arteries with fast, breath-hold MR angiography. J. Magn. Reson. Imaging. 1993;3:699–703. doi: 10.1002/jmri.1880030503. doi:10.1002/jmri.1880030503 [DOI] [PubMed] [Google Scholar]
- Edelman R.R, Gaa J, Wedeen V.J, Loh E, Hare J.M, Prasad P, Li W. In vivo measurement of water diffusion in the human heart. Magn. Reson. Med. 1994;32:423–428. doi: 10.1002/mrm.1910320320. doi:10.1002/mrm.1910320320 [DOI] [PubMed] [Google Scholar]
- Ehman R.L, Felmlee J.P. Adaptive technique for high-definition MR imaging of moving structures. Radiology. 1989;173:255–263. doi: 10.1148/radiology.173.1.2781017. [DOI] [PubMed] [Google Scholar]
- Firmin D.N, Klipstein R.H, Hounsfield G.L, Paley M.P, Longmore D.B. Echo-planar high-resolution flow velocity mapping. Magn. Reson. Med. 1989;12:316–327. doi: 10.1002/mrm.1910120304. doi:10.1002/mrm.1910120304 [DOI] [PubMed] [Google Scholar]
- Gatehouse P, Firmin D, Collins S, Longmore D. Real time blood flow imaging by spiral scan phase velocity mapping. Magn. Reson. Med. 1994;31:504–512. doi: 10.1002/mrm.1910310506. doi:10.1002/mrm.1910310506 [DOI] [PubMed] [Google Scholar]
- Gerdes A, Capasso J. Structural remodeling and mechanical dysfunction of cardiac myocytes in heart failure. J. Mol. Cell. Cardiol. 1995;27:849–856. doi: 10.1016/0022-2828(95)90000-4. doi:10.1016/0022-2828(95)90000-4 [DOI] [PubMed] [Google Scholar]
- Hove J.R, Koster R.W, Forouhar A.S, Acevedo-Bolton G, Fraser S.E, Gharib M. Intracardiac fluid forces are an essential epigenetic factor for embryonic cardiogenesis. Nature. 2003;421:172–177. doi: 10.1038/nature01282. doi:10.1038/nature01282 [DOI] [PubMed] [Google Scholar]
- Karwatowski S.P, Mohiaddin R, Yang G.Z, Firmin D.N, Sutton M.S, Underwood S.R, Longmore D.B. Assessment of regional left ventricular long-axis motion with MR velocity mapping in healthy subjects. J. Magn. Reson. Imaging. 1994;4:151–155. doi: 10.1002/jmri.1880040209. doi:10.1002/jmri.1880040209 [DOI] [PubMed] [Google Scholar]
- Kilner P.J, Yang G.Z, Mohhiaddin R.H, Firmin D.N, Longmore D.B. Helical and retrograde secondary flow patterns in the aortic arch studied by three-directional magnetic resonance velocity mapping. Circulation. 1993;88:2235–2247. doi: 10.1161/01.cir.88.5.2235. [DOI] [PubMed] [Google Scholar]
- Kilner P, Henein M, Gibson D. Our tortuous heart in dynamic mode—an echocardiographic study of mitral flow and movement in exercising subjects. Heart Vessels. 1997;12:103–110. doi: 10.1007/BF02767127. [DOI] [PubMed] [Google Scholar]
- Kilner P, Yang G, Wilkes A, Mohiaddin R, Firmin D, Yacoub M. Asymmetric redirection of flow through the heart. Nature. 2000;404:7759–7761. doi: 10.1038/35008075. doi:10.1038/35008075 [DOI] [PubMed] [Google Scholar]
- Kose K. One shot velocity mapping using multiple spin echo EPI and its application to turbulent flow. J. Magn. Reson. 1991;92:631. [Google Scholar]
- McKay R.G, Pfeffer M.A, Pasternak R.C. Left ventricular remodelling following myocardial infarction: a corollary to infarct expansion. Circulation. 1986;74:693. doi: 10.1161/01.cir.74.4.693. [DOI] [PubMed] [Google Scholar]
- Mitchell G.F, Lamas G.A, Vaughan D.E, Pfeffer M.A. Left ventricular remodelling in the year after first anterior myocardial infarction. J. Am. Coll. Cardiol. 1992;19:1136. doi: 10.1016/0735-1097(92)90314-d. [DOI] [PubMed] [Google Scholar]
- Mohiaddin R, Kilner P, Rees S, Longmore D. Magnetic resonance volume flow and jet velocity mapping in aortic coactation. J. Am. Coll. Cardiol. 1993;22:1515–1521. doi: 10.1016/0735-1097(93)90565-i. [DOI] [PubMed] [Google Scholar]
- Moran P.R. A flow velocity zeugmatic interlace for NMR imaging in humans. Magn. Reson. Med. 1982;1:197–203. doi: 10.1016/0730-725x(82)90170-9. [DOI] [PubMed] [Google Scholar]
- Nayak K, Pauly J, Kerr A, Hu B, Nishimura D. Real-time color flow MRI. Magn. Reson. Med. 2000;43:251–258. doi: 10.1002/(sici)1522-2594(200002)43:2<251::aid-mrm12>3.0.co;2-#. doi:10.1002/(SICI)1522-2594(200002)43:2<251::AID-MRM12>3.0.CO;2-# [DOI] [PubMed] [Google Scholar]
- Nayak K, Hu B, Nishimura D. Rapid quantitation of high-speed flow jets. Magn. Reson. Med. 2003;50:366–372. doi: 10.1002/mrm.10538. doi:10.1002/mrm.10538 [DOI] [PubMed] [Google Scholar]
- Nayler G.L, Firmin D.N, Longmore D.B. Blood flow imaging by cine magnetic resonance. J. Comput. Assist. Tomogr. 1986;10:715–722. doi: 10.1097/00004728-198609000-00001. doi:10.1097/00004728-198609000-00001 [DOI] [PubMed] [Google Scholar]
- Osman N.F, Kerwin W.S, McVeigh E.R, Prince J.L. Cardiac motion tracking using CINE harmonic phase (HARP) magnetic resonance imaging. Magn. Reson. Med. 1999;42:1048–1060. doi: 10.1002/(sici)1522-2594(199912)42:6<1048::aid-mrm9>3.0.co;2-m. doi:10.1002/(SICI)1522-2594(199912)42:6<1048::AID-MRM9>3.0.CO;2-M [DOI] [PMC free article] [PubMed] [Google Scholar]
- Paz R, Mohiaddin R.H, Longmore D.B. Magnetic resonance assessment of the pulmonary arterial trunk anatomy, flow, pulsatility and distendibility. Eur. Heart J. 1993;14:1524–1530. doi: 10.1093/eurheartj/14.11.1524. [DOI] [PubMed] [Google Scholar]
- Pruessmann K, Weiger M, Scheidegger M, Boesiger P. SENSE: sensitivity encoding for fast MRI. Magn. Reson. Med. 1999;42:952–962. doi:10.1002/(SICI)1522-2594(199911)42:5<952::AID-MRM16>3.0.CO;2-S [PubMed] [Google Scholar]
- Reese T.G, Weisskoff R.M, Smith R.N, Rosen B.R, Dinsmore R.E, Wedeen V.J. Imaging myocardial fibre architecture in-vivo with magnetic resonance. Magn. Reson. Med. 1995;34:786–791. doi: 10.1002/mrm.1910340603. doi:10.1002/mrm.1910340603 [DOI] [PubMed] [Google Scholar]
- Ridgway J.P, Smith M.A. A technique for velocity imaging using magnetic resonance imaging. Br. J. Radiol. 1986;59:603. doi: 10.1259/0007-1285-59-702-603. [DOI] [PubMed] [Google Scholar]
- Singer J.R. NMR diffusion and flow measurement and an introduction to spin phase graphing. J. Phys. E: Sci. Instrum. 1978;11:281–291. doi:10.1088/0022-3735/11/4/001 [Google Scholar]
- Sodickson D, Manning W. Simultaneous acquisition of spatial harmonics (SMASH): fast imaging with radiofrequency coil arrays. Magn. Reson. Med. 1997;38:591–603. doi: 10.1002/mrm.1910380414. doi:10.1002/mrm.1910380414 [DOI] [PubMed] [Google Scholar]
- Stroud J.S, Berger S.A, Saloner D. Numerical analysis of flow through a severely stenotic carotid artery bifurcation. J. Biomech. Eng. 2002;124:9–20. doi: 10.1115/1.1427042. doi:10.1115/1.1427042 [DOI] [PubMed] [Google Scholar]
- Thompson R, McVeigh E. Fast measurement of intracardiac pressure differences with 2D breath-hold phase-contrast MRI. Magn. Reson. Med. 2003;49:1056–1066. doi: 10.1002/mrm.10486. doi:10.1002/mrm.10486 [DOI] [PMC free article] [PubMed] [Google Scholar]
- van Dijk P. Direct cardiac NMR imaging of heart wall and blood flow velocity. J. Comput. Assist. Tomogr. 1984a;8:429–436. doi: 10.1097/00004728-198406000-00012. doi:10.1097/00004728-198406000-00012 [DOI] [PubMed] [Google Scholar]
- van Dijk P. Direct cardiac NCMR imaging of heart wall and blood flow velocity. J. Comput. Assist. Tomogr. 1984b;8:429–436. doi: 10.1097/00004728-198406000-00012. doi:10.1097/00004728-198406000-00012 [DOI] [PubMed] [Google Scholar]
- Wood N, Weston S, Kilner P, Gosman A, Firmin D. Combined MR imaging and CFD simulation of flow in the human descending aorta. J. Magn. Reson. Imaging. 2001;13:699–713. doi: 10.1002/jmri.1098. doi:10.1002/jmri.1098 [DOI] [PubMed] [Google Scholar]
- Yang G.Z, Burger P, Kilner P.J. Dynamic range extension of cine velocity measurements using motion registered spatio-temporal phase unwrapping. J. Magn. Reson. Med. 1993;29:790–795. doi: 10.1002/jmri.1880060313. doi:10.1002/mrm.1910290611 [DOI] [PubMed] [Google Scholar]
- Yang G, Kilner P, Wood N, Underwood S, Firmin D. Computation of flow pressure fields from magnetic resonance velocity mapping. Magn. Reson. Med. 1996;36:520–526. doi: 10.1002/mrm.1910360404. doi:10.1002/mrm.1910360404 [DOI] [PubMed] [Google Scholar]
- Yang, G. Z., Gatehouse, P. D., Mohiaddin, R. H. & Firmin, D. N. 1997 Zonal echoplanar flow imaging with respiratory monitoring. In Proc. ISMRM 5th Annual Meeting, Vancouver, p. 1885.
- Young I.R, Bydder G.M, Payne J.A. Flow measurement by the development of phase differences during slice formation in MR imaging. Magn. Reson. Med. 1986;3:175–179. doi: 10.1002/mrm.1910030127. doi:10.1002/mrm.1910030127 [DOI] [PubMed] [Google Scholar]
- Zerhouni E.A, Parish D.M, Rogers W.J, Yang A, Shapiro E.P. Human heart: tagging with CMR imaging: a method for non-invasive assessment of myocardial motion. Radiology. 1988;169:59–63. doi: 10.1148/radiology.169.1.3420283. [DOI] [PubMed] [Google Scholar]


