Abstract
Successful mitral valve repair is dependent upon a full understanding of normal and abnormal mitral valve anatomy and function. Computational analysis is one such method that can be applied to simulate mitral valve function in order to analyse the roles of individual components and evaluate proposed surgical repair. We developed the first three-dimensional finite element computer model of the mitral valve including leaflets and chordae tendineae; however, one critical aspect that has been missing until the last few years was the evaluation of fluid flow, as coupled to the function of the mitral valve structure. We present here our latest results for normal function and specific pathological changes using a fluid–structure interaction model. Normal valve function was first assessed, followed by pathological material changes in collagen fibre volume fraction, fibre stiffness, fibre splay and isotropic stiffness. Leaflet and chordal stress and strain and papillary muscle force were determined. In addition, transmitral flow, time to leaflet closure and heart valve sound were assessed. Model predictions in the normal state agreed well with a wide range of available in vivo and in vitro data. Further, pathological material changes that preserved the anisotropy of the valve leaflets were found to preserve valve function. By contrast, material changes that altered the anisotropy of the valve were found to profoundly alter valve function. The addition of blood flow and an experimentally driven microstructural description of mitral tissue represent significant advances in computational studies of the mitral valve, which allow further insight to be gained. This work is another building block in the foundation of a computational framework to aid in the refinement and development of a truly non-invasive diagnostic evaluation of the mitral valve. Ultimately, it represents the basis for simulation of surgical repair of pathological valves in a clinical and educational setting.
Keywords: mitral valve, FSI model, computer model, fluid flow
1. Introduction
Since the development of cardiopulmonary bypass, open heart surgery has been the definitive treatment for mitral regurgitation, extending longevity and improving quality of life in hundreds of thousands of patients annually. Mitral valve repair is considered superior to mitral valve replacement owing to lower operative mortality, improved late survival, a reduced risk of endocarditis, fewer thromboembolic complications and better preservation of left ventricular function (Yun & Miller 1991; Enriquez-Sarano et al. 1995; Gillinov 1998; Jamieson et al. 1999; Grossi 2001; Cohn 2002).
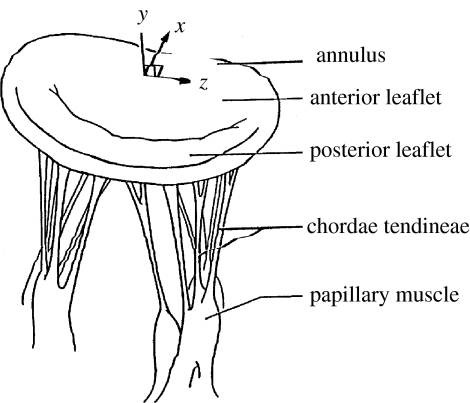
Successful mitral valve repair is dependent upon a full understanding of normal and abnormal mitral valve anatomy and function. The functional components of the mitral valve include the left atrial wall, the annulus, the leaflets, the chordae tendineae, the papillary muscles and segments of the left ventricular myocardium (Brock 1952; Rusted et al. 1952; Roberts 1983; figure 1). Abnormal anatomy or function of any one of these components can result in valvular dysfunction (Perloff & Roberts 1972). Much of our knowledge of abnormal mitral valve function is based on surgical and post-mortem studies (Waller et al. 1982; Olson et al. 1987). While these studies are quantitative in some cases, they are limited by evaluation of valve anatomy in a fixed and non-functioning state. A more sophisticated analysis method is necessary to gain a full understanding of mitral valve function. Computational analysis is one such method that can be applied to simulate mitral valve function in order to analyse the roles of individual components. However, very few groups have successfully developed models for structural analysis of the mitral valve.
Figure 1.
Mitral valve structure, including annulus, leaflets, chordae tendineae and papillary muscles.
(a) Mathematical analysis
Early on, several groups attempted to model mitral valve anatomy and function mathematically. These models were limited to two dimensions, i.e. a cross section was taken through the midline of the anterior and posterior leaflets (Ghista & Rao 1972; Arts et al. 1983). Numerical formulae have been applied to model the leaflet shapes, but significant assumptions were required to apply the mathematical models. These included assuming identical shapes for the anterior and posterior leaflets, or assuming the leaflet curvature to be of specific geometric shape (ellipse, cylinder, etc.). Such assumptions are anatomically incorrect and the results of these studies are not consistent with physiologic observations (Priola et al. 1970; Pohost 1975; Rubenstein et al. 1975). More sophisticated mathematical models were computer-aided, but were initially limited to two dimensions, assumed elliptical leaflet shapes and did not employ finite element (FE) analysis (Hunter et al. 1983; Miller & Marcotte 1987).
(b) Finite element analysis
We developed the first three-dimensional FE computer model of the mitral valve including leaflets and chordae tendineae to analyse the deformation and stress patterns under systolic loading conditions. Our FE model includes all the essential anatomic components, average tissue thickness, orientation of collagen fibres throughout the valve and related orthotropic mechanical properties of leaflet and chordal tissues (Kunzelman et al. 1993). The results of our studies have correlated well with published physiologic data (Salisbury et al. 1963; Clark 1973; Lim & Boughner 1977; Arts et al. 1983). In addition to analysis of normal valves (Kunzelman 1991; Kunzelman et al. 1993), we have also simulated pathologically altered valves (Reimink et al. 1995, 1996; Kunzelman et al. 1996, 1997; Quick et al. 1997; Kunzelman & Cochran 1999) and valves that have undergone surgical repair (Reimink et al. 1995, 1996; Kunzelman et al. 1996, 1998a; Kunzelman & Cochran 1999; table 1).
Table 1.
Types of mitral valve pathology and repair simulated.
| pathology | repair | |
|---|---|---|
| type I | annular dilatation | ring annuloplasty |
| leaflet perforation | pericardial patch replacement | |
| type II | chordal rupture | chordal replacement |
| papillary muscle rupture | ||
| type IIIa | leaflet thickening, stiffening | hemi-homograft replacement |
| type IIIb | papillary displacement (ischremic dysfunction) |
After completion of the normal model, we first examined ‘conformational’ pathological changes to the structure of the valve and appropriate surgical repair for each pathology. We first examined posterior dilatation, a common pathological finding. When compared with the normal model, with posterior annular dilation (Kunzelman et al. 1997), stresses were increased more than 100% in both anterior and posterior leaflets, and even more so in the chordae. Coaptation was delayed and the leaflets never fully coapted. Simulation of flexible and rigid ring annuloplasty to correct dilatation (Kunzelman et al. 1998a) showed reduced stresses and improved coaptation relative to annular dilatation. Next, simulation of a perforation in the anterior leaflet (Kunzelman 1991) showed stress concentrations that could lead to further tearing. Patching of anterior leaflet perforation (Kunzelman 1991) demonstrated that stress concentrations were eliminated and leaflet stress was returned to normal. Subsequently, another common pathological finding that requires surgical intervention, anterior and posterior chordal rupture, was simulated in several models (Reimink et al. 1995, 1996; Kunzelman et al. 1996). It was shown that stresses were severely elevated in adjacent chords, which may lead to further elongation or rupture, while in its most severe form, papillary muscle rupture (Kunzelman 1991) resulted in complete leaflet flail. Finally, simulation of extended polytetrafluoroethylene (ePTFE) suture for chordal replacement (Reimink et al. 1995, 1996; Kunzelman et al. 1996) showed that the length of the suture replacement was more important than size in terms of normalizing chordal and leaflet stresses.
In other pathological conditions, the microstructure of mitral valve tissue is altered in response to stress (Quick et al. 1997, 2004; Kunzelman et al. 1998b), resulting in changes in tissue thickness, stiffness or both. In our model simulations of such changes (Kunzelman et al. 1998b), increased tissue stiffness resulted in increased leaflet and chordal stresses, as well as reduced coaptation. Increased tissue thickness reduced not only leaflet and chordal stresses, but also coaptation. In some cases, where the changes in the valve microstructure affect only a part of the valve, replacement with partial homograft is an option. When we examined the effect of ‘hemi-homograft’ replacement (Kunzelman & Cochran 1999), we found that while coaptation is restored, asymmetry may result due to mismatched leaflet properties and that ring annuloplasty may also be necessary.
Finally, one of the more elusive problems in cardiac surgery, mitral ischaemic dysfunction, was modelled by moving the physical location of the posteromedial papillary muscle progressively outward, to simulate a ventricular infarct involving the papillary muscle (Cochran & Kunzelman 1998). Stress increases were seen in all components of the valve, with an asymmetric pattern, and were greatest near the free edge of the posterior leaflet. In addition, the leaflets were restricted from closing completely, allowing regurgitation.
Only recently, several other groups have developed three-dimensional FE models of the mitral valve. Salgo et al. (2002) presented a model of the leaflets only to assess the effect of annular shape on leaflet curvature and stress. Lim et al. (2005) published a model of the leaflets and chordae, and performed a quasi-static analysis of leaflet stress and the relationship to asymmetry. Alfieri's group developed a model of leaflets and chordae to assess a new ‘dog-bone’ ring prosthesis (Maisano et al. 2005). For these three models, differing methods of determining initial leaflet shape were used, and the similarity to actual valve geometry is variable. The limitations of these models are that they assumed constant leaflet thickness, used non-linear isotropic material models and did not include fluid flow.
One of the more exciting and controversial techniques in mitral valve repair, the Alfieri ‘edge-to-edge’ approximation, has recently been simulated by several groups. Computational haemodynamic models from Alfieri's group used a fixed geometry for the leaflets, atrium and ventricle, and assessed fluid flow (Maisano et al. 1999; Redaelli et al. 2001), and a separate static structural model assessed diastolic pressure loading on the leaflets (Votta et al. 2002). Another group from Italy recently assessed edge-to-edge repair as well, using sequential models of the leaflets and then leaflets and chordae, beginning with linear elastic properties and ending with hyperelastic properties (Dal Pan et al. 2005). All these models demonstrated altered stress distributions or altered fluid flow with the edge-to-edge repair technique. However, interpretation of the results is limited by assumptions related to geometry (constant tissue thickness or non-branched chordae) and material properties (linear or isotropic non-linear), and none have coupled fluid flow to mechanical function of the leaflets.
(c) Fluid–structure interaction models
In recent years, we have begun to address the critical area of fluid–structure interaction (FSI) and have continued to develop our model of the mitral valve. We are now addressing the evaluation of fluid flow, as coupled to the function of the mitral valve structure. To date, the coupled FSI mitral model that we have presented is the only such model that we are aware of (Einstein et al. 2004, 2005a,b). Our model includes non-constant tissue thickness, anisotropic non-linear material properties specific for each leaflet based on collagen fibre orientation and branched chordae tendineae. Using this model, we have analysed the effect of diseased tissue properties. Our current model of the mitral valve provides a unique opportunity to assess both the mechanical effect of repair techniques, as well as the effect on fluid flow, in both the diastolic and the systolic phase, in the setting of mitral valve pathology. Detailed models of this type are necessary to more fully understand the function of the mitral valve in normal, diseased and surgically repaired states. We present here our latest results for normal function and specific pathological changes using the FSI model.
2. Material and methods
The commercial FE program, LS-DYNA (Livermore Software Technology Corporation, Livermore, CA), was used to perform all simulations. LS-DYNA is a transient hydrocode, typically applied to high-speed compressible flows. Custom subroutines to describe the non-linear anisotropic behaviour of mitral tissue were added and have been previously described (Einstein et al. 2003).
(a) Model geometry
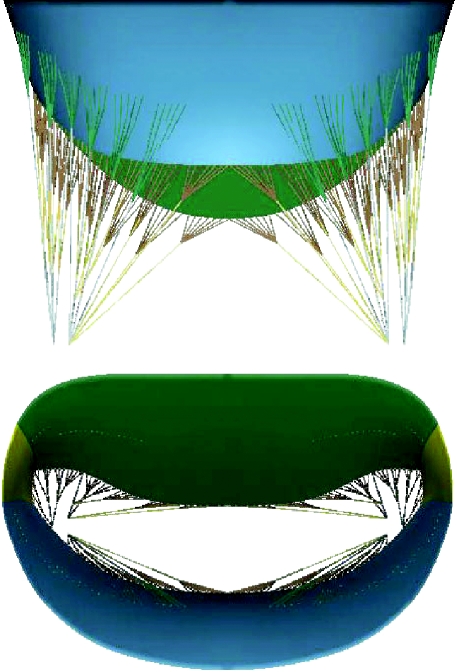
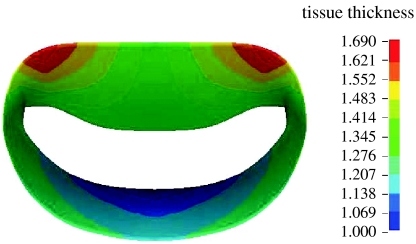
The mid-diastolic surface geometry of the mitral valve leaflets and papillary muscle tips as well as the number and radiation pattern of the chordae tendineae were developed from fresh porcine hearts (Kunzelman et al. 1993; figure 2). Regionally varying thicknesses were assigned to the anterior and posterior leaflets (figure 3). Twelve branched chordae radiate from three heads representing the anterior papillary tip.
Figure 2.
Geometry of mechanical model: leaflets, commissures, branched chords and multiple papillary insertions.
Figure 3.
Distribution of leaflet thickness.
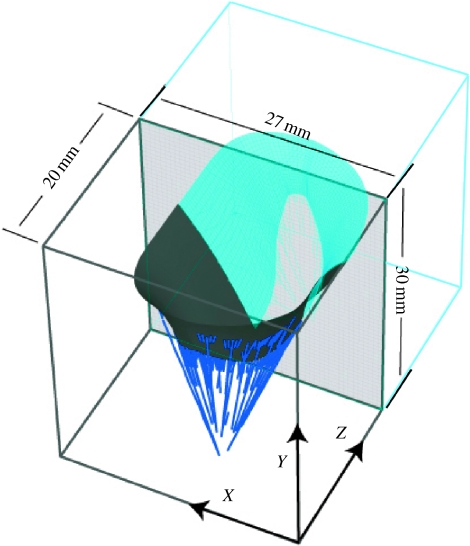
Dynamic video fluoroscopic data suggest that the mitral annulus is approximately symmetric about the septal–lateral midline (Komeda et al. 1996; Dagum et al. 2000). It is recognized that asymmetry exists with regard to subvalvular geometry and motion, particularly in pathological conditions including ischaemic dysfunction (Komeda et al. 1996, 1997; Dagum et al. 2000). Nevertheless, we initially chose to construct a model that is symmetric about the midline plane for computational efficiency. The valve geometry was immersed in a regular fluid domain appropriate for in vitro verification (figure 4).
Figure 4.
Mitral geometry, symmetry conditions and dimensions of fluid domain.
(i) Pressure loads
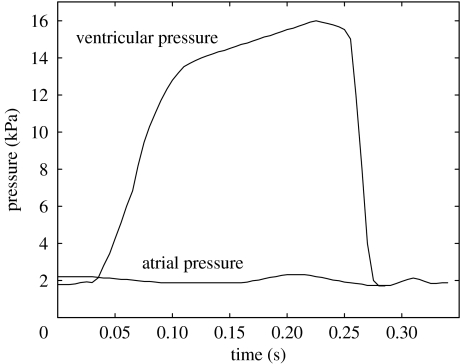
Atrial and ventricular pressure load curves were applied to the atrial and ventricular surfaces of the fluid domain (figure 5). Both curves are based on porcine in vivo measurements made with a Millar MIKRO-TIP catheter (Millar Instruments, Inc., Houston, TX) in our laboratory. Pressure crossover occurred at 0.032 s from the beginning of simulation.
Figure 5.
Atrial (lower) and ventricular (upper) pressure profiles applied to the top and bottom of the fluid domain.
(b) Leaflets
As the bending behaviour of mitral leaflet tissue has never been quantified, we assumed that the leaflets act as membranes. In other words, curvatures do not produce moments. The Fortran code for this membrane formulation is fully described by Einstein et al. (2003). Mean collagen fibre angles were mapped to both anterior and posterior leaflets from previously acquired small-angle light-scattering (SALS) data (Cochran et al. 1991). The anterior and posterior leaflets were discretized into 740 elements each. The commissure was modelled with 180 elements. Both leaflets and the commissure elements were coupled to the fluid.
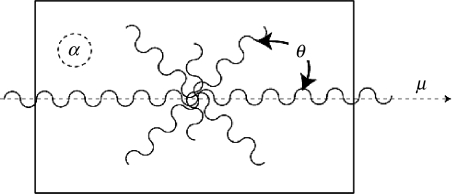
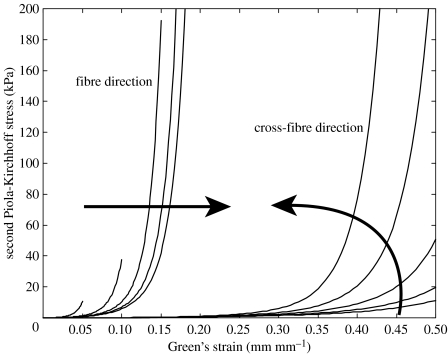
Mitral leaflet tissue material behaviour is characterized as an oriented entangled population of crimped collagen fibres embedded in an isotropic phase of gel-like glycoproteins and a network of isotropic elastin (figure 6). Mathematically, the stress–strain behaviour (figure 7) of the mitral leaflets was characterized by the following structural constitutive equation:
where S is the second Piola–Kirchhoff stress; C is the right-Cauchy deformation; p is the pressure; J is the Jacobian or volume ratio; Sf is the collagen stress/strain behaviour; I is the identity matrix and is the orientation tensor. μ is the mean fibre direction, and the Gaussian, R(θ), relates to the distribution of collagen fibres in the plane of the tissue and has been determined directly by SALS (Cochran et al. 1991). A, B, σ and α are material parameters derived from fitting the structural constitutive equation to published biaxial data for mitral valve anterior and posterior leaflet (May-Newman & Yin 1998), and these can be varied to simulate pathological changes. A relates to the volume fraction of collagen and B relates to the stiffness of an equivalent fibre that subsumes the idea of recruitment into an exponential. σ is a statistical parameter representative of fibre splay. The isotropic term α relates to stiffness of the matrix, which is dependent upon the quasi-linear elastic behaviour of both elastin (which primarily supports tension) and the hydrated admixture of proteins and glycoproteins (which primarily support compression). Greater detail is given in Einstein et al. (2003). Normal material parameters for both anterior and posterior leaflet are given in table 2. The density is set to 1.04×10⁻⁶ kg mm−3 and the bulk modulus to 2.5×10⁴ kPa for all mitral tissue.
Figure 6.
Structural paradigm for mitral leaflet tissue. Collagen fibres (wavy lines) are embedded in an isotropic matrix (α). Locally, the fibres have a mean preferred direction (μ). The standard deviation (σ) determines the Gaussian distribution of collagen fibres about that mean as a function of the splay angle (θ).
Figure 7.
Anterior mitral valve stress–strain behaviour, fibre and cross-fibre directions. Arrows indicate the effect of increasing strain levels in the orthogonal direction.
Table 2.
Normal leaflet material parameters.
| normal | A (kPa) | B | σ (°) | α (kPa) |
|---|---|---|---|---|
| anterior | 0.070 | 40 | 20 | 10 |
| posterior | 0.005 | 40 | 20 | 10 |
| commissure | 0.030 | 40 | 20 | 10 |
(c) Chordae
The chordae were modelled as tension-only cables. Though it is widely believed that the chordae act as secondary orifices for blood flow, they are not coupled to the fluid. Chordal diameters are given in table 3. The stress/strain behaviour of the chordae tendineae, like that of the mitral leaflet tissue, is non-linear. As chordae are uniaxial, experimental data are directly input for chordae material behaviour. Chordal stress/strain data were digitized from our published data (Kunzelman & Cochran 1990; table 4).
Table 3.
Chordal geometric properties.
| cross section (mm2) | |
|---|---|
| strut chord | 1.15 |
| primary basal | 0.79 |
| subbasal | 0.23 |
| primary marginal | 0.45 |
| submarginal | 0.15 |
Table 4.
Leaflet material parameters for pathological alterations.
| normal | A (kPa) | B | σ (°) | α (kPa) |
|---|---|---|---|---|
| anterior | 0.070 | 40 | 20 | 10 |
| posterior | 0.005 | 40 | 20 | 10 |
| commissure | 0.030 | 40 | 20 | 10 |
| volume fraction (A) | ||||
| A=A/10 | A/10 | 40 | 20 | 10 |
| A=A×10 | A×10 | 40 | 20 | 10 |
| fibre stiffness (B) | ||||
| B=35 | A | 35 | 20 | 10 |
| B=45 | A | 45 | 20 | 10 |
| fibre splay (σ) | ||||
| σ=10 | A | 40 | 10 | 10 |
| σ=30 | A | 40 | 30 | 10 |
| isotropic phase (α) | ||||
| α=1 | A | 40 | 20 | 1 |
| α=100 | A | 40 | 20 | 100 |
| α=1000 | A | 40 | 20 | 1000 |
(d) Blood
A Eulerian formulation was used to model the blood domain. Blood was modelled as a compressible, Newtonian fluid. Specifically, the deviatoric stress depends linearly on the shear rate, while compressibility is governed by the equation of state
where P is the pressure, K is the blood bulk modulus and J is the Jacobian or volume ratio. For computational efficiency, the bulk modulus was lowered to 2.5×10⁴ kPa from an estimated value of 1.0×10⁷ kPa (Masugata et al. 1998). Blood viscosity was determined from published data collected in a cone-in-plate viscometer at 37°C and a shear rate of 180 s−1 (Stein & Sabbah 1978). An average non-anaemic value of 0.045 P (kg mm−1 s) was adopted. Density was set to 1.00×10⁻⁶ kg mm−3. Grid density for the fluid domain was 35×53×48 fluid elements. (An investigation of grid sensitivity was performed, and increased fluid grid density beyond these ultimately chosen values did not further improve solution results.) Boundary conditions were such that the membrane was pinned on its edges, and the fluid boundary was fixed in displacement and rotation on four sides. At the bottom of the fluid ‘box’, below the membrane, a pressure was applied to the fluid faces. The pressure was ramped from 0 to 12 kPa (100 mmHg) in 0.05 s and held constant at 12 kPa until the end of the simulation at 0.2 s. The top face of the fluid domain was free in the vertical direction to permit flow to infinity. Flow was only allowed through the valve orifice, i.e. flow ‘around’ the exterior annular boundary of the valve was prohibited by the addition of a wetted rigid membrane between the annulus and exterior of the fluid domain.
(e) Coupling algorithm
The coupling algorithm is an interface-capturing rather than interface-tracking approach. The Eulerian domain of the fluid (blood) and the Lagrangian domain of the structures (leaflets and chordae) overlap. Though they are topologically independent, momentum is passed back and forth between them. Theoretically, the equation of motion of the wetted Lagrangian surface and of the neighbouring Eulerian fluid must be solved for monolithically. In contrast, we stagger the interaction by one time step. However, the maximum time-step criterion for explicit integration implies that the time step is small enough to capture a sound wave travelling across the smallest element. Thus, the error is limited. To effect the exchange of momentum, the nodes of the Lagrangian shells interact as boundary nodes with the fluid. The Lagrangian mesh is advanced one time step. The boundary nodes are then used as boundary conditions to the Eulerian fluid elements, which react by altering their velocity and pressure. These are then treated as boundary constraints on the Lagrangian structure at the next time step.
More specifically, all the fluid elements containing a structural node are identified. The structural nodal mass is then distributed to the fluid element nodes as
where i is the nodal index and h is a weighting coefficient. The structural nodal force is also distributed to the fluid as
The new fluid nodal acceleration becomes
The structural nodal acceleration is then constrained or matched to the fluid elemental acceleration as
In addition, the structural nodal momentum is distributed to the fluid element nodes as
The new fluid nodal velocity becomes
Finally, the structural nodal velocity is constrained to the fluid velocity as
(f) Pathological alterations
We further used our model to assess alteration of microstructural components, as seen in diseased tissue (Einstein et al. 2005). Specifically, we examined the effects of perturbations on material constants A, B, σ and α. Parameter A may be considered to be proportional to the volume fraction of effective collagen fibres. A was increased and then decreased by a factor of 10 (relative to each leaflet and the chordae). Parameter B governs the stiffness of individual effective fibres and was decreased to 35 and then increased to 45. The fibre splay parameter σ, or the degree of local fibre alignment, was decreased to 10° and then increased to 30°. The isotropic parameter α was decreased to 1 kPa and increased to 100 and 1000 kPa.
(g) Assessment
Stress and strain in the leaflets and chords were assessed. Papillary muscle force was determined as the sum of the reaction forces on the three nodes that represented the three heads of the anterolateral papillary muscle. In addition, transmitral flow (defined in such a way that negative flow is towards the atrium and positive flow towards the ventricle) and time to leaflet closure were assessed. Finally, to assess acoustic radiation (heart valve sound), the sampled and filtered average pressure signal from the computational model was analysed in the time–frequency plane with a Wigner–Ville distribution and a radially Gaussian kernel. (Results for the frequency analysis are given here for the normal model only.)
3. Results
(a) Normal model
(i) Stress and strain
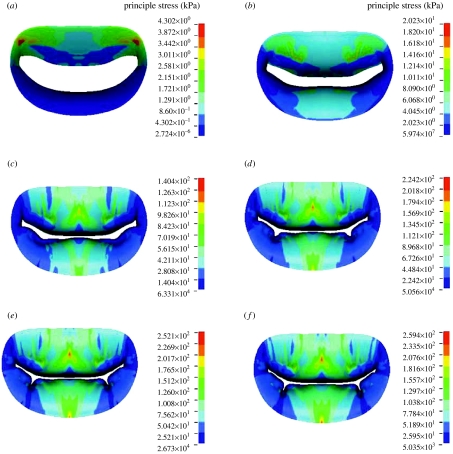
Late diastolic and early systolic peak principle stress occurred in the trigone of the anterior leaflet (figure 8). By 0.047 s at a transvalvular pressure (left ventricular pressure minus left atrial pressure) of 11.8 mmHg, the valve was mostly closed and the peak principle stress extended from the strut chordae to the trigones. At 0.070 s, the valve was fully closed and oscillating. In other words, the fluid is decelerated and cannot pass through the closed orifice. However, both the blood and the tissue possess momentum. This momentum is first converted to strain energy in the tissue, then returned as an acceleration to the fluid, then returned as strain energy again, until the energy of the system decays to steady state. It is these oscillations that are responsible for the first heart sound. The appearance of space between the leaflet is an artefact of the graphics, since only the midsurface of the leaflet is shown; thus, the apparent ‘gap’ is in fact filled by the thickness of the leaflets. Closure is verified by checking the status of the contact elements. The peak stress was 140 kPa and the location was transitioned to the belly of the leaflet and at the insertion of the strut chorda. This corresponded to a transvalvular pressure of 48.0 mmHg. By 0.093 s and a transvalvular pressure of 75.4 mmHg, the stress had risen to 224 kPa and the stress pattern was stable. At the final transvalvular pressure of 98 mmHg at 0.14 s, the stress levelled off to 254 kPa. Circumferential Almansi strains (figure 9) were highly negative on both leaflets towards the commissures and, particularly, in the neighbourhood of the physiological wrinkles ranging from 0.17 to −0.51. Radial Almansi strains, however, were entirely tensile, ranging from 0.04 to 0.25.
Figure 8.
Time course of principle stress in the anterior and posterior leaflets in the normal model. Time: (a) 0.023, (b) 0.047, (c) 0.070, (d) 0.093, (e) 0.117 and (f) 0.140 s. Red colour denotes the highest stress and dark blue the lowest.
Figure 9.
(a) Circumferential and (b) radial Almansi strains at 0.14 s in normal model. Values with negative numbers are compressive strains.
(ii) Papillary muscle force
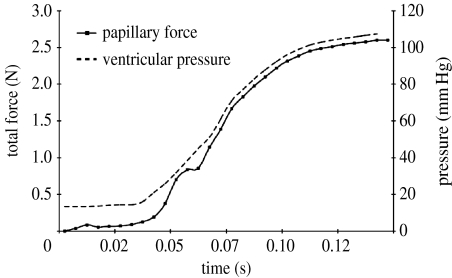
The time course of papillary muscle force closely followed the left ventricular pressure curve (figure 10), with a maximum of 2.6 N at a transvalvular pressure of 95 mmHg. A notch in the papillary force curve at approximately 0.06 s from the beginning of simulation corresponded to the onset of coaptation and valvular vibration. Maximum tension in the strut chord was found to be 0.52 N.
Figure 10.
Anterolateral papillary muscle force in normal model.
(iii) Flow
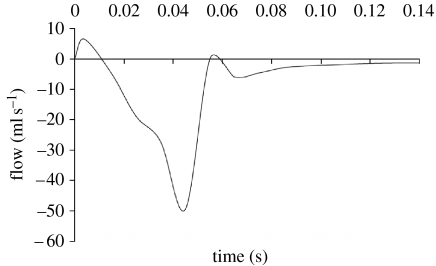
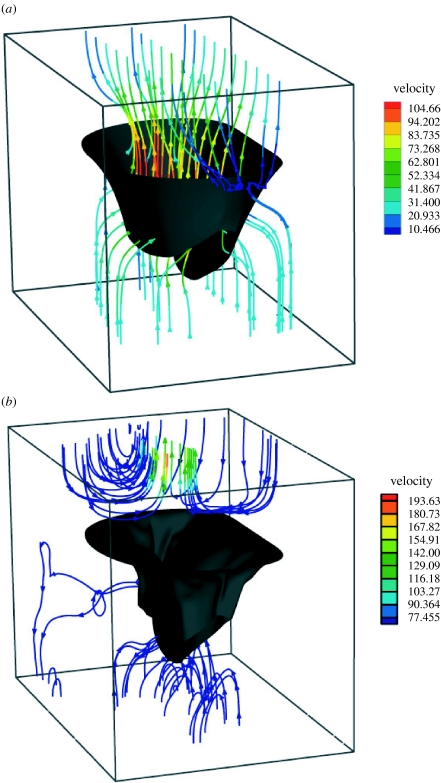
Peak closing flow was 51 ml s−1 (figure 11). Regurgitant closing volume, the time integral of transmitral closing flow, was 1.17 ml per beat. Peak backward velocity into the atrium was 886.9 mm s−1. The sequence shown in figure 12 illustrates the development of flow during closure. Where stream-traces appear to penetrate the leaflets, the leaflets are moving with the local fluid velocity. The chordae are not shown for the sake of clarity. Though the flow is fully three-dimensional, the stream-traces are plotted on the plane of symmetry to confine them to a two-dimensional plane for more facile interpretation. Note the eddy structures above the mitral valve.
Figure 11.
Mitral valve closing flow in normal model.
Figure 12.
Stream-traces of blood velocity in the (a) initial (t=20 ms) and (b) final (t=85 ms) phases of closure in normal model.
(iv) Frequency response of S1
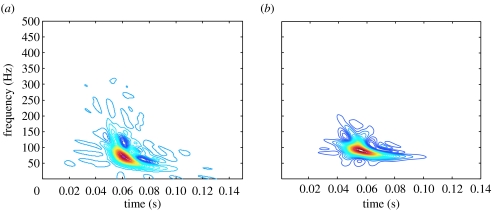
The transformed signal was found to have a downward glide in frequency with a maximum at 72.0 Hz occurring at 0.0604 s from pressure crossover (figure 13). The root mean square of the acoustic pressure was 3.3 Pa. This is compared to a typical thoracic S1 recording from sheep in our laboratory. The average maximum peak frequency was 71.7±2.8 Hz and occurred 0.071±0.003 s from the peak of the QRS wave in the ECG.
Figure 13.
Time–frequency signature of acoustic pressure in (a) the FSI model and (b) from measured thoracic recordings in sheep (with respect to the onset of systole).
(b) Pathological alterations
(i) Collagen volume fraction (A)
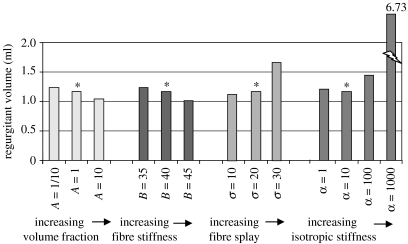
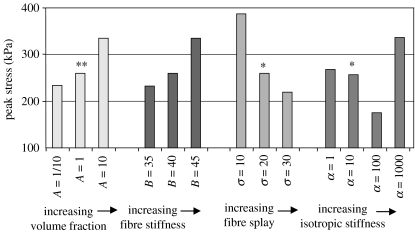
Transmitral flow was found to modestly decrease, both when the collagen volume fraction was increased and decreased (figure 14). Interestingly, even in the presence of strong perturbations of the collagen volume fraction, the valve remained competent. The regurgitant volumes for A=A/10, A and 10×A (note that different baseline parameter A values are assigned to anterior and posterior leaflet and commissural zone baseline) were 1.24, 1.17 and 1.04 ml, respectively. The end-of-simulation maximum principle stresses were 234.1, 259.4 and 334.0 kPa, respectively (figure 15).
Figure 14.
Regurgitant volumes for the models with pathological alterations. Asterisks refer to the normal model.
Figure 15.
Peak stress for the models with pathological alterations. Asterisks refer to the normal model.
(ii) Collagen fibre stiffness (B)
Transmitral flow was found to modestly decrease, both when the fibre stiffness was increased and decreased (figure 14). Even in the presence of strong perturbations to the fibre stiffness, the valve remained competent. The regurgitant volumes for B=35, 40 and 45 (unitless) were 1.23, 1.17 and 1.02 ml, respectively. The end-of-simulation maximum principle stresses were 332.5, 259.4 and 334.0 kPa, respectively (figure 15).
(iii) Collagen fibre splay (σ)
Transmitral flow was found to substantially increase when the fibre splay was decreased to 10° and decrease when the tissue fibre splay was increased to 30° (figure 14). The regurgitant volumes for σ=10°, 20° and 30° were 1.67, 1.17 and 1.12 ml, respectively. The end-of-simulation maximum principle stresses were 387.6, 259.4 and 219.7 kPa, respectively (figure 15).
(iv) Isotropic phase (α)
Flow was found to vary substantially when α was increased to 100 and 1000 kPa, but did not change substantially when α was decreased to 1 kPa (figure 14). The regurgitant volumes for α=1, 10, 100 and 1000 kPa were 1.21, 1.17, 1.45 and 6.73 ml, respectively. The end-of-simulation maximum principle stresses were 267.5, 259.4, 174.9 and 336.5 kPa, respectively (figure 15).
4. Discussion
We have described the results of a three-dimensional FSI model of the mitral valve that incorporates a continuum representation of mitral leaflet microstructure. Both normal and pathological functions were assessed. Our discussion will focus on the structural and fluid dynamic behaviour of the model, as well as comparing the model predictions to available data.
(a) Normal model
(i) Stress and strain
The peak principle stress of 254 kPa is 30% lower than the maximum principle stress predicted by earlier models that used linear material properties (Kunzelman et al. 1993). Interestingly, both radial and circumferential stresses were tensile for both of the leaflets throughout the simulation, while circumferential Almansi strains were highly compressive on both leaflets towards the commissures and, particularly, in the neighbourhood of the physiological wrinkles. This diametric behaviour of stress and strain has been noted previously in in vitro biaxial tests of cardiac tissue (Billiar & Sacks 2000a,b) and is a fundamental difference between linear and nonlinear behaviour. It is believed that this coupled behaviour is influenced by the fibre splay.
(ii) Papillary muscle force
The relationship between papillary muscle force and the left ventricular pressure curve is well documented (Nielsen et al. 1999; Jensen et al. 2001) with peak values of approximately 2.5 N, corresponding to a maximum transvalvular pressure of approximately 80 mmHg. Our predicted value of 2.6 N agrees quite well with these measurements. The papillary force was found to be distributed unevenly among the basal chords with the chords of the anterior leaflet bearing the greatest load. This is in agreement with previous models (Kunzelman et al. 1993; Reimink et al. 1996). The strut chord, the thickest of these basal chords, is generally assumed to carry the largest load; this assumption was confirmed in our model. Maximum tension in the strut chord was found to be 0.52 N. An in vivo measurement of strut chord tension in dogs found the strut chordal tension to be approximately 0.60 N at 100 mmHg (Salisbury et al. 1963). This measurement is difficult owing to its obviously intrusive nature. Nevertheless, the simulated and measured values are generally in agreement.
(iii) Flow
The complex atrial and ventricular flow fields make the in vivo quantification of transmitral flow difficult and only semi-quantitative. Nevertheless, the shape of the predicted mitral closing flow is similar to those determined by M-mode echocardiography (Laniado et al. 1973, 1975). Closing volume for normal dogs measured by M-mode echocardiography has been reported to be 3.23 ml per beat (Laniado et al. 1975). Our predicted closing volume of 1.17 ml is also a small volume, but slightly less. Predicted transmitral flow over time also showed excellent agreement with published in vitro transmitral flow data from the Georgia Tech left heart simulator (Jensen et al. 2001; figure 16).
Figure 16.
(a) Transvalvular pressure and (b) transmitral flow: black line, reference (Salisbury et al. 1963); grey line, data from computational model. Input transvalvular pressure was shifted to match the early systolic zero crossing in the measured transvalvular pressure. The predicted closing flow (grey line) shows excellent agreement with in vitro data (black line) over the simulation window. Note that the predicted flow data were shifted an additional 50 ms to the right due to the inertia-driven lag between pressure and flow in the measured data. (Measured data reprinted with permission from (Jensen et al. 2001). © AMBE.)
(iv) Acoustic response
It is now widely recognized that S1 is non-stationary. This feature was observed in both the computational model and the measured thoracic S1 from sheep in our laboratory. The predicted time–frequency signature was found to have a downward glide in frequency with a maximum of 72.0 Hz occurring at 0.060 s from pressure crossover. Similarly, the average maximum peak frequency for the measured thoracic S1 was 71.7±2.8 Hz and occurred 0.071±0.003 s from the peak of the QRS wave in the EKG. Chen et al. also found that measured ‘intraventricular’ S1 was either flat or in the shape of a descending crescent in the time–frequency plane (Chen et al. 1997a–c), suggesting a qualitative agreement between measured intraventricular S1 and the predicted intraventricular S1.
(b) Pathological changes
(i) Collagen fibre volume fraction (A)
Preliminary evidence suggests that the equilibrium of mitral leaflet collagen is dynamic, and that the operational longevity of mitral tissue is related to turnover (Quick et al. 1997; Dreger et al. 2002). It may be that routine remodelling driven by ‘contact guidance’ (Barocas & Tranquillo 1997) reinforces existent valvular anisotropy by varying the spatial density of leaflet collagen while preserving the underlying spatial orientation of collagen fibre bundles. In other words, it may be that routine remodelling centres on collagen volume fraction. Flow rates across the valve did not vary substantially with decreased and increased volume fraction. Small changes in coaptation times were observed in both the leaflet signals and the acoustic pressure. Peak stresses were higher in the increased volume fraction case but lower in the decreased volume fraction case. However, the stress distribution in both cases was similar to the normal model.
Perturbations to the volume fraction did not alter the pattern of anisotropy of the mitral leaflets and function was preserved. In fact, increased volume fraction led to decreased regurgitant volume. These findings suggest that valvular function is robust to what we have termed functional proliferation, i.e. proliferation of the microstructure that preserves the innate mechanical character of the valve leaflets by respecting the purposeful trajectories of mitral collagen bundles.
(ii) Collagen fibre stiffness (B)
Unloaded valvular collagen fibre bundles exhibit a characteristic waviness or crimp, the periodicity of which is believed to strongly influence the non-linearity of collagen tension/stretch behaviour and thus the stress/strain behaviour of mitral tissue (Cochran & Kunzelman 1991). The difference in periodicity of basal and marginal chordae, for example, explains the higher stiffness of the latter (Cochran & Kunzelman 1991). Parameter B governs the stiffness of individual effective fibres, and increases and decreases in the fibre stiffness are another example of functional proliferation. Despite profound perturbations to the fibre stiffness, the simulated valve remained competent. Parallel to perturbation of the volume fraction, changes in fibre stiffness did not produce regurgitation. In fact, the transmitral flow was little affected. However, stress was increased considerably both with increased and decreased fibre stiffness.
(iii) Collagen fibre splay (σ)
Preliminary evidence suggests that fibre splay, or the degree of local fibre alignment, varies—perhaps functionally—across mitral leaflets (Sacks et al. 2002). It is possible to hypothesize that alterations in collagen fibre splay is one of the disease pathways of mitral leaflet tissue. Furthermore, altered fibre splay may account for the disordering of collagen in myxomatous disease and strongly influences the mechanical coupling between deformation along fibre trajectories and the cross-fibre direction. This was manifest in both the quantitative and qualitative difference among principle stress patterns. Increasing the fibre splay created a more uniform distribution of stress in the bellies of anterior and posterior leaflets. Altered anisotropy also notably affected transmitral flow. Decreasing the fibre splay increased the transmitral flow to a value that could be classified as functionally regurgitant and significantly increased the end-of-simulation stress as well. Further, with reduced fibre splay, the peak stresses were shifted to the strut chord as well as to the leaflet margins. The leaflets had more flail in the reduced case and closure was accompanied by notable billowing. The result was a floppy valve with areas of high stress. Furthermore, the floppy leaflets closed later. The anterior closure peak was retarded by nearly 5 ms, while the posterior leaflet closure peak was delayed by almost 10 ms.
(iv) Isotropic phase (α)
Both fibrotic proliferation and calcification are pathologies that may lead to an increased leaflet stiffness due to alterations in the isotropic character. In the case of calcification, this isotropic character is due to the mineral having no preferred direction. In the case of fibrosis, it is believed that fibrotic fibrillogenesis has a random—and therefore isotropic—character. By altering the innate anisotropy of the leaflets, isotropic proliferation diminished the closing leaflet velocities, requiring larger pressure gradients for full coaptation. In addition, increased isotropic stiffness fundamentally altered both the fluid dynamics of transmitral flow and the end-of-simulation stress patterns.
5. Conclusion
The more we analyse the mitral valve, the more remarkable it appears in its elegant simplicity and ability to maintain function over a large period of time, range of physiologic states and through various pathological insults. Our initial FE models (without fluid flow) provided insight into normal function, and particular structural pathological changes and surgical correction. The addition of blood flow and an experimentally driven microstructural description of mitral tissue represent significant advances in computational studies of the mitral valve, which allow further insight to be gained. Despite the assumptions that went into this first non-linear fluid–structure coupled model, model predictions closely matched a wide range of available data. Further, material changes that preserved the anisotropy of the valve leaflets were found to preserve valve function. By contrast, material changes that altered the anisotropy of the valve were found to profoundly alter valve function. Thus, this coupled fluid–structure model constitutes a valid tool for researching the interaction between flow and mitral conformational abnormalities. Furthermore, it is an excellent tool for assessing the functional boundaries between normal and diseased mitral tissue as a function of tissue microstructure. This work is another building block in the foundation of a computational framework to aid in the refinement and development of a truly non-invasive diagnostic evaluation of the mitral valve. Ultimately, it represents the basis for simulation of surgical repair of pathological valves in a clinical and educational setting.
Footnotes
One contribution of 21 to a Theme Issue ‘Bioengineering the heart’.
References
- Arts T, Meerbaum S, Reneman R, Corday E. Stresses in the closed mitral valve: a model study. J. Biomech. 1983;16:539–547. doi: 10.1016/0021-9290(83)90068-4. doi:10.1016/0021-9290(83)90068-4 [DOI] [PubMed] [Google Scholar]
- Barocas V.H, Tranquillo R.T. An anisotropic biphasic theory of tissue-equivalent mechanics: the interplay among cell traction, fibrillar network deformation, fibril alignment, and cell contact guidance. J. Biomech. Eng. 1997;119:137–145. doi: 10.1115/1.2796072. [DOI] [PubMed] [Google Scholar]
- Billiar K.L, Sacks M.S. Biaxial mechanical properties of the native and glutaraldehyde-treated aortic valve cusp. Part II: a structural constitutive model. J. Biomech. Eng. 2000a;122:327–335. doi: 10.1115/1.1287158. doi:10.1115/1.1287158 [DOI] [PubMed] [Google Scholar]
- Billiar K.L, Sacks M.S. Biaxial mechanical properties of the natural and glutaraldehyde treated aortic valve cusp. Part I: experimental results. J. Biomech. Eng. 2000b;122:23–30. doi: 10.1115/1.429624. doi:10.1115/1.429624 [DOI] [PubMed] [Google Scholar]
- Brock R.C. The surgical and pathological anatomy of the mitral valve. Br. Heart J. 1952;14:489–513. doi: 10.1136/hrt.14.4.489. [DOI] [PMC free article] [PubMed] [Google Scholar]
- Chen D, Durand L.G, Guo Z, Lee H.C. Time-frequency analysis of the first heart sound. Part 2: an appropriate time-frequency representation technique. Med. Biol. Eng. Comput. 1997a;35:311–317. doi: 10.1007/BF02534082. doi:10.1007/BF02534082 [DOI] [PubMed] [Google Scholar]
- Chen D, Durand L.G, Lee H.C. Time-frequency analysis of the first heart sound. Part 1: simulation and analysis. Med. Biol. Eng. Comput. 1997b;35:306–310. doi: 10.1007/BF02534081. doi:10.1007/BF02534081 [DOI] [PubMed] [Google Scholar]
- Chen D, Durand L.G, Lee H.C, Wieting D.W. Time-frequency analysis of the first heart sound. Part 3: application to dogs with varying cardiac contractility and to patients with mitral mechanical prosthetic heart valves. Med. Biol. Eng. Comput. 1997c;35:455–461. doi: 10.1007/BF02525523. doi:10.1007/BF02525523 [DOI] [PubMed] [Google Scholar]
- Clark R.E. Stress–strain characteristics of fresh and frozen human aortic and mitral leaflets and chordae tendineae. Implications for clinical use. J. Thorac. Cardiovasc. Surg. 1973;66:202–208. [PubMed] [Google Scholar]
- Cochran R.P, Kunzelman K.S. Comparison of viscoelastic properties of suture versus porcine mitral valve chordae tendineae. J. Card. Surg. 1991;6:508–513. doi: 10.1111/j.1540-8191.1991.tb00352.x. [DOI] [PubMed] [Google Scholar]
- Cochran R.P, Kunzelman K.S. Effect of papillary muscle position on mitral valve function: relationship to homografts. Ann. Thorac. Surg. 1998;66(Suppl. 6):S155–S161. doi: 10.1016/s0003-4975(98)01100-x. doi:10.1016/S0003-4975(98)01100-X [DOI] [PubMed] [Google Scholar]
- Cochran R.P, Kunzelman K.S, Chuong C.J, Sacks M.S, Eberhart R.C. Nondestructive analysis of mitral valve collagen fiber orientation. ASAIO Trans. 1991;37:M447–M448. [PubMed] [Google Scholar]
- Cohn L.H. Mitral valve repair for ischemic mitral regurgitation. Adv. Cardiol. 2002;39:153–156. doi: 10.1159/000058922. [DOI] [PubMed] [Google Scholar]
- Dagum P, Timek T.A, Green G.R, Lai D, Daughters G.T, Liang D.H, Hayase M, Ingels N.B, Jr, Miller D.C. Coordinate-free analysis of mitral valve dynamics in normal and ischemic hearts. Circulation. 2000;102(Suppl. 19):III62–III69. doi: 10.1161/01.cir.102.suppl_3.iii-62. [DOI] [PubMed] [Google Scholar]
- Dal Pan F, Donzella G, Fucci C, Schreiber M. Structural effects of an innovative surgical technique to repair heart valve defects. J. Biomech. 2005;38:2460–2471. doi: 10.1016/j.jbiomech.2004.10.005. doi:10.1016/j.jbiomech.2004.10.005 [DOI] [PubMed] [Google Scholar]
- Dreger S.A, Taylor P.M, Allen S.P, Yacoub M.H. Profile and localization of matrix metalloproteinases (MMPs) and their tissue inhibitors (TIMPs) in human heart valves. J. Heart Valve Dis. 2002;11:875–880. [discussion 80] [PubMed] [Google Scholar]
- Einstein D.R, Reinhall P, Nicosia M, Cochran R.P, Kunzelman K. Dynamic finite element implementation of nonlinear, anisotropic hyperelastic biological membranes. Comput. Methods Biomech. Biomed. Eng. 2003;6:33–44. doi: 10.1080/1025584021000048983. doi:10.1080/1025584021000048983 [DOI] [PubMed] [Google Scholar]
- Einstein D.R, Kunzelman K.S, Reinhall P.G, Cochran R.P, Nicosia M.A. Haemodynamic determinants of the mitral valve closure sound: a finite element study. Med. Biol. Eng. Comput. 2004;42:832–846. doi: 10.1007/BF02345218. doi:10.1007/BF02345218 [DOI] [PubMed] [Google Scholar]
- Einstein D.R, Kunzelman K.S, Reinhall P.G, Nicosia M.A, Cochran R.P. Non-linear fluid-coupled computational model of the mitral valve. J. Heart Valve Dis. 2005a;14:376–385. [PubMed] [Google Scholar]
- Einstein D.R, Kunzelman K.S, Reinhall P.G, Nicosia M.A, Cochran R.P. The relationship of normal and abnormal microstructural proliferation to the mitral valve closure sound. J. Biomech. Eng. 2005b;127:134–147. doi: 10.1115/1.1835359. doi:10.1115/1.1835359 [DOI] [PubMed] [Google Scholar]
- Enriquez-Sarano M, Schaff H.V, Orszulak T.A, Tajik A.J, Bailey K.R, Frye R.L. Valve repair improves the outcome of surgery for mitral regurgitation. A multivariate analysis. Circulation. 1995;91:1022–1028. doi: 10.1161/01.cir.91.4.1022. [DOI] [PubMed] [Google Scholar]
- Ghista D.N, Rao A.P. Structural mechanics of the mitral valve: stresses sustained by the valve; non-traumatic determination of the stiffness of the in vivo valve. J. Biomech. 1972;5:295–307. doi: 10.1016/0021-9290(72)90046-2. doi:10.1016/0021-9290(72)90046-2 [DOI] [PubMed] [Google Scholar]
- Gillinov A.M, et al. Durability of mitral valve repair for degenerative disease. J. Thorac. Cardiovasc. Surg. 1998;116:734–743. doi: 10.1016/S0022-5223(98)00450-4. doi:10.1016/S0022-5223(98)00450-4 [DOI] [PubMed] [Google Scholar]
- Grossi E.A, et al. Ischemic mitral valve reconstruction and replacement: comparison of long-term survival and complications. J. Thorac. Cardiovasc. Surg. 2001;122:1107–1124. doi: 10.1067/mtc.2001.116945. doi:10.1067/mtc.2001.116945 [DOI] [PubMed] [Google Scholar]
- Hunter J, Seaton D, Lively W, Miller D, Stoner D. Modelling systolic mitral valve motion: a tool for clarifying mitral prolapse. Tex. J. Sci. 1983;35:4–36. [Google Scholar]
- Jamieson W.R, Edwards F.H, Schwartz M, Bero J.W, Clark R.E, Grover F.L. Risk stratification for cardiac valve replacement. National Cardiac Surgery Database. Database Committee of The Society of Thoracic Surgeons. Ann. Thorac. Surg. 1999;67:943–951. doi: 10.1016/s0003-4975(99)00175-7. doi:10.1016/S0003-4975(99)00175-7 [DOI] [PubMed] [Google Scholar]
- Jensen M.O, Fontaine A.A, Yoganathan A.P. Improved in vitro quantification of the force exerted by the papillary muscle on the left ventricular wall: three-dimensional force vector measurement system. Ann. Biomed. Eng. 2001;29:406–413. doi: 10.1114/1.1366672. doi:10.1114/1.1366672 [DOI] [PubMed] [Google Scholar]
- Komeda M, Glasson J.R, Bolger A.F, Daughters G.T, II, Niczyporuk M.A, Ingels N.B, Jr, Miller D.C. Three-dimensional dynamic geometry of the normal canine mitral annulus and papillary muscles. Circulation. 1996;94(Suppl. 9):II159–II163. [PubMed] [Google Scholar]
- Komeda M, Glasson J.R, Bolger A.F, Daughters G.T, II, Ingels N.B, Jr, Miller D.C. Papillary muscle-left ventricular wall ‘complex’. J. Thorac. Cardiovasc. Surg. 1997;113:292–300. doi: 10.1016/s0022-5223(97)70326-x. doi:10.1016/S0022-5223(97)70326-X discussion, pp. 300–301. [DOI] [PubMed] [Google Scholar]
- Kunzelman, K. 1991 Engineering analysis of mitral valve structure and function. Dissertation, University of Texas Southwestern Medical Center, Dallas, TX.
- Kunzelman K.S, Cochran R.P. Mechanical properties of basal and marginal mitral valve chordae tendineae. ASAIO Trans. 1990;36:M405–M408. [PubMed] [Google Scholar]
- Kunzelman K, Cochran R. Hemi-homograft replacement of the mitral valve: a finite element model. In: Huysmans H.A, David T.E, Westaby S, editors. Stentless bioprostheses. 2nd edn. Isis Medical Media, Ltd; Oxford, UK: 1999. pp. 31–38. [Google Scholar]
- Kunzelman K.S, Cochran R.P, Chuong C, Ring W.S, Verrier E.D, Eberhart R.D. Finite element analysis of the mitral valve. J. Heart Valve Dis. 1993;2:326–340. [PubMed] [Google Scholar]
- Kunzelman K, Reimink M.S, Verrier E.D, Cochran R.P. Replacement of mitral valve posterior chordae tendineae with expanded polytetrafluoroethylene suture: a finite element study. J. Card. Surg. 1996;11:136–145. doi: 10.1111/j.1540-8191.1996.tb00028.x. [discussion 146] [DOI] [PubMed] [Google Scholar]
- Kunzelman K.S, Reimink M.S, Cochran R.P. Annular dilatation increases stress in the mitral valve and delays coaptation: a finite element computer model. Cardiovasc. Surg. 1997;5:427–434. doi: 10.1016/s0967-2109(97)00045-8. doi:10.1016/S0967-2109(97)00045-8 [DOI] [PubMed] [Google Scholar]
- Kunzelman K.S, Reimink M.S, Cochran R.P. Flexible versus rigid ring annuloplasty for mitral valve annular dilatation: a finite element model. J. Heart Valve Dis. 1998a;7:108–116. [PubMed] [Google Scholar]
- Kunzelman K.S, Quick D.W, Cochran R.P. Altered collagen concentration in mitral valve leaflets: biochemical and finite element analysis. Ann. Thorac. Surg. 1998b;66(Suppl. 6):S198–S205. doi: 10.1016/s0003-4975(98)01106-0. doi:10.1016/S0003-4975(98)01106-0 [DOI] [PubMed] [Google Scholar]
- Laniado S, Yellin E.L, Miller H, Frater R.W. Temporal relation of the first heart sound to closure of the mitral valve. Circulation. 1973;47:1006–1014. doi: 10.1161/01.cir.47.5.1006. [DOI] [PubMed] [Google Scholar]
- Laniado S, Yellin E, Kotler M, Levy L, Stadler J, Terdiman R. A study of the dynamic relations between the mitral valve echogram and phasic mitral flow. Circulation. 1975;51:104–113. doi: 10.1161/01.cir.51.1.104. [DOI] [PubMed] [Google Scholar]
- Lim K.O, Boughner D.R. Scanning electron microscopical study of human mitral valve chordae tendineae. Arch. Pathol. Lab. Med. 1977;101:236–238. [PubMed] [Google Scholar]
- Lim K.H, Yeo J.H, Duran C.M. Three-dimensional asymmetrical modeling of the mitral valve: a finite element study with dynamic boundaries. J. Heart Valve Dis. 2005;14:386–392. [PubMed] [Google Scholar]
- Maisano F, Redaelli A, Pennati G, Fumero R, Torracca L, Alfieri O. The hemodynamic effects of double-orifice valve repair for mitral regurgitation: a 3D computational model. Eur. J. Cardiothorac. Surg. 1999;15:419–425. doi: 10.1016/s1010-7940(99)00071-8. doi:10.1016/S1010-7940(99)00071-8 [DOI] [PubMed] [Google Scholar]
- Maisano F, Redaelli A, Soncini M, Votta E, Arcobasso L, Alfieri O. An annular prosthesis for the treatment of functional mitral regurgitation: finite element model analysis of a dog bone-shaped ring prosthesis. Ann. Thorac. Surg. 2005;79:1268–1275. doi: 10.1016/j.athoracsur.2004.04.014. doi:10.1016/j.athoracsur.2004.04.014 [DOI] [PubMed] [Google Scholar]
- Masugata H, Senda S, Mizushige K, Lu X, Kinoshita A, Sakamoto H, Nozaki S, Sakamoto S, Matsuo H. Mitral valve tissue characterization using acoustic microscopy. J Cardiol. 1998;31(Suppl. 1):45–49. [discussion 50–51] [PubMed] [Google Scholar]
- May-Newman K, Yin F.C. A constitutive law for mitral valve tissue. J. Biomech. Eng. 1998;120:38–47. doi: 10.1115/1.2834305. [DOI] [PubMed] [Google Scholar]
- Miller G.E, Marcotte H. Computer simulation of human mitral valve mechanics and motion. Comput. Biol. Med. 1987;17:305–319. doi: 10.1016/0010-4825(87)90020-5. doi:10.1016/0010-4825(87)90020-5 [DOI] [PubMed] [Google Scholar]
- Nielsen S.L, Nygaard H, Fontaine A.A, Hasenkam J.M, He S, Andersen N.T, Yoganathan A.P. Chordal force distribution determines systolic mitral leaflet configuration and severity of functional mitral regurgitation. J. Am. Coll. Cardiol. 1999;33:843–853. doi: 10.1016/s0735-1097(98)00627-5. doi:10.1016/S0735-1097(98)00627-5 [DOI] [PubMed] [Google Scholar]
- Olson L.J, Subramanian R, Ackermann D.M, Orszulak T.A, Edwards W.D. Surgical pathology of the mitral valve: a study of 712 cases spanning 21 years. Mayo Clin. Proc. 1987;62:22–34. doi: 10.1016/s0025-6196(12)61522-5. [DOI] [PubMed] [Google Scholar]
- Perloff J.K, Roberts W.C. The mitral apparatus. Functional anatomy of mitral regurgitation. Circulation. 1972;46:227–239. doi: 10.1161/01.cir.46.2.227. [DOI] [PubMed] [Google Scholar]
- Pohost G.M, et al. The echocardiogram of the anterior leaflet of the mitral valve. Correlation with hemodynamic and cineroentgenographic studies in dogs. Circulation. 1975;51:88–97. doi: 10.1161/01.cir.51.1.88. [DOI] [PubMed] [Google Scholar]
- Priola D.V, Fellows C, Moorehouse J, Sanchez R. Mechanical activity of canine mitral valve in situ. Am. J. Physiol. 1970;219:1647–1651. doi: 10.1152/ajplegacy.1970.219.6.1647. [DOI] [PubMed] [Google Scholar]
- Quick D.W, Kunzelman K.S, Kneebone J.M, Cochran R.P. Collagen synthesis is upregulated in mitral valves subjected to altered stress. ASAIO J. 1997;43:181–186. doi:10.1097/00002480-199705000-00011 [PubMed] [Google Scholar]
- Quick D, Kunzelman K, Hata M, Hegge J, Rahko P, Weigl T, Cochran R. Effect of infarction and ACE inhibitors on the mitral valve. J. Ariz. Nev. Acad. Sci. 2004;37:94–99. doi:10.2181/1533-6085(2004)037<0094:EOIAAI>2.0.CO;2 [Google Scholar]
- Redaelli A, Guadagni G, Fumero R, Maisano F, Alfieri O. A computational study of the hemodynamics after ‘edge-to-edge’ mitral valve repair. J. Biomech. Eng. 2001;123:565–570. doi: 10.1115/1.1408938. doi:10.1115/1.1408938 [DOI] [PubMed] [Google Scholar]
- Reimink M.S, Kunzelman K.S, Verrier E.D, Cochran R.P. The effect of anterior chordal replacement on mitral valve function and stresses. A finite element study. ASAIO J. 1995;41:M754–M762. doi: 10.1097/00002480-199507000-00114. [DOI] [PubMed] [Google Scholar]
- Reimink M.S, Kunzelman K.S, Cochran R.P. The effect of chordal replacement suture length on function and stresses in repaired mitral valves: a finite element study. J. Heart Valve Dis. 1996;5:365–375. [PubMed] [Google Scholar]
- Roberts W.C. Morphologic features of the normal and abnormal mitral valve. Am. J. Cardiol. 1983;51:1005–1028. doi: 10.1016/s0002-9149(83)80181-7. doi:10.1016/S0002-9149(83)80181-7 [DOI] [PubMed] [Google Scholar]
- Rubenstein J.J, Pohost G.M, Dinsmore R.E, Harthorne J.W. The echocardiographic determination of mitral valve opening and closure. Correlation with hemodynamic studies in man. Circulation. 1975;51:98–103. doi: 10.1161/01.cir.51.1.98. [DOI] [PubMed] [Google Scholar]
- Rusted I.E, Scheifley C.H, Edwards J.E. Studies of the mitral valve. I. Anatomic features of the normal mitral valve and associated structures. Circulation. 1952;6:825–831. doi: 10.1161/01.cir.6.6.825. [DOI] [PubMed] [Google Scholar]
- Sacks M.S, He Z, Baijens L, Wanant S, Shah P, Sugimoto H, Yoganathan A.P. Surface strains in the anterior leaflet of the functioning mitral valve. Ann. Biomed. Eng. 2002;30:1281–1290. doi: 10.1114/1.1529194. doi:10.1114/1.1529194 [DOI] [PubMed] [Google Scholar]
- Salgo I.S, Gorman J.H, III, Gorman R.C, Jackson B.M, Bowen F.W, Plappert T, St John Sutton M.G, Henry Edmunds L. Effect of annular shape on leaflet curvature in reducing mitral leaflet stress. Circulation. 2002;106:711–717. doi: 10.1161/01.cir.0000025426.39426.83. doi:10.1161/01.CIR.0000025426.39426.83 [DOI] [PubMed] [Google Scholar]
- Salisbury P.F, Cross C.E, Rieben P.A. Chorda tendinea tension. Am. J. Physiol. 1963;205:385–392. doi: 10.1152/ajplegacy.1963.205.2.385. [DOI] [PubMed] [Google Scholar]
- Stein P.D, Sabbah H.N. Accentuation of heart sounds in anemia: an effect of blood viscosity. Am. J. Physiol. 1978;235:H664–H669. doi: 10.1152/ajpheart.1978.235.6.H664. [DOI] [PubMed] [Google Scholar]
- Votta E, Maisano F, Soncini M, Redaelli A, Montevecchi F.M, Alfieri O. 3-D computational analysis of the stress distribution on the leaflets after edge-to-edge repair of mitral regurgitation. J. Heart Valve Dis. 2002;11:810–822. [PubMed] [Google Scholar]
- Waller B.F, Morrow A.G, Maron B.J, Del Negro A.A, Kent K.M, McGrath F.J, Wallace R.B, McIntosh C.L, Roberts W.C. Etiology of clinically isolated, severe, chronic, pure mitral regurgitation: analysis of 97 patients over 30 years of age having mitral valve replacement. Am. Heart J. 1982;104:276–288. doi: 10.1016/0002-8703(82)90204-6. doi:10.1016/0002-8703(82)90204-6 [DOI] [PubMed] [Google Scholar]
- Yun K.L, Miller D.C. Mitral valve repair versus replacement. Cardiol. Clin. 1991;9:315–327. [PubMed] [Google Scholar]


