Abstract
Since the fifteenth century beginning with Leonardo da Vinci's studies, the precise structure and functional dynamics of the aortic root throughout the cardiac cycle continues to elude investigators. The last five decades of experimental work have contributed substantially to our current understanding of aortic root dynamics. In this article, we review and summarize the relevant structural analyses, using radiopaque markers and sonomicrometric crystals, concerning aortic root three-dimensional deformations and describe aortic root dynamics in detail throughout the cardiac cycle. We then compare data between different studies and discuss the mechanisms responsible for the modes of aortic root deformation, including the haemodynamics, anatomical and temporal determinants of those deformations. These modes of aortic root deformation are closely coupled to maximize ejection, optimize transvalvular ejection haemodynamics and—perhaps most importantly—reduce stress on the aortic valve cusps by optimal diastolic load sharing and minimizing transvalvular turbulence throughout the cardiac cycle. This more comprehensive understanding of aortic root mechanics and physiology will contribute to improved medical and surgical treatment methods, enhanced therapeutic decision making and better post-intervention care of patients. With a better understanding of aortic root physiology, future research on aortic valve repair and replacement should take into account the integrated structural and functional asymmetry of aortic root dynamics to minimize stress on the aortic cusps in order to prevent premature structural valve deterioration.
Keywords: aortic root dynamics, aortic valve, aortic cusp, torsion, shear
1. Introduction
The structure and function of the aortic valve has triggered scientific curiosity since the fifteenth century beginning with Leonardo da Vinci's studies of aortic valve motion and the role of the sinuses of Valsalva in terms of cusp closure motion (Robicsek 1991). Five centuries of scientific and technological development now permit us today to appreciate the beautiful simplicity and incredible complexity of the aortic valve and aortic root.
The last four decades of experimental work contributed substantially to our current understanding, and can be segregated as follows: (i) structural analyses using radiopaque markers or sonomicrometric crystals for detailed three-dimensional assessment of solid structure dynamics to assess independent modes of deformation and shear of the aortic root fibroskeleton (Thubrikar et al. 1977, 1979, 1984; Dagum et al. 1999; Lansac et al. 2002), (ii) blood flow analyses using time-resolved three-dimensional MR phase contrast velocity mapping to define aortic flow dynamics, vorticity and helicity with respect to valve structure and function (Kilner et al. 1993, 2000; Kvitting et al. 2004; Markl et al. 2004), (iii) coupled solid–fluid investigations to elucidate the dynamic interaction between structural deformation and flow (De Hart et al. 2000, 2003; Nicosia et al. 2003; Carmody et al. 2006), (iv) molecular studies that correlate microstructure and cellular expression with structural function, deformation, shear and haemodynamics (Chanthomas et al. 1993; Ranger et al. 1998; Roy et al. 2000; Misfeld et al. 2002; Hurlstone et al. 2003), and (v) finite-element computer model in evaluating the regional stresses of the aortic root (Grande et al. 1998, 2000; Gnyaneshwar et al. 2002). The various experimental preparations ranged from canine and ovine animal models to human subjects. Normal valve physiology, adrenergic and cholinergic and other intracellular and intercellular mechanisms, and various disease (e.g. Marfan syndrome, annuloaortic ectasia) and post-operative (e.g. after valve-sparing aortic root replacement) conditions have been explored. In this paper, we review and compare the most recent structural analyses on aortic root dynamics.
Brewer et al. (1976) first described aortic root expansion at the commissural level as an essential part of the aortic valve opening mechanism to reduce shear stress on the leaflets. They demonstrated in an isolated dog aortic root model that the commissures underwent a 16% diameter change during the cardiac cycle and postulated that an increase in diameter preceding ejection might facilitate aortic cusp opening. Subsequent work by Thubrikar et al. (1977, 1979, 1984) showed in dogs that this radial commissure displacement occurred before ejection and correlated closely with aortic pressure: when aortic pressure increased during isovolumic contraction (IVC), the commissures moved radially outwards, and then subsequently moved back inwards when aortic pressure decreased during isovolumic relaxation (IVR). These investigators also found that at any instant in the cardiac cycle, commissure diameter decreased as the systemic arterial pressure fell. Gnyaneshwar et al. (2002), using finite-element simulation, revealed that substantial aortic root dilation occurs before the leaflets begin to open, which alone is conjectured to contribute 20% of leaflet opening.
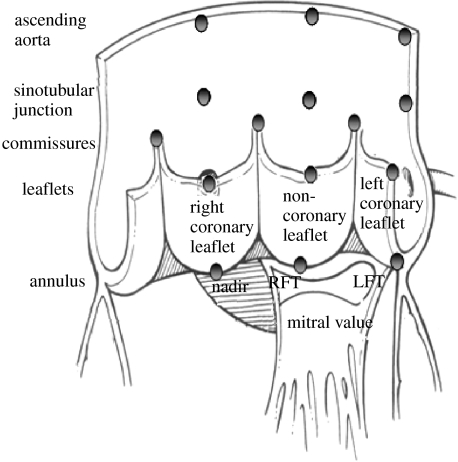
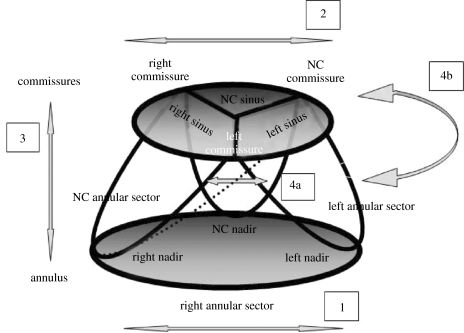
With these previous studies in mind, newer structural analyses (Dagum et al. 1999; Lansac et al. 2002), using in vivo radiopaque markers and sonomicrometric crystals, further described the complex aortic root dynamics in multiple modes of deformation during different phases of the cardiac cycle at different levels and regions of the aortic root. Dagum et al. (1999), from our laboratory, elucidated more precisely the interaction between aortic root deformation and leaflet opening, by using radiopaque markers (figure 1) in closed-chest sheep, and decomposed aortic root dynamics into four modes of deformation throughout the cardiac cycle (figure 2). In addition, Dagum et al. described the effects of changes in left ventricular (LV) volume, pressure gradients (LVP and transvalvular pressure) and LV contractility on the degree of aortic root deformation. In an open-chest acute ovine study, Lansac et al. (2002), using sonomicrometric crystals (figure 1), studied circumferential deformation of the aortic root at two additional levels: the sinotubular junction (STJ) and tubular segment of the ascending aorta above the STJ. They further resolved the cardiac cycle by splitting ejection into an initial third and a later two-thirds and diastole into mid-diastole and end-diastole. Combining Lansac et al.'s results with our analysis of leaflet marker motion and aortic root strain, we can begin to describe reliably the detailed aortic root dynamics relative to leaflet opening during the different phases of the cardiac cycle.
Figure 1.
Aortic root radiopaque markers and sonomicrometry crystal placement location. Dagum et al. (1999) and Lansac et al. (2002) placed radiopaque markers and sonomicrometry crystals, respectively, at the nadirs of each aortic cusp (left, right and non-coronary) and on the base and top of each commissure. Lansac et al. also placed three sonomicrometry crystals at the STJ and three at the ascending aorta level. Dagum et al. placed markers at the tip of each aortic leaflet. RFT, right fibrous trigone; LFT, left fibrous trigone. Aortic root illustration adapted from Mihaljevic et al. (2003).
Figure 2.
Four modes of aortic root deformation and the anatomy of the aortic base (annulus) and commissures. The aortic annulus is the coronet-like fibrous structure that supports the aortic leaflets, with the commissures attached to the cusps of the coronet. The coronet nadirs lie at the aortoventricular junction. Dagum et al. (1999) confirmed four distinct modes of aortic root deformation: (1) circumferential deformation at the base, (2) circumferential deformation at the level of the commissures, (3) longitudinal deformation and (4a and 4b) shear strain and torsional deformation.
In this paper, we first review and summarize the relevant structural analyses concerning aortic root deformations and describe aortic root dynamics in detail throughout the cardiac cycle. We then compare data between different studies and discuss the mechanisms responsible for modes of aortic root deformation, including the haemodynamic, anatomical and temporal determinants of these deformations. These modes of aortic root deformation are closely coupled to maximize ejection, optimize transvalvular ejection haemodynamics and perhaps, most importantly, reduce stress on the aortic valve cusps by optimal diastolic load sharing and minimizing ejection turbulence (Brewer et al. 1976; Thubrikar et al. 1984; Lockie et al. 1993; Grande et al. 1998; Vesely 2000; Gnyaneshwar et al. 2002). We feel that this more comprehensive understanding of aortic root mechanics and physiology will contribute to improved medical and surgical treatment methods, enhanced therapeutic decision making and better post-intervention care of patients. Future research focused on aortic valve repair and replacement should take into account the integrated structural and functional asymmetry of aortic root dynamics that minimizes stress on the aortic cusps and optimizes transvalvular flow in order to prevent premature structural valve deterioration.
2. Different critical definitions of phases of the cardiac cycle
Dagum et al. (1999) and Lansac et al. (2002) relied on different signals to characterize the phases of the cardiac cycle. Dagum et al. defined ED as the videofluoroscopic frame containing the peak of the ECG R-wave, whereas Lansac et al. used the beginning of LV pressure increase (dP/dt>0). End IVC was defined as the frame where LV volume fell by greater than 3 ml by Dagum et al., but as the crossing point of LV and aortic pressure tracings by Lansac et al. End of ejection was defined as the frame preceding maximum negative dP/dt by Dagum et al., but by the aortic dicrotic notch by Lansac et al. Both groups defined the end of IVR as the point of minimum LV pressure after systole.
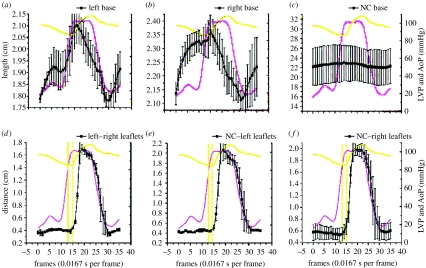
These discrepancies in the definitions of cardiac phases between those used by Dagum et al. and Lansac et al. appear subtle, yet they lead to real differences in our understanding of aortic root and valve deformation dynamics. Although not reported in the original publication (Dagum et al. 1999), our experimental study included markers at the free margin of each aortic cusp, which allowed us to resolve this discrepancy. Dagum et al.'s timing definitions of the phases of the cardiac cycle were consistent with aortic valve opening and closing as determined by motion of the aortic cusp markers (figure 3), e.g. the signal used to indicate end IVC and beginning ejection occurred precisely when the leaflets began to move apart (as measured by the distances between the cusp markers). Nonetheless, we will now walk through three-dimensional aortic root motion during the phases of the cardiac cycle and contrast our and Lansac et al.'s findings.
Figure 3.
Circumferential deformation of annular sectors ((a) left; (b) right; (c) NC annular sector) and the distance between corresponding pairs of aortic leaflet markers signalling leaflet opening and closure ((d) left and right leaflets; (e) NC and left leaflets; (f) NC and right leaflets) throughout the cardiac cycle. Data are expressed as group mean±s.e.m. Note that base circumferential expansion peaked at the end of IVC (when aortic valve opened) from which it thereafter contracted progressively throughout ejection and IVR (when the valve closed). Furthermore, we observed that the crossing point of the aortic pressure (AoP) and LV pressure tracings ((d–f) straight vertical line) preceded leaflet opening ((d–f) dashed vertical line) by approximately two frames or 33.3 ms.
3. Aortic root geometry at end-diastole
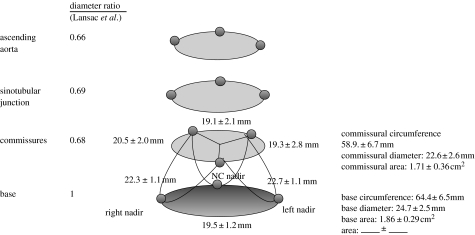
Figure 4 illustrates the group mean±s.d. of the aortic root dimensions at end-diastole for six sheep in Dagum et al.'s experiment at Stanford. At ED, the aortic root had a truncated cone shape. The annular circumference was larger than the commissural (STJ) circumference (64.4±6.5 mm versus 58.9±6.7 mm; Dagum et al. 1999). The cross-sectional area at the base and commissures was 1.86±0.29 and 1.71±0.36 cm2, respectively (Dagum et al. 1999; figure 4). Similarly, in Lansac et al.'s (2002) other sheep experiment, the area of the base was larger than that of the commissures and STJ by 52±2 and 49±4%, respectively. The diameter ratios (with respect to the base diameter) of the commissures, STJ and ascending aorta were 0.68, 0.69 and 0.66, respectively (Lansac et al. 2002).
Figure 4.
Aortic root geometry at end-diastole. Data from Dagum et al. and expressed as group mean±s.d. per cent change of deformation (longitudinal, circumferential, shear and torsion) during end-diastole unless specified otherwise. The commissural circumference, computed as the sum of the three inter-marker lengths, and diameter, derived assuming a circular cross section, were 58.9±6.7 and 22.6±2.6 mm, respectively. The base circumference and diameter, similarly computed and derived, were 64.4±6.5 and 24.7±2.5 mm, respectively. The base-to-commissure diameter ratio was 1 : 0.92 (Dagum et al. 1999). Lansac et al. (2002) observed the following diameter ratio between the commissures, STJ and the ascending aorta with respect to the base: 0.68, 0.69 and 0.66, respectively.
4. Aortic root deformations during IVC
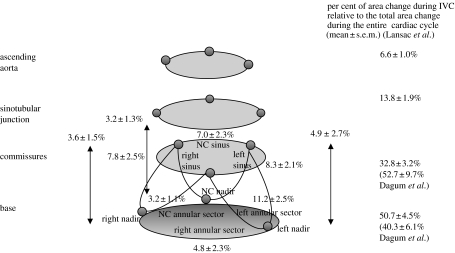
Figure 5 depicts aortic root deformation during IVC, when aortic root expansion begins. Annular circumferential expansion, however, was not uniform during IVC: expansion was greatest in the left annular sector (11.2±2.5%) and least in the non-coronary (NC) annular sector (3.2±1.1%; see figure 2 for definition of angular sectors; Dagum et al. 1999). Regional differences in tensile strength and tissue content could account for this heterogeneous circumferential deformation of the annulus. The NC annular sector is continuous with the anterior mitral annulus (aortic–mitral continuity and right fibrous trigone), which is composed predominantly of fibrous tissue (Zimmerman & Bailey 1962; Zimmerman 1969). In our experiment, the area change (relative to total change over the entire cardiac cycle) at the base and commissures increased by 40±6 and 53±10%, respectively, during IVC (figure 5). Conversely, using different timing markers, Lansac et al. observed that the base, commissures, STJ and ascending aorta cross-sectional area expanded by 51±5, 33±3, 14±2 and 7±1%, respectively, during IVC (Lansac et al. 2002).
Figure 5.
Aortic root deformation during IVC. Data from Dagum et al. and expressed as group mean±s.d. per cent change of deformation (longitudinal, circumferential, shear and torsion) during IVC unless specified otherwise. Circumferential expansion of the base was not uniform during IVC (Dagum et al. 1999), being greatest in the left base and least in the non-coronary (NC) base. The circumferential expansion was paralleled by longitudinal elongation. In contrast to the non-uniform expansion of the base, both commissural expansion and longitudinal deformations were uniform during IVC in the left, right and NC regions. Aortic root shear or torsion deformation was not observed during IVC (Dagum et al. 1999). The per cent area change relative to total change over the entire cardiac cycle of the base and commissures during IVC were 40.3±6.1 and 52.7±9.7%, respectively. Lansac et al. observed the following per cent area change during IVC at different levels of the aortic root: base, 51±5%; commissures, 33±3%; STJ, 14±2%; ascending aorta, 6.6±1%.
Dagum et al. found that circumferential expansion of the aortic root was accompanied by longitudinal elongation. In contrast to the non-uniform dilation of the base (annulus), dilation at the commissures and elongation of the aortic root were uniform during IVC in the left (8.3±3.1 and 4.9±2.7%), right (7.8±2.5 and 3.6±1.5%) and NC (7±2.3 and 3.2±1.3%) regions (figure 2). We also did not observe aortic root shear or torsion deformation during IVC (figure 5).
Using a multivariate statistical general linear model (GLM), Dagum et al. identified that end-diastolic volume (EDV) and maximum LV dP/dt significantly predicted changes in the deformation of the left annular sector, but not the right and NC annular sectors during IVC. EDV was also a significant predictor of commissural dilation at the left and right sinus regions, but not the NC sinus region. The increase in aortic root dilation at both the base and the commissures during IVC with increasing EDV suggests that the aortic root accommodates more pre-ejection volume that might improve transvalvular haemodynamics and reduce turbulent damage to the aortic cusps.
5. Aortic root deformations during ejection
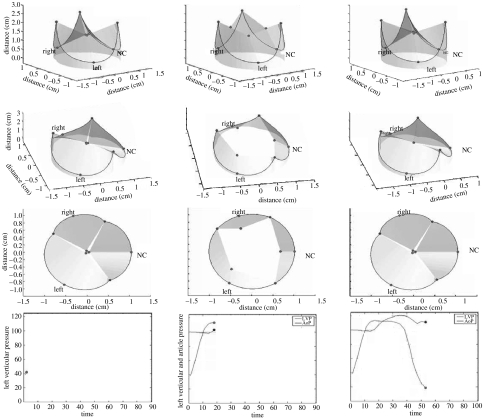
Figure 6 illustrates aortic root deformation during ejection. The base (annulus) underwent circumferential contraction, whereas the commissures continued to expand during ejection. Figure 7 shows images from a three-dimensional computer-generated animation of aortic root motion using marker data from Dagum et al.'s experiment demonstrating that during ejection the cross-sectional shape of the aortic root changes from a clover-leaf shape to a circular shape.
Figure 6.
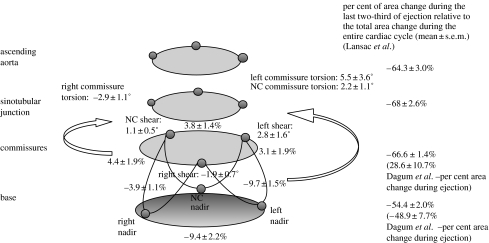
Aortic root deformation during ejection. Data from Dagum et al. (1999) expressed as group mean±s.d. per cent change of deformation (longitudinal, circumferential, shear and torsion) during ejection unless specified otherwise. Longitudinal deformation was not observed during ejection (Dagum et al. 1999). Contraction of the base during ejection was not homogeneous: the left and right bases contracted significantly more than the base in the NC sector. In addition, the aortic root underwent non-uniform shearing during ejection that resulted in torsional deformation of the root. The left and NC commissures underwent anticlockwise torsion, while the right commissure underwent clockwise torsion (when looking from the aorta and towards the ventricle). The per cent area change of the base and commissures during ejection was −49±8 and 30±11%, respectively (Dagum et al. 1999). Lansac et al. (2002) observed the following per cent area change at each aortic root level during the last two-thirds of ejection: base, −54±2%; commissures, −67±1%; STJ, −68±3%; ascending aorta, −64±3%.
Figure 7.
Three-dimensional computer-generated animation snapshots of the aortic root using the radiopaque marker data from Dagum et al.'s (1999) experiment at Stanford. Note that during ejection, the aortic root had a tendency to change from a clover-shaped cone to a more cylindrical shape. This computer simulation of the deformation of the annular fibroskeleton based on the marker data revealed that transformation from clover to cylindrical shape was explained by the geometric changes of the base relative to the commissures. The base underwent circumferential contraction, whereas the commissures continued to expand during ejection and at the point when both were of equal diameter, the aortic root achieved a cylindrical shape.
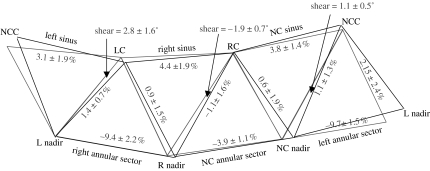
Annular contraction during ejection was again not homogeneous: the left (−9.7±1.5%) and right (−9.4±2.2%) annular sectors contracted significantly more than the NC sector (−3.9±1.1%). In addition, the aortic root underwent non-uniform shearing during ejection that resulted in torsion deformation of the root (figure 6). The left (5.5±3.6%) and NC (2.2±1.1%) sinuses underwent clockwise torsion, while the right aortic root underwent anticlockwise torsion (−2.9±1.1%; when looking from the aorta down into the ventricle). Shear deformation of the left, right and NC root were calculated from the triplet of markers (one commissures marker and two nadir markers) defining the aortic root regions. Torsion was the degree of rotation of the commissures relative to the base caused by the shear deformation at each region. Figure 8 illustrates this shear and torsional deformation with the aortic root unfolded.
Figure 8.
Shear (torsional deformation) of the aortic root. Data from Dagum et al. (1999) expressed as group mean±s.d. per cent change of deformation (longitudinal, circumferential, shear and torsion) during ejection. Shear deformation of the left, right and NC root was calculated from the triplet of markers (one commissures marker and two nadir markers) defining the aortic root regions. Torsion measured the degree of rotation of the commissures relative to the base caused by shear deformation at each region (when looking down from the aorta towards the ventricle). Black triangle, baseline configuration at end IVC; grey triangle, deformed configuration at the end of ejection.
Dagum et al. found that during ejection, the base contracted and the commissures dilated with per cent area changes (relative to the total change over the entire cardiac cycle) of −49±8 and 29±11%, respectively. In contrast, Lansac et al. (2002) observed that the aortic root continued to expand into the first third of ejection and contracted during the last two-thirds of ejection. The base, commissures, STJ and ascending aorta per cent area change during the first third of ejection were 49±5, 67±3, 86±2 and 93±1%, respectively. During the last two-thirds of ejection, their per cent area change values were −54±2, −67±1, −68±3 and −64±3%, respectively.
Using a multivariate GLM, Dagum et al. showed that ejection fraction was the only independent predictor of annular circumferential contraction during ejection, while maximum LV dP/dt was the only variable associated with aortic root shear deformation (Dagum et al. 1999). They observed a negative regression coefficient between shear in the right aortic root region, e.g. the right root region underwent increasing anticlockwise shear when maximum LV dP/dt was higher. In contrast, the left and NC regions had a positive regression coefficient, indicating that increasing clockwise shear deformation occurred when maximum LV dP/dt rose.
6. Aortic root deformations during IVR
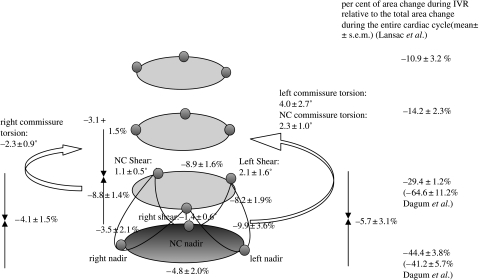
Figure 9 depicts the aortic root deformations during IVR, when Dagum et al. showed that the aortic root underwent further circumferential contraction (Dagum et al. 1999). Greatest circumferential contraction of the base (annulus) occurred at the left base (−9.9±3.6%), and the least at the NC base (−3.5±2.1%). In contrast to the asymmetric circumferential contraction of the base, the left, the right and NC sinuses at the commissures contracted symmetrically during IVR (figure 9; Dagum et al. 1999). The per cent area change during IVC of the base and commissures were −42±6 and −65±11%, respectively (Dagum et al. 1999). During IVR, in addition to aortic root shear and torsion deformation, the root underwent longitudinal compression, which was symmetric among the left (−5.7±3.1%), right (−4.1±1.5%) and NC (−3.1±1.5%) regions (figure 9; Dagum et al. 1999). Similarly, Lansac et al. observed that the base (−44±4%), commissures (−29±1%), STJ (−14±2.3%) and ascending aorta (−11±3%) underwent circumferential contraction during IVR (Lansac et al. 2002).
Figure 9.
Aortic root deformations during IVR. Data from Dagum et al. expressed as group mean±s.d. per cent change of deformation (longitudinal, circumferential, shear and torsion) during IVR unless specified otherwise. During IVR, the aortic root underwent further circumferential contraction (Dagum et al. 1999). The greatest circumferential contraction of the annulus occurs at the left base and the least at the NC base. In contrast to asymmetric annular circumferential contraction, the left, right and NC sinuses at the commissures contracted symmetrically. In addition, during IVR, the aortic root sheared and underwent torsional deformation and longitudinal compression. Longitudinal compression of the aortic root was symmetric among the left, right and NC regions of the aortic root (Dagum et al. 1999). The per cent area change relative to the total change over the entire cardiac cycle of the base and commissures during IVR was −41±6 and −65±11%, respectively (Dagum et al. 1999). Lansac et al. (2002) observed the following per cent area change during IVR at different levels of the aortic root: base, −44±4%; commissures, −29±1%; STJ, −14±2%; ascending aorta, −10.9±3.2%.
In our experiment, the multivariate GLM identified that minimum LVP at the end of IVR and change in transvalvular pressure gradient (ΔTVG) during IVR were the only significant haemodynamic predictors of left and right base contraction during IVR. The left base underwent more circumferential contraction as minimum LVP decreased or ΔTVG increased, whereas the right base contracted less as minimum LVP fell and ΔTVG rose. Circumferential contraction of the NC base was not significantly affected by minimum LVP and ΔTVG. These findings suggest dynamic load redistribution from right to left base during IVR as minimum LVP decreases or ΔTVG increases. Commissural circumferential contraction, however, increased in a symmetrical and uniform manner as minimum LVP fell (Dagum et al. 1999). Longitudinal compression of the left and NC aortic root regions increased as minimum LVP fell, but not in the right root region. This again suggests a dynamic redistribution of load during IVR, with the left base and root region sustaining proportionally greater amounts of stress (Dagum et al. 1999).
7. Aortic root deformations during diastole
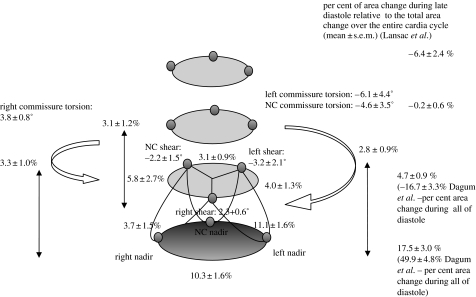
Figure 10 illustrates aortic root deformations during diastole. During early diastole, the aortic root recoiled from its dynamically loaded configuration at the end of IVR (Dagum et al. 1999) by expanding circumferentially and elongating longitudinally. We noticed this rapid recoil in figure 3 as well, where circumferential deformations at both the bases showed a sharp inflection point at the end of IVR. Expansion at the base during early diastole was asymmetric, with the NC base expanding the least. During diastole, the base and commissure per cent area change were 50±5 and −17±3%, respectively. In addition, the aortic root untwisted and exhibited shearing and torsion deformation in a direction opposite to that seen during ejection and IVR (figure 10; Dagum et al. 1999). In contrast, Lansac et al. showed that the dynamics of aortic root re-expansion were different at each level during diastole (Lansac et al. 2002). Although the basal (17.5±3%) and commissural (4.7±0.9%) areas re-expanded, the STJ (−0.2±0.6%) and ascending aorta (−6.4±2.4%) areas decreased.
Figure 10.
Aortic root deformations during diastole. Data from Dagum et al. expressed as group mean±s.d. per cent change of deformation (longitudinal, circumferential, shear and torsion) during diastole. During early diastole, the aortic root recoiled from its dynamically loaded configuration at the end of IVR (Dagum et al. 1999). The aortic root expanded circumferentially and elongated longitudinally. This rapid recoil can also be appreciated in figure 3, where circumferential deformations at both the base and the commissures showed a sharp inflection point at the end of IVR. Base expansion during early diastole was asymmetric, with the NC base having the least expansion. The per cent area change relative to total change over the entire cardiac cycle of the base and commissures was 50±5 and −17±3%, respectively. In addition, the aortic root untwisted and exhibited shearing and torsional deformation in a direction opposite to that seen during ejection and IVR (Dagum et al. 1999). Lansac et al. (2002) observed that the dynamics of re-expansion were different at each level during diastole. Although the basal (18±3%) and commissural (4.7±0.9%) areas re-expanded, the STJ (−0.2±0.6%) and ascending aorta (−6.4±2.4%) areas decreased during late diastole.
The multivariate GLM revealed no significant correlation between aortic root deformation and haemodynamic variables during diastole, suggesting that diastolic deformation is predominantly a recoiling process that restores the aortic root to its equilibrium configuration (Dagum et al. 1999).
8. Discussion
The studies we reviewed paint a complex picture of aortic root dynamics during the cardiac cycle. Dagum et al. (1999) decomposed aortic root dynamics into four modes of deformation throughout the cardiac cycle: circumferential deformation at the commissures (approximating the STJ); circumferential deformation at the root base (approximating the aortoventricular junction or annulus); deformation of the aortic root along its long axis and shear (torsion) deformation of the root. In a closed-chest, in vivo sheep study of the aortic root, they showed that these modes of deformation vary by aortic root region (right, left and non-coronary root region and cusp) and during phases of the cardiac cycle (IVC, ejection, IVR and diastole). In an open-chest acute ovine study, Lansac et al. (2002) studied circumferential deformation of the aortic root and aorta at the base, commissures, STJ and ascending aorta. They further resolved the cardiac cycle by splitting ejection into the first third and the last two-thirds, and by splitting diastole into mid-diastole and end-diastole. Lansac et al. corroborated Dagum et al.'s finding of asymmetric deformation between the right, left and non-coronary regions, but disputed the timing of the changes during the cardiac cycle; they concluded that the four anatomic root and aortic levels studied underwent circumferential expansion in an orderly progression from end-diastole, through IVC and into the first third of ejection (Lansac et al. 2002). During the last two thirds of ejection, during IVR, and during mid-diastole, the circumference contracted at all five levels. In contrast to these results, Dagum et al. observed that circumferential expansion peaked at the end of IVC from which it contracted progressively throughout ejection and IVR. Furthermore, Dagum et al. found that minimum circumference was reached at the end of IVR followed by a rapid re-expansion during early diastole and a slower progressive expansion during mid- and late diastole. This discrepancy raises concern pertaining to the timing markers selected to define the phases of the cardiac cycle. Dagum et al.'s experiment fortuitously included markers on the free margin of each aortic cusp (figures 1 and 3). Based on this information, the timing markers we used to define end IVC and beginning ejection occurred when the aortic cusps began to separate, which indicates that aortic root circumference at the base or annulus peaks at the end of IVC and then contracts progressively during the entire ejection phase (figure 3). Figure 3 also reveals that crossing of the aortic and LV pressures preceded leaflet opening by approximately two frames or 33.3 ms. This result, although paradoxical at first blush, is perfectly sensible when we consider that the speed of the pressure wave that traverses the left ventricle to the aortic root is not infinite unless the LV and aortic root have zero compliance during IVC, e.g. isostatic contraction. Our measurements of aortic root deformations during IVC confirm that the aortic root is compliant during this time period. The wave speed, therefore, must be finite and the time it takes for it to traverse the distance between the two micromanometer pressure transducers, one placed at the LV apex and a second placed immediately downstream to the aortic valve, is accountable for the time lag between the crossing of the pressure readings and leaflet opening motion.
(a) Kinematic versus dynamic
The precise functional dynamics of the aortic root, its haemodynamic, biomechanical and molecular correlates during the normal cardiac cycle, and its response to prolonged stresses continues to elude investigators. In reviewing the body of research focused on aortic root structural dynamics, it behoves us to differentiate clearly between kinematic and dynamic studies. Kinematics is the study of the three-dimensional spatial coordinates of objects over time (e.g. markers or sonomicrometer crystals). Dynamics is the formulation of constitutive equations that govern the object (e.g. the pressure or forces acting on the object or an object's material properties, such as elasticity or plasticity). Given a set of initial conditions and boundary conditions, the solution of these equations yields the kinematics of the object under study. The complexity of the aortic root and valve, however, do not lend themselves to a straightforward model in terms of a set of constitutive equations.
(b) Energy balance equation for fluid
A thorough treatment of aortic root dynamics must await simultaneous resolution of blood velocity vector fields and strain deformation of the aortic cusp tissue. In the interim, to bridge this gap and to provide a mechanistic underpinning to the various results reviewed here, we invoke a sensible coupled haemodynamic and structural mechanic model of the aortic root that uses pressure measurements as a proxy to applied stresses. Central to this approximation is the energy balance equation for a fluid,
where dW/dt is the rate at which work is done on the fluid; ρ is the fluid density; q2 is the norm of the velocity vector field and u1, u2 and un are unit vectors normal to the boundaries A1, A2 and S, which label the inflow, outflow and aortic root wall surfaces, respectively. These last three terms represent the flow of fluid kinetic energy into the aortic root across the inflow boundary A1, the outflow boundary A2 and across the surface S when the aortic root dilates. The first term represents the rate of kinetic energy change of the fluid within the containment boundaries.
(c) Aortic root deformations correlation with fluid stress
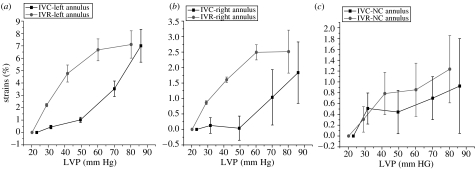
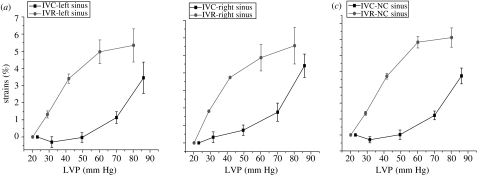
To synthesize a uniform understanding of the findings in Dagum et al.'s experiment, we invoked the energy balance equation for a fluid to correlate the observed aortic root deformations with first approximations of the haemodynamic changes during the cardiac cycle. The stress exerted by the blood on the aortic root can be decomposed into a normal stress, or pressure, and a shear stress tangential to the aortic root structures, which is caused by blood flow. During both IVC and IVR, we can consider the blood in the aortic root to have zero velocity in the axial direction, and the stress during these two phases on the root must predominantly be due to LV pressure changes. Because these pressure changes are approximately the same magnitude but of opposite signs during these two phases, we would expect that the deformations during IVC and IVR would also be of similar magnitude and opposite in sign. Additionally, because the stress is normal stress, or pressure, that cannot exert any shear force that might cause torsion deformation, we would expect root deformation to primarily be circumferential and longitudinal. In other words, we expect the aortic root to undergo inflation deformation during IVC and deflation during IVR. Dagum et al.'s findings confirm these expectations for the most part. Circumferential base and commissure expansion and longitudinal root expansion during IVC and IVR were similar in magnitude and opposite in sign, as predicted (figures 11 and 12). Lansac and colleagues confirmed these findings for circumferential expansion at the base and commissures, but remarked that ambiguity in defining IVC and IVR timing markers precluded us from properly interpreting their results.
Figure 11.
Annular circumferential per cent deformation with changes in LVP during IVC and IVR. Data are expressed as group mean±s.e.m. Annular circumferential stress–strain response for each of the three segments was nonlinear. Furthermore, analysis of stress–strain deformation showed marked hysteresis from IVC to IVR in the (a) left and (b) right annular sectors, but no hysteresis effect in the (c) NC annular sector.
Figure 12.
Commissural circumferential per cent deformation with changes in LVP during IVC and IVR. Data are expressed as group mean±s.e.m. Commissural circumferential stress–strain response for each of the three segments was nonlinear. Furthermore, stress–strain deformation showed marked hysteresis from IVC to IVR in all the three commissural segments. (a) Left sinus, (b) right sinus and (c) NC sinus.
In contrast to what we might expect from our naive pressure model, Dagum and associates confirmed significant shear deformation of the root during IVR that was not present during IVC. We can only speculate on the nature of this shear deformation. Shear and torsional deformation of the root can arise from shear stress exerted by blood flow and from anisotropy of the biomechanical properties of the aortic fibroskeleton. To understand the latter, consider three equilength solid struts A, B and C forming an equilateral triangle as might be found in a truss of a bridge. If the elasticity of any two struts differs, they deform unevenly in response to a load applied at a vertex; this non-uniform strain creates a shear deformation of the structure. The analogy of bridge struts is not too distinct from the fibroskeleton structure, as during IVR the leaflets transmit the transvalvular pressure gradient onto the fibroskeleton through their attachments at the commissures and coronet-shaped annulus. Differences in the material properties of the fibroskeleton and surrounding tissues would create non-uniform strain responses to loads imposed during IVR and cause shear deformation. On the other hand, we would also expect a reversal of this pressure gradient (as occurs during IVC) to create a shear in the opposite direction, which was not observed in our experiment (Dagum et al. 1999).
(d) Asymmetry and hysteresis of the aortic root
A closer inspection of circumferential deformation during IVC and IVR reveals two remarkable, albeit not unexpected, results. Owing to the near absence of any blood velocity vector field during IVC and IVR and the common range in LV pressure changes during those two phases, we predicted as a reasonable first approximation that the haemodynamic stress on the aortic root during IVC and IVR should be symmetric. Notwithstanding this assumption, the circumferential strain at both the base and the commissures was notably not symmetric. During both IVC and IVR, the strains across all three segments are markedly nonlinear (figures 11 and 12), consistent with the observations of numerous investigators confirming viscoelasticity of living tissue (Hansen et al. 1995; Vaishnav et al. 1972; Young et al. 1977). This viscoelasticity, however, exhibits a large hysteresis at both the base and the commissures (figures 11 and 12). In our closed-chest ovine study, material strain history effects were not present, and the aortic root exhibited pseudoelastic behaviour, i.e. we can consider the aortic root as composed of distinct elastic material during both loading (IVC) and unloading (IVR). Hansen et al. (1995) noted similar nonlinear behaviour during IVR unloading at the commissures in a cadaveric study of the aortic root that was properly preconditioned to eliminate strain history effects. These investigators did not report stress–strain properties during IVC, but they observed the pseudoelastic properties of the aortic root, as documented in our experiment. Other researchers (Calderon et al. 1985; Nadasy et al. 1988; Lanne et al. 1992) have documented similar arterial hysteresis in large arteries.
(e) Aortic root dilatation
Ejection begins at the end of IVC and continues until the beginning of IVR, which is timed with the closure of the aortic valve as naively signalled by the dicrotic notch reflected by the aortic pressure curve. Despite the precise kinematic events heralding the end of ejection, physiological ejection is marked by the progressive and strictly monotonic decrease in LV volume as the LV blood empties into the aorta; therefore, our finding that the aortic root base (or annulus) circumference decreases progressively during ejection is not surprising (Dagum et al. 1999). The aortic root base is contiguous with the LV myocardial free wall, interventricular septum and fibrous aortic–mitral curtain, and histological studies have demonstrated myocytes extending into the interleaflet triangles (Sutton et al. 1995). These anatomic and histological observations correlate well with the findings that the posterior base, mostly adjacent to the left fibrous trigone and aortic–mitral fibrous curtain, had significantly less contraction during ejection.
(f) Shape changes of the aortic root
In contrast to the decrease in base circumference, we found that the commissural circumference continued to dilate during ejection in an axisymmetric fashion, which might be expected based on the radial symmetry of the aortic root at the commissures or STJ. The shape of the aortic root at end-diastole is conical with the basal cross-sectional area being larger than the commissural (STJ) area, as documented by both Dagum et al. and Lansac et al. During IVC, the root dilates from the increase in pressure and its conical shape continues into ejection. At some point during ejection owing to the continued dilation at the commissures and the progressive decrease in base circumference, the aortic root assumes a cylindrical shape. This cylindrical form probably minimizes the pressure gradient across the root, thereby optimizing systolic flow and contributing to leaflet closure.
(g) Solid–fluid interactions
During ejection, we cannot apply the zero-velocity simplification to the energy balance equation that we used to explore changes during IVC and IVR. Nonetheless, we can gain insight into the solid–fluid interactions in the aortic valve by simplifying this equation as follows. If we ignore viscous and gravity effects and assume that the flow velocity v is uniform across the root and axially directed, we get the following equation of motion for blood in the aortic root:
where ρ is the blood density; ∂v/∂z and ∂p/∂z are the velocity and pressure gradients in the direction of flow, respectively and ∂v/∂t is the blood acceleration or deceleration in the direction of blood flow. The velocity gradient is present only if the cross-sectional areas between the base and the commissures differ; because blood flow is moving from a larger cross section to a smaller cross section, conservation of mass dictates that velocity must increase proportionally. During ejection, therefore, this term is positive and reaches zero if the root achieves a cylindrical shape. For any given instantaneous pressure gradient, the ventricle can deliver more blood across the aortic root when this term vanishes.
Paradoxically, a cylindrical aortic root both optimizes flow and initiates early leaflet closure. When the velocity gradient disappears, the pressure across the aortic valve reverses as the blood flow begins to decelerate. Note that deceleration of flow implies a negative value for ∂v/∂t, and consequently a positive pressure gradient ∂p/∂z must exist in moving across the valve from LV to aorta. This gradient applied to the leaflets begins to move them towards closure. Henderson & Johnson (1912) verified this haemodynamic phenomenon in their experimental work in the early part of the twentieth century. The preceding haemodynamic explanation in terms of the constitutive equations of flow was first described by Lee & Talbot (1979).
If the velocity gradient across the aortic root persists, flow deceleration is offset by the positive velocity gradient and pressure reversal occurs later in ejection. This means that the leaflets begin to close later in ejection. The leaflet edges must traverse the same distance within a shorter time period, thereby increasing the speed at which the leaflets close which simultaneously increases the closing stress on the cusps. Aortic valve pathology, aortic valve replacement and valve-sparing aortic root replacement operations may all affect the mechanical properties of the aortic root, eliminating or delaying the ability of the root to achieve a cylindrical shape during ejection and thereby increasing cuspal closure stress and predisposing to degenerative calcification or other inflammatory changes.
(h) Aortic root torsion and shear
We also noted significant torsion deformation of the aortic base relative to the commissures during ejection. The deformation was asymmetric with the largest clockwise shear deformation (viewed from the aorta towards the ventricle) occurring in the area of the left interleaflet triangle followed by the posterior (or non-coronary) region. The area of the right interleaflet triangle underwent torsional deformation in the opposite direction, but of similar magnitude as that in the posterior region. This resulted in a net anticlockwise torsional deformation during ejection. Studies using time-resolved three-dimensional magnetic resonance phase contrast velocity mapping during ejection reveal characteristic helical blood flow up the ascending aorta (in a anticlockwise direction as viewed from above). This helicity produces shear stress on the aortic wall in the direction of the torsional deformation. Whether the magnitude of shear stress developed at the solid–fluid interfaces is of sufficient magnitude to explain fully torsional deformation during ejection remains speculative. Torsion of the aortic base relative to the commissures suggests that the aortic root functions to dissipate shear strains created by LV contraction. Through this mechanism, the dynamic aortic root may minimize opening (or even closing) shear stresses on the insertion of the valve cusps along the commissures that might occur otherwise if the commissures underwent rotation in response to the torsion occurring at the base or annulus.
(i) Asymmetric deformations among different regions of the aortic root
Throughout the four phases of the cardiac cycle, the four modes of deformations discussed here were asymmetric among the left, right and non-coronary (NC) regions of the aortic root. In addition, the magnitude of deformation was in many instances predictable from physiological measurements of the heart. Using a GLM, we elucidated the physiological determinants of the aortic root's four modes of deformation during each phase of the cardiac cycle and in the three regions (Dagum et al. 1999). It was interesting that left annular sector deformation (subtending the NC–left commissure) correlated with LV contractile state, independent of other haemodynamic variables; furthermore, there was no interaction between contractility or haemodynamics and NC annular sector deformation. At the level of the commissures, however, dilation and expansion during the cardiac cycle were symmetric and uniform. Subsequently, during diastole, the aortic root underwent substantial deformation that was independent of changes in LV contractility or haemodynamics; the degree of diastolic deformation was best predicted by the extent of annular deformation preceding diastole, as the aortic root recoiled into its baseline configuration.
(j) Annular and commissural flexibility
Minimum commissural diameter did not occur at the end of systole with valve closure, but rather at the end of LVP decay when LVP was minimal (end-IVR and very early diastole) and diastolic TVG was maximal. In addition, the commissural diameter at the end of LVP decay fell with increasing TVG. This relationship suggests that the annular commissures participate in load sharing to reduce peak stresses on the aortic cusps during the rapid increase in TVG immediately after valve closure. Immediately after the end of LVP decay, the commissures underwent significant, rapid, early re-expansion, which was possibly due to the commissures recoiling from their deformed state during IVR caused by the rapid increase in transvalvular load after LVP decay. These observations suggest that maintenance of annular and commissural flexibility may be a key component, which allows the aortic root to dissipate cuspal stresses during valve closure.
(k) Summary
The intricate physiological changes within the aortic root and their contribution to aortic valve leaflet function seem to follow the postulate of Zimmerman (1969), which states that the heart is a structure–function continuum. The dynamic aortic root seems to be designed to improve transvalvular haemodynamics and to reduce cusp stresses by creating optimal cusp loading conditions and minimizing transvalvular turbulence; hence, cusp fatigue (and the likelihood of eventual structural valve deterioration occurring in aortic bioprosthetic valve substitutes) may be minimized by the physiologically dynamic aortic root throughout the complex opening and closing mechanics of the cusps 30–40 million times a year.
While our understanding of the aortic root remains incomplete, a synthesis based on structural and flow studies forms the foundation for a more rational physiological basis in medical treatment decisions, surgical techniques and design of bioprosthetic valve substitutes. While future clinical and experimental studies will no doubt identify new gaps in our understanding of aortic root structure and function, this will only represent additional opportunities for further basic physiological research.
Footnotes
One contribution of 21 to a Theme Issue ‘Bioengineering the heart’.
Supplementary Material
This computer simulation of the deformation of the annular fibroskeleton based on the marker data revealed that transformation from clover to cylindrical shape was explained by the geometric changes of the base relative to the commissures. The base underwent circumferential contraction, whereas the commissures continued to expand during ejection and at the point when both were of equal diameter, the aortic root achieved a cylindrical shape
References
- Brewer R.J, Deck J.D, Capati B, Nolan S.P. Dynamic aortic root—its role in aortic-valve function. J. Thorac. Cardiovasc. Surg. 1976;72:413–417. [PubMed] [Google Scholar]
- Calderon A.M, Catala J.J.J, Aguado P.L. Passive mechanical properties of the aorta during pregnancy in rats. Artery. 1985;13:165–186. [PubMed] [Google Scholar]
- Carmody C.J, Burriesci G, Howard I.C, Patterson E.A. An approach to the simulation of fluid–structure interaction in the aortic valve. J. Biomech. 2006;39:158–169. doi: 10.1016/j.jbiomech.2004.10.038. doi:10.1016/j.jbiomech.2004.10.038 [DOI] [PubMed] [Google Scholar]
- Chanthomas P.S, Thompson R.P, Robert B, Yacoub M.H, Barton P.J.R. Expression of homeobox genes msx-1 (hox-7) and msx-2 (hox-8) during cardiac development in the chick. Dev. Dyn. 1993;197:203–216. doi: 10.1002/aja.1001970305. [DOI] [PubMed] [Google Scholar]
- Dagum P, Green G.R, Nistal F.J, Daughters G.T, Timek T.A, Foppiano L.E, Bolger A.F, Ingels N.B, Jr, Miller D.C. Deformational dynamics of the aortic root: modes and physiologic determinants. Circulation. 1999;100:II54–II62. doi: 10.1161/01.cir.100.suppl_2.ii-54. [DOI] [PubMed] [Google Scholar]
- De Hart J, Peters G.W, Schreurs P.J, Baaijens F.P. A two-dimensional fluid–structure interaction model of the aortic valve. J. Biomech. 2000;33:1079–1088. doi: 10.1016/s0021-9290(00)00068-3. doi:10.1016/S0021-9290(00)00068-3 [DOI] [PubMed] [Google Scholar]
- De Hart J, Peters G.W, Schreurs P.J, Baaijen F.P. A three-dimensional computational analysis of fluid–structure interaction in the aortic valve. J. Biomech. 2003;36:669–712. doi: 10.1016/s0021-9290(02)00244-0. [DOI] [PubMed] [Google Scholar]
- Gnyaneshwar R, Kumar R.K, Balakrishnan K.R. Dynamic analysis of the aortic valve using a finite element model. Ann. Thorac. Surg. 2002;73:1122–1129. doi: 10.1016/s0003-4975(01)03588-3. doi:10.1016/S0003-4975(01)03588-3 [DOI] [PubMed] [Google Scholar]
- Grande K.J, Cochran R.P, Reinhall P.G, Kunzelman K.S. Stress variations in the human aortic root and valve: the role of anatomic asymmetry. Ann. Biomed. Eng. 1998;26:534–545. doi: 10.1114/1.122. doi:10.1114/1.122 [DOI] [PubMed] [Google Scholar]
- Grande K.J, Cochran R.P, Reinhall P.G, Kunzelman K.S. Mechanisms of aortic valve incompetence: finite element modeling of aortic root dilatation. Ann. Thorac. Surg. 2000;69:1851–1857. doi: 10.1016/s0003-4975(00)01307-2. doi:10.1016/S0003-4975(00)01307-2 [DOI] [PubMed] [Google Scholar]
- Hansen B, Menkis A.H, Vesely I. Longitudinal and radial distensibility of the porcine aortic root. Ann. Thorac. Surg. 1995;60:S384–S390. doi: 10.1016/0003-4975(95)00262-j. doi:10.1016/0003-4975(95)00262-J [DOI] [PubMed] [Google Scholar]
- Henderson Y, Johnson F.E. Two modes of closure of the heart valves. Heart. 1912;4:69–82. [Google Scholar]
- Hurlstone A.F.L, et al. The Wnt/beta-catenin pathway regulates cardiac valve formation. Nature. 2003;425:633–637. doi: 10.1038/nature02028. doi:10.1038/nature02028 [DOI] [PubMed] [Google Scholar]
- Kilner P.J, Yang G.Z, Mohiaddin R.H, Firmin D.N, Longmore D.B. Helical and retrograde secondary flow patterns in the aortic-arch studied by 3-directional magnetic-resonance velocity mapping. Circulation. 1993;88:2235–2247. doi: 10.1161/01.cir.88.5.2235. [DOI] [PubMed] [Google Scholar]
- Kilner P.J, Yang G.Z, Wilkes A.J, Mohiaddin R.H, Firmin D.N, Yacoub M.H. Asymmetric redirection of flow through the heart. Nature. 2000;404:759–761. doi: 10.1038/35008075. doi:10.1038/35008075 [DOI] [PubMed] [Google Scholar]
- Kvitting J.P.E, Ebbers T, Wigstrom L, Engvall J, Olin C.L, Bolger A.F. Flow patterns in the aortic root and the aorta studied with time-resolved, 3-dimensional, phase-contrast magnetic resonance imaging: implications for aortic valve-sparing surgery. J. Thorac. Cardiovasc. Surg. 2004;127:1602–1607. doi: 10.1016/j.jtcvs.2003.10.042. doi:10.1016/j.jtcvs.2003.10.042 [DOI] [PubMed] [Google Scholar]
- Lanne T, Stale H, Bengtsson H, Gustafsson D, Bergqvist D, Sonesson B, Lecerof H, Dahl P. Noninvasive measurement of diameter changes in the distal abdominal-aorta in man. Ultrasound Med. Biol. 1992;18:451–457. doi: 10.1016/0301-5629(92)90084-n. doi:10.1016/0301-5629(92)90084-N [DOI] [PubMed] [Google Scholar]
- Lansac E, Lim H.S, Shomura Y, Lim K.H, Rice N.T, Goetz W, Acar C, Duran C.M.G. A four-dimensional study of the aortic root dynamics. Eur. J. Cardiothorac. Surg. 2002;22:497–503. doi: 10.1016/s1010-7940(02)00405-0. doi:10.1016/S1010-7940(02)00405-0 [DOI] [PubMed] [Google Scholar]
- Lee C.S.F, Talbot L. A fluid mechanical study on the closure of heart valves. J. Fluid Mech. 1979;91:41–63. doi:10.1017/S0022112079000033 [Google Scholar]
- Lockie K.J, Butterfield M, Fisher J, Juster N.P, Watterson K, Davies G.A. Geometry of homograft valve leaflets—effect of dilation of the aorta and the aortic root. Ann. Thorac. Surg. 1993;56:125–130. doi: 10.1016/0003-4975(93)90415-e. [DOI] [PubMed] [Google Scholar]
- Markl M, Draney M.T, Hope M.D, Levin J.M, Chan F.P, Alley M.T, Pelc N.J, Herfkens R.J. Time-resolved 3-dimensional velocity mapping in the thoracic aorta—visualization of 3-directional blood flow patterns in healthy volunteers and patients. J. Comput. Assist. Tomogr. 2004;28:459–468. doi: 10.1097/00004728-200407000-00005. doi:10.1097/00004728-200407000-00005 [DOI] [PubMed] [Google Scholar]
- Mihaljevic T, Paul S, Cohn L.H, Wechsler A. Cardiac surgery in the adult. 2nd edn. McGraw-Hill; New York, NY: 2003. Pathophysiology of aortic valve disease. [Google Scholar]
- Misfeld M, Chester A.H, Sievers H.H, Yacoub M.H. Biological mechanisms influencing the function of the aortic root. J. Cardiac. Surg. 2002;17:363–368. doi: 10.1111/j.1540-8191.2001.tb01159.x. [DOI] [PubMed] [Google Scholar]
- Nadasy G.L, Monos E, Mohacsi E, Kovach A.G.B. The background of hysteretic properties of the human umbilical arterial-wall—smooth-muscle contraction and hysteresis of the pressure–radius curves. Acta Physiol. Hung. 1988;71:347–361. [PubMed] [Google Scholar]
- Nicosia M.A, Cochran R.P, Einstein D.R, Rutland C.J, Kunzelman K.S. A coupled fluid–structure finite element model of the aortic valve and root. J. Heart Valve Dis. 2003;12:781–789. [PubMed] [Google Scholar]
- Ranger A.M, Grusby M.J, Hodge M.R, Gravallese E.M, de la Brousse F.C, Hoey T, Mickanin C, Baldwin H.S, Glimcher L.H. The transcription factor NF-ATc is essential for cardiac valve formation. Nature. 1998;392:186–190. doi: 10.1038/32426. doi:10.1038/32426 [DOI] [PubMed] [Google Scholar]
- Robicsek F. Leonardo da Vinci and the sinuses of valsalva. Ann. Thorac. Surg. 1991;52:328–335. doi: 10.1016/0003-4975(91)91371-2. [DOI] [PubMed] [Google Scholar]
- Roy A, Brand N.J, Yacoub M.H. Molecular characterization of interstitial cells isolated from human heart valves. J. Heart Valve Dis. 2000;9:459–464. [PubMed] [Google Scholar]
- Sutton J.P, III, Ho S.Y, Anderson R.H. The forgotten interleaflet triangles: a review of the surgical anatomy of the aortic valve. Ann. Thorac. Surg. 1995;59:419–427. doi: 10.1016/0003-4975(94)00893-c. doi:10.1016/0003-4975(94)00893-C [DOI] [PubMed] [Google Scholar]
- Thubrikar M, Harry R, Nolan S.P. Normal aortic-valve function in dogs. Am. J. Cardiol. 1977;40:563–568. doi: 10.1016/0002-9149(77)90072-8. doi:10.1016/0002-9149(77)90072-8 [DOI] [PubMed] [Google Scholar]
- Thubrikar M, Bosher L.P, Nolan S.P. Mechanism of opening of the aortic valve. J. Thorac. Cardiovasc. Surg. 1979;77:863–870. [PubMed] [Google Scholar]
- Thubrikar M.J, Nolan S.P, Aouad J, Deck J.D. Stress-sharing between sinuses and leaflets of the aortic-valve. Surg. Forum. 1984;35:250–252. [Google Scholar]
- Vaishnav R.N, Young J.T, Patel D.J, Janicki J.S. Nonlinear anisotropic elastic properties of canine aorta. Biophys. J. 1972;12:1008–1027. doi: 10.1016/S0006-3495(72)86140-X. [DOI] [PMC free article] [PubMed] [Google Scholar]
- Vesely I. Aortic root dilation prior to valve opening explained by passive hemodynamics. J. Heart Valve Dis. 2000;9:16–20. [PubMed] [Google Scholar]
- Young J.T, Vaishnav R.N, Patel D.J. Nonlinear anisotropic viscoelastic properties of canine arterial segments. J. Biomech. 1977;10:549–559. doi: 10.1016/0021-9290(77)90035-5. doi:10.1016/0021-9290(77)90035-5 [DOI] [PubMed] [Google Scholar]
- Zimmerman J. Functional and surgical anatomy of aortic valve. Isr. J. Med. Sci. 1969;5:862–866. [PubMed] [Google Scholar]
- Zimmerman J, Bailey C.P. Surgical significance of fibrous skeleton of heart. J. Thorac. Cardiovasc. Surg. 1962;44:701–712. [Google Scholar]
Associated Data
This section collects any data citations, data availability statements, or supplementary materials included in this article.
Supplementary Materials
This computer simulation of the deformation of the annular fibroskeleton based on the marker data revealed that transformation from clover to cylindrical shape was explained by the geometric changes of the base relative to the commissures. The base underwent circumferential contraction, whereas the commissures continued to expand during ejection and at the point when both were of equal diameter, the aortic root achieved a cylindrical shape


