

Abstract
The increasingly widespread use of parametric mathematical models to describe biological systems means that the ability to infer model parameters is of great importance. In this study, we consider parameter inferability in nonlinear ordinary differential equation models that undergo a bifurcation, focusing on a simple but generic biochemical reaction model. We systematically investigate the shape of the likelihood function for the model's parameters, analyzing the changes that occur as the model undergoes a Hopf bifurcation. We demonstrate that there exists an intrinsic link between inference and the parameters' impact on the modeled system's dynamical stability, which we hope will motivate further research in this area.
INTRODUCTION
Mathematical models in the modern biomedical and life sciences have proved to be particularly useful (1), not only because they can help to increase understanding of the modeled biological system and allow predictions to be made, but also because their use forces model assumptions to be stated explicitly and fully (2). However, there are many challenges associated with mathematical modeling in biology (3). Perhaps the most fundamental of these are model specification (i.e., formulating an appropriate model based upon prior understanding and observations) and—in the case of parametric models—parameter estimation. It is with the latter that this study is concerned.
Once a parametric model has been proposed, it is necessary to infer or estimate its parameters based upon experimental data. Parameter estimation can often prove difficult, with missing data, observational noise, and incomplete model specification being among the numerous problems encountered in practice. However, rather than focusing on these practical issues (which are often highly and subtly investigation-specific), we are here concerned with how the underlying dynamics of the modeled system can affect our ability to perform inference. In particular, we address the apparent need (see, for example, (4)) for further investigation into parameter inferability in nonlinear ordinary differential equation models that undergo a bifurcation.
Informally, bifurcation refers to a phenomenon by which a small change in parameter values may cause a significant and global qualitative change in dynamical behavior. In this study, we shall be principally concerned with how parameter inferability changes in deterministic nonlinear systems that undergo a Hopf bifurcation, although the methods presented here could just as well be applied to investigations into other types of bifurcation. The Hopf bifurcation is of especial interest, however, as it is often cited as a cause of oscillatory behavior in biological systems, and recent research has demonstrated that Hopf bifurcations may occur in (to name but a few) metabolic networks regulated by product-feedback inhibition (5), the plant mitochondrial tricarboxylic acid cycle (6), and models for gene expression (7). The use of global dynamical features is perhaps most prominently illustrated by studies of the yeast cell-cycle (8), where a sequence of Hopf bifurcations (for timing of events) and saddle-point bifurcations (which provide switches taking the system from one stage to the next) appear to capture the underlying dynamics. Since models that exhibit Hopf bifurcations are being proposed and applied to biological systems, it is prudent to investigate the particular challenges that may be faced when inferring their parameters. In practice, we may frequently have to estimate such parameters from finite—often even very short—time series data (e.g., from quantitative Western blots). Fitting a model is preferable to simply measuring (for example) half-times from simple regression analyses, as these do not allow us to account for global features—such as bifurcations—of a biological system's dynamics.
THEORY
We consider a particular chemical reaction system with a Hopf bifurcation (9). This example was formulated as the mathematically simplest reaction system to undergo a Hopf bifurcation, and is well supported by existing mathematical analyses in the literature (9,10). The relative simplicity and tractability of this reaction system makes it particularly suitable for our investigation, while retaining generality and biochemical relevance.
The system involves four reactants (A0, X1, X2, and X3) and is described by the mechanism shown in Fig. 1. Note that A0 denotes outer reactants whose concentration, A, is assumed to be constant (see (9) for details).
FIGURE 1.

(Left) Representation of the mechanism of the reaction (adapted from (9)). (Right) The reaction described as a system of chemical equations. Each of the ki (i = 1, …, 5) values is a rate constant.
The system may be described by the ordinary differential equation (ODE) model
 |
(1) |
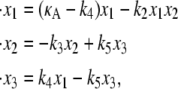
where each xi is a function of time, t, and represents the concentration of Xi at time t; κA = k1A is the product of the concentration of outer reactants, A, and the rate parameter k1; and each ki > 0 denotes a rate constant. For our purposes, the values κA, k2, k3, k4, and k5 are regarded as the parameters of the system. For convenience, we shall frequently employ the vector notation x(t) = [x1(t), x2(t), x3(t)], write the parameters as  and refer to our ODE system using the shorthand
  In the usual way, using vector notation also allows us to represent the progression of the system through time as a trajectory in three-dimensional space.
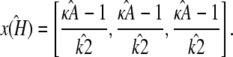
It can easily be shown (see (9)) that this system has two stationary points, located at
 |
(2) |
 |
(3) |
The first of these is stable provided 0 ≤ κA < k4, and the second is stable for k4 < κA < k3 + k4 + k5. We shall be solely concerned with x(H), which undergoes a supercritical Hopf bifurcation as κA passes through the value k3 + k4 + k5 (9,10). Fig. 2 (adapted from (11)) provides a simplified phase portrait representation of this three-dimensional supercritical Hopf bifurcation, illustrating the qualitative changes in the dynamics of the system as κA passes through the bifurcation point k3 + k4 + k5.
FIGURE 2.

Simplified phase portrait for the system showing the change in dynamics as κA passes through the bifurcation value of k3 + k4 + k5. (a) x(H) is a stable focus; (b) as the bifurcation value is approached, the rate at which the trajectory approaches x(H) decreases; (c) x(H) becomes unstable, but a stable limit cycle bifurcates from the stationary point. As κA > k3 + k4 + k5 increases, the radius of this limit cycle increases.
Maximum likelihood inference for ODEs
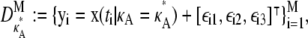
For our mathematical model in Eq. 1, we aim to infer the values of the parameters from a set of observed data. That is, given a set D = {y1, …, yM} of observations at times t1, …, tM, we wish to infer the true parameter vector θ*.
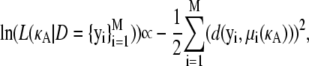
Here we consider maximum likelihood estimation of the parameters, which requires us to specify a likelihood function for our model. Given that the ODE is a deterministic and not a probabilistic description of the system, we cannot establish a direct likelihood approach; instead, we define the likelihood through the error between predicted and actual value (analogous to regression/least-squares procedures). Following the likelihood approach for ODE parameter estimation outlined in Williams and Kalogiratou (12) (which is itself a specific case of more general maximum likelihood analysis; see (13), for example), we assume for any observed data point yi that 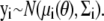 Here, μi(θ) is the solution to the system
  evaluated at time t = ti, and Σi is a covariance matrix. We shall further assume that Σi = Σ is the same for all i.
Assuming independence between observations (an assumption that is straightforwardly relaxed, but helps us to keep notation to a minimum), we therefore obtain the following form for the likelihood function, L(θ|D), which tells us how the probability of observing the data set D = {y1, y2, …, yM} changes with θ:
 |
(4) |
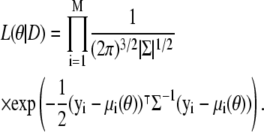
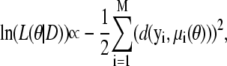
We are particularly interested in the maximum likelihood estimate for the parameter vector,  that maximizes the likelihood function, and shall investigate this via the log-likelihood, ln(L(θ|D)). In our case, we have
 |
(5) |
 |
(6) |
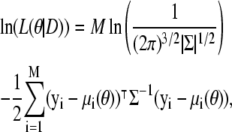
where 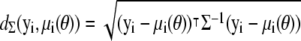 is the Mahalanobis distance (14) between yi and μi (with respect to Σ), and
 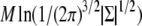 is a constant term independent of θ. As we are not interested in model selection or comparison, we can neglect this constant term in this context. Investigating the log-likelihood function, ln(L(θ|D)), for a given D is therefore equivalent to investigating how the sum of squared Mahalanobis distances between the observations yi and the exact solutions μi(θ) changes with θ.
In all the experiments that follow, we shall assume that Σ = I3, the 3 × 3 identity matrix. Under this assumption, the Mahalanobis distance is just the Euclidean distance, and so,
 |
(7) |
where d(yi,μi(θ)) denotes the Euclidean distance between yi and μi(θ). It is clear from the above that maximizing the likelihood is equivalent to minimizing the distance function d (often also called the cost function). We can therefore see that investigating the log-likelihood for different parameter values is directly related to the problem of determining how the distance between solutions that start from the same initial point changes with the parameters. Thus, our investigation could be viewed as an inversion of a traditional (and well studied; see (11), for example) problem in nonlinear dynamics: namely, the problem of determining the rate of separation of nearby solutions (given a fixed set of parameters).
METHODS
We initially make the simplifying assumption that the rates k2, k3, k4, and k5 in Eq. 1 are all known and equal to 1. By Eq. 3, this means that x(H) is located at [κA – 1, κA – 1, κA – 1]⊺ and will undergo a bifurcation as the value of κA passes through 3. We shall denote the true κA value by 
To obtain the data set D, we numerically simulate observations from the model. In such a simulation study, we are able to control  which enables us to investigate the change in inferability as its value passes through 3, the bifurcation point. It also means that we can either avoid or tightly control practical issues such as observational noise and missing data, so that we may focus specifically on the effect that the Hopf bifurcation has on parameter inferability.
To produce the simulated data, we specify a set of initial conditions and a value for  and then use a numerical ODE solver to evaluate the solution xi = [x1(ti), x2(ti), x3(ti)] to the system of differential equations in Eq. 1 at times t1, …, tM. Unless otherwise stated, our initial conditions are always taken to be [x1(0), x2(0), x3(0)]⊺ = [1, 1, 1]⊺, and we take t1 = 1, …, tM = M. This yields the trial data,
 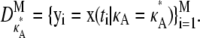 To imitate the imperfect nature of real experimentation, we also generate noisy data yi = [x1(ti) + ɛi1, x2(ti) + ɛi2, x3(ti) + ɛi3], with each ɛij being drawn from a zero-centered Gaussian distribution.
The numerical ODE solver that we use throughout this section is the Dormand-Prince {4, 5} method (a member of the Runge-Kutta family of ODE solvers; see (15) for details of the Runge-Kutta method and (16) for the implementation).
RESULTS
To highlight the generic impact of a Hopf bifurcation on parameter inference from time-course data, we consider a concrete example in detail and under initially idealized conditions of very long time-series. In Appendix A, we show that these results persist for much shorter, realistic time series.
Dynamics and inferability
To understand the effect of the bifurcation on likelihood estimation, we evaluate and then plot the log-likelihood, 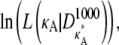 against κA, for a range of values of
  Although the number M = 1000 would be an unrealistic number of observations in practice, additional experiments demonstrate that qualitatively similar results are also obtained for the more realistic value M = 10 (see Appendix A).
Fig. 3 shows six log-likelihood plots for a range of values of  As expected, the maximum likelihood (ML) parameter value is always the true value. However, the appearance of the plots obtained when
  ≤ 3 are noticeably different to those obtained when
  > 3.
> 3.
FIGURE 3.

Log-likelihood plots for different values of  (as specified by the headings,
  ). In each case, the black cross indicates the maximum value (as expected, in every case this occurs when κA is the true value). The y axis of each plot shows the value of the log-likelihood, while the x axis shows the value of κA.
For 1 <  ≤ 3, each of the log-likelihood curves consists of:
A relatively flat part in the region 1 < κA < 3.
A relatively steep part with negative gradient in the region κA > 3.
A distinct elbow in the curve at κA = 3, which marks the boundary between the other two regions of distinct behavior.
The overall shape of the curve means that, when 1 <  ≤ 3, all parameter estimates >3 become rapidly (and increasingly) unlikely. On the other hand, parameter estimates in the interval (1, 3] are all relatively likely, with a maximum occurring at κA =
  This is very satisfying to our intuition, as it means that parameter estimates that yield solutions whose dynamical behavior is qualitatively the same as the true solution are generally more likely than those for which the qualitative dynamical behavior is different. Furthermore, the bifurcation value κA = 3, which marks the critical point of change between the two different types of dynamical behavior, also marks the critical point of changing behavior in the log-likelihood curve.
For  > 3, although we still obtain a maximum at κA =
  this occurs as a spike in the curve. Apart from this, the log-likelihood curves obtained for
  > 3 are all qualitatively similar to the curve obtained for
  = 3, in that there is a local maximum at κA = 3 and the gradient of the curve to the right of this local maximum is steeper than to the left. We also note that as
  > 3 increases, the log-likelihood of values of κA other than κA =
  decreases, so that the amplitude of the spike appears greater (relative to the level of the rest of the curve). While we would certainly expect to see a maximum at κA =
  intuition would suggest that values of κA close to
  should also be likely—and certainly more likely than values of κA between 1 and 3 (where the solution is qualitatively different).
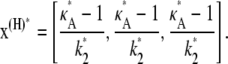
To understand the observed behavior, we have to think a little more deeply about the nature of the stationary point x(H)* = [ – 1,
– 1,  – 1,
– 1,  – 1]. The plots in Fig. 4 show a section of the numerical solution to the system
  obtained for different values of κA, and are helpful when considering the effect of the nonlinear dynamics on the likelihood.
FIGURE 4.

The plots here provide a graphical representation of sections of the solutions for different values of κA. The solutions were evaluated at the times t = 1, …, 1000, and are shown with straight lines joining adjacent time points. Note how the scales on the axes grow larger as κA > 3 increases.
Let us first consider the case when 1 <  < 3. Here, x(H)* is asymptotically stable, which means that all trajectories that start near to the stationary point will be drawn toward it (see Fig. 2 a). In general, for any
  ∈ (1,3), the solution obtained using a parameter estimate
  will be qualitatively similar to the true solution. Crucially, this means that the true solution and estimated solution both start at the same point and end at nearby points, and hence the distance between corresponding points in
  and
and  will be relatively small. Thus, given the relationship between distance and likelihood (see Eq. 7), we expect all estimates
  to be relatively likely.
However, when the estimate  we observe a qualitative change in the behavior of the corresponding estimated solution (see Fig. 2 c). The (estimated) stationary point at
 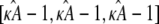 is no longer stable, and the estimated solution is instead attracted toward a stable limit cycle. Two solutions obtained for two different values of κA > 3 will only be close to one another when the two κA values are themselves very close together. Trajectories are no longer drawn-inward toward a central point, but are instead forced-outward toward the limit cycle. The effect of this is that, for solutions obtained for any two different values of κA > 3, the distances between corresponding data points sampled from these solutions can become very large very quickly. This is why we observe a spike in the log-likelihood curve: only values of κA very, very close to the true value will result in data points that are close to the observed data.
An approximate likelihood
If  and i is sufficiently large, we may make the approximation y(ti) ≈ [
 – 1,
– 1,  – 1,
– 1,  – 1]; i.e., y(ti) is close to the stationary point. Suppose we also consider observations yδ (ti) from the set
  where δ ∈ R is such that δ ≠ 0 and δ ∈ (1 –
  3 –
3 –  ) (this simply says that
  + δ is a number from (1, 3) that is not equal to
  ). Then, for i sufficiently large, we have yδ (ti) ≈ [
 + δ – 1,
  + δ – 1,
  + δ – 1]. Therefore, the squared Euclidean distance between corresponding points y(ti) and yδ(ti) is eventually close to 3δ2.
Numerical simulation suggests that the squared Euclidean distance between corresponding points in  and
and  is ∼3δ2 for the majority of points, so we make the further approximation that this is true for all points (provided
  + δ,
+ δ,  ∈ (1, 3)). By Eq. 7, this suggests that if
  ∈ (1, 3), then the log-likelihood function may be approximated by
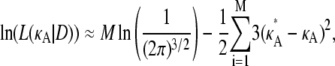 |
(8) |
 |
(9) |
in the region 1 < κA < 3.
The accuracy of this approximation is likely to depend on many factors. For example, we would expect the approximation to be poorer if fewer observations were taken, or if the initial starting point were further away from x(H)*. However, we can see from Fig. 5 that for our idealized case, the approximation provides a good fit to the likelihood function.
FIGURE 5.

Log-likelihood for 1 < κA < 3 (the true parameter was set to  = 2.5), together with the approximation given in Eq. 9. The inset shows that the squared Euclidean distance between corresponding points from
  and
and  approaches 3δ2 = 3(0.3)2, as predicted.
Fisher information
To further quantify the sensitivity of the system to changes in κA, we now consider the Fisher information, I(κA) (17). This tells us the amount of information that the observable variable x = [x1, x2, x3]⊺ carries about the value of κA. The method used to approximate the Fisher information is given in Appendix B.
Fig. 6 shows that the Fisher information is relatively low for parameter values between 2 and 3, and then rapidly increases once κA has passed through the bifurcation point. This reiterates the previous findings and nicely illustrates the difference in parameter inferability either side of the bifurcation point.
FIGURE 6.

Plot showing I(κA) for a range of values of κA. Inset is a plot showing ln(I(κA)) for the same range of κA values.
Noisy data
Until now, we have been solely concerned with simulating “perfect” data that are absent of noise. To demonstrate that our findings are also valid in practice, we now try to imitate more realistic experimental conditions by introducing a Gaussian noise term. Our data sets are now of the form
 |
(10) |
where each  To obtain the results shown in Fig. 7, we took σ = 10. This was deliberately chosen to provide a very large noise term, so that we could test the robustness to noise of our previous findings.
FIGURE 7.

Log-likelihood plots obtained using noisy data sets (see Fig. 3). The maximum log-likelihood values (indicated by the black cross) in each case are as follows: 2.13, 2.93, 2.99, 3.2, 3.5, and 3.8.
Overall, these plots appear qualitatively similar to the ones obtained in the absence of noise (Fig. 3); in particular, the spike for  > 3 persists. Of course, the log-likelihood for any given κA value is lower here, reflecting our reduced confidence in the value of any particular parameter value (for example, even when κA =
  the total distance between the observed and expected data is nonzero, and so the log-likelihood is lower).
Maximum likelihood estimation of other parameters
So far, we have assumed that only the value of κA was unknown, and that the values of the other parameters were all known and equal to 1. We shall now return to using noiseless data, but shall consider a case in which both κA and k2 are unknown.
Suppose that the true values of κA and k2 are  and
and  Then we denote the Hopf-bifurcating stationary point of the system
  by x(H)*, and refer to this as the true stationary point. Since k3 = k4 = k5 = 1 are known, we know by Eq. 3 that
 |
Similarly, if  and
and  are estimated values of κA and k2, then we denote the Hopf-bifurcating stationary point of the system
  by
by  and refer to this as the estimated stationary point. Clearly, we have
 |
Assuming both κA and k2 to be unknown turns out to be particularly interesting for two main reasons:
We know that the stationary point x(H) of the system g(x|κA, k2) is stable provided κA is in the open interval (k4, k3 + k4 + k5). Thus, since we are keeping the other three parameters (k3, k4, k5) fixed, the stability of x(H) is determined solely by the value of κA and not by k2.
Given any estimate
 of κA, there is always a value
  such that if
  the location of the estimated stationary point will coincide with the location of the true stationary point (regardless of how poor the estimates
  and
and  may be).
We start by setting  = 2.5 and
  = 1, and calculate the log-likelihood on a grid of values for κA and k2 (using exactly the same method as previously, taking the initial point to be [1, 1, 1] and the number of data points, M, to be 1000). We consider 2 ≤ κA ≤ 3.9 and 0.2 ≤ k2 ≤ 4, with a spacing of 0.02 between grid points in both directions. This defines a log-likelihood surface, as shown in Fig. 8. The absolute maximum is marked on the surface with a white dot, and occurs when (κA, k2) = (
 ) (as we would expect).
FIGURE 8.

Plot of the log-likelihood surface on a grid of κA, k2 values. The absolute maximum value has been highlighted as a circled white dot.
To provide more insight, Fig. 9 shows for each value of κA the value of k2, which yields the maximum log-likelihood. We can see from Fig. 9 that there are two approximately linear regions. Shown in red is the line 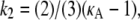 and we can see that it provides a good fit to the curve in approximately the region 2 ≤ κA ≲ 3. This line corresponds to
  being the estimate which ensures that
  This means that even if we estimate κA incorrectly, then—provided
  —the maximum likelihood estimate of k2 is the one that places the estimated stationary point at the true location (or within a ellipsoid with radii determined by the level of noise in the system). Intuitively, this makes a great deal of sense: provided
  is in the range 1 ≤ κA ≤ 3,
  is asymptotically stable and so represents the “destination” of the solution to the system
  as t → ∞. Thus, if
  correctly places the estimated stationary point, then this means that the estimated solution both starts and ends at the same places as the observed solution.
FIGURE 9.

Plot showing for each value of κA the value of k2 that yields the maximum log-likelihood (blue dots). Shown in green is the line k2 = κA – 1, and in red is the line 
Shown in green is the line k2 = κA – 1, which provides a good fit to the curve in the region 3.08 ≤ κA ≤ 3.9. This line corresponds to  being the estimate that locates
  at [1, 1, 1], i.e., so that the estimated stationary point coincides with the initial starting point of the trajectory. This means that the whole trajectory will just appear at the single point [1, 1, 1]. We can think of this as follows: if κA is estimated in such a way that
  would be unstable, then the maximum likelihood value estimate
  attempts to correct this behavior. Since the value of k2 cannot alter the stability of
  the best that can be done is to estimate
  so that the entire solution shrinks down onto a single point. We can also see that there is in fact a small interval of κA values (namely (3, 3.08)) in which the unstable solution is favored. Within this interval, the radius of the limit cycle is relatively small, and hence the maximum likelihood solution can be unstable and still be relatively close to the observed solution.
The results from this section appear to demonstrate that—when we perform inference in order to estimate the parameters of an ODE system—not only are we attempting to find the parameter values that best explain the particular observed trajectory, but that also accurately describe the underlying dynamics of the system. In particular, our results suggest that if the true stationary point x(H)* is stable, then parameter estimates for which  is stable and correctly located will be preferred over those for which it is not.
We also investigated situations in which κA and k4 were unknown (and the remaining parameters were assumed to be known), and obtained similar results. However, in contrast to the above, both of these two unknown parameters affect the location of the stationary point, which makes the results more difficult to interpret.
DISCUSSION
We have considered the smallest chemical reaction system with a Hopf bifurcation (9), and have investigated how parameter inferability changes in this model. We found that the presence of a Hopf bifurcation in the system has a clear effect on the shape of both the log-likelihood function and the Fisher information considered as a function of the parameters. An analysis of the log-likelihood function for different values of  revealed that the function's qualitative behavior changes depending on whether
  is above or below the critical bifurcation value (see Fig. 3), which we expect to have an effect upon inferability. For
  > 3, highly likely estimates for the parameter only occur within a very small interval that contains the true value. Thus, although it might be difficult to find a particularly likely parameter estimate, once we have one, we can be sure that it will be close to
  For 1 <
  ≤ 3, any parameter estimate that lies within the interval (1, 3] is relatively likely. So, in this case we have the opposite situation: although it may be easy to find plausible parameter estimates, determining which one is correct is likely to be more difficult.
There is—mirroring the rich literature on dynamical systems, in general, and on bifurcation analysis, in particular—a rich set of phenomena related to estimating parameters of dynamical systems. Parameter estimation generally considers only local dynamics, i.e., its specific aim tends to be to home in on those model parameters most likely to have generated the observed data points as efficiently as possible. Global dynamical effects, such as bifurcations, are hardly ever considered although their importance for understanding biological systems has been amply demonstrated (7,8). Here we have discussed how global dynamics interact with our ability to draw statistical parameter inferences from time-series data. There are a number of obvious ways in which this research can be extended. A relatively simple but important next step would be to consider the effects of having fewer experimental/simulated observations. Preliminary investigation (see Appendix A) suggests that the results presented here remain valid, yet the picture quickly becomes more complicated as data quality and quantity decrease. There is a clear need for a thorough treatment of this issue, as experimental data are often sparse. Another simple extension would be to study the effects of varying or inferring initial conditions. Once these issues have been addressed, the methods used here could be applied to other systems to determine the effects on inferability of other types of bifurcation.
APPENDIX A: INFERENCE FROM SHORT TIME-SERIES RESULTS
Throughout, we have considered data sets that consist of 1000 data points. However, with real experimental data, we would typically expect far fewer observations. In Fig. 10, we show log-likelihood plots obtained using a data set consisting of only 10 observations taken at times t = 10, 20, …, 100.
FIGURE 10.

Log-likelihood plots obtained using a data set consisting of 10 points, with observations taken at times t = 10, 20, …, 100.
Although now perhaps less clear, the results are still qualitatively similar to those obtained previously. A notable difference is that the maximum value for  > 3 no longer occurs as a true spike in the curve. Instead, values of κA near to
  are also likely, so that the maximum occurs as the peak of a much more gentle hump in the curve. One effect of this is that it is much more difficult to determine the precise bifurcation value of κA just from looking at these plots. Another is that for
  > 3 we would expect to find it more difficult to pinpoint the precise value of
  than in our previous cases. However, overall, we can see that the shape of the likelihood curve is roughly similar to previously, with different behavior either side of κA ≈ 3.
APPENDIX B: APPROXIMATING THE FISHER INFORMATION
The Fisher information is defined as
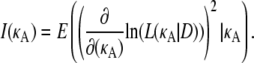 |
(11) |
Here, the expectation is with respect to the probability density function f(D|κA), so we may write the expression above as
 |
(12) |
Hence, for each κA, I(κA) is the square of the derivative with respect to κA of the likelihood function for κA, averaged over all observable data sets D. Using standard techniques (Monte Carlo integration (see, for example, (18)), we can clearly approximate the Fisher information by
 |
(13) |
where N is a large number and each D(j) is an independent draw from f(D|κA).Furthermore, from Verdugo and Rand (7), we have
 |
where μi(κA) is the exact solution evaluated at time t = ti.Thus, we have
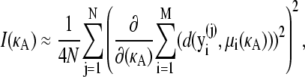 |
(14) |
where  is an independent draw from f(D|κA).
Since we cannot write μi(κA) analytically, we must make the following further approximation,
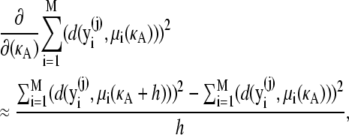 |
(15) |
where 
Thus, we have
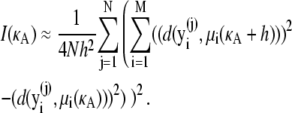 |
(16) |
Using the above, it is possible for us to approximate I(κA) numerically for any value of κA. Results are shown in Fig. 6.
Editor: Steven D. Schwartz.
References
- 1.May, R. M. 2004. Uses and abuses of mathematics in biology. Science. 303:790–793. [DOI] [PubMed] [Google Scholar]
- 2.Haefner, J. 2005. Modeling Biological Systems: Principles and Applications. 2nd Ed. Springer, New York.
- 3.Reed, M. C. 2004. Why is mathematical biology so hard? Notices AMS. 51:338–342. [Google Scholar]
- 4.Ramsay, J. O., G. Hooker, D. Campbell, and J. Cao. 2007. Parameter estimation for differential equations: a generalized smoothing approach. J. Roy. Stat. Soc. B. 69:1–30. [Google Scholar]
- 5.Goyal, S., and N. S. Wingreen. 2007. Growth-induced instability in metabolic networks. Phys. Rev. Lett. 98:1–4. [DOI] [PMC free article] [PubMed] [Google Scholar]
- 6.Steuer, R., A. N. Nesi, A. R. Fernie, T. Gross, B. Blasius, and J. Selbig. 2007. From structure to dynamics of metabolic pathways: application to the plant mitochondrial TCA cycle. Bioinformatics. 23:1378–1385. [DOI] [PubMed] [Google Scholar]
- 7.Verdugo, A., and R. Rand. 2008. Hopf bifurcation in a DDE model of gene expression. Commun. Nonlinear Sci. Numer. Simul. 13:235–242. [Google Scholar]
- 8.Battogtokh, D., and J. J. Tyson. 2004. Bifurcation analysis of a model of the budding yeast cell cycle. Chaos. 14:653–661. [DOI] [PubMed] [Google Scholar]
- 9.Wilhelm, T., and R. Heinrich. 1995. Smallest chemical reaction system with Hopf bifurcation. J. Math. Chem. 17:1–14. [Google Scholar]
- 10.Wilhelm, T., and R. Heinrich. 1996. Mathematical analysis of the smallest chemical reaction system with Hopf bifurcation. J. Math. Chem. 19:111–130. [Google Scholar]
- 11.Kuznetsov, Y. 2004. Elements of Applied Bifurcation Theory. Springer, New York.
- 12.Williams, J., and Z. Kalogiratou. 1993. Least squares and Chebyshev fitting for parameter estimation in ODEs. Adv. Comput. Math. 1:357–366. [Google Scholar]
- 13.Bard, Y. 1974. Nonlinear Parameter Estimation. Academic Press, New York.
- 14.Mahalanobis, P. C. 1936. On the generalized distance in statistics. Proc. Nat. Inst. Sci. India. 2:49–55. [Google Scholar]
- 15.Press, W., S. Teukolsky, W. Vetterling, and B. Flannery. 1992. Numerical Recipes in C: The Art of Scientific Computing, 2nd Ed. Cambridge University Press, Cambridge, UK.
- 16.MathWorks. 2004. MATLAB 7. The MathWorks, Natick, Massachusetts.
- 17.Cover, T., and J. Thomas. 1991. Elements of Information Theory. Wiley-Interscience, New York.
- 18.MacKay, D. J. C. 2003. Information Theory, Inference, and Learning Algorithms, 1st Ed. Cambridge University Press, Cambridge, UK.