

Abstract
We present direct quasielastic neutron scattering measurements, in vivo, of macromolecular dynamics in Escherichia coli. The experiments were performed on a wide range of timescales to cover the large panel of internal and self-diffusion motions. Three major internal processes were extracted at physiological temperature: a fast picosecond process that corresponded to restricted jump diffusion motions and two slower processes that resulted from reorientational motions occurring in ∼40 ps and 90 ps, respectively. The analysis of the fast process revealed that the cellular environment leads to an appreciable increase in internal molecular flexibility and diffusive motion rates compared with those evaluated in fully hydrated powders. The result showed that the amount of cell water plays a decisive role in internal molecular dynamics. Macromolecular interactions and confinement, however, attenuate slightly the lubricating effect of water, as revealed by the decrease of the in vivo parameters compared with those measured in solution. The study demonstrated that standard sample preparations do not mimic accurately the physiological environment and suggested that intracellular complexity participates in functional dynamics necessary for biological activity. Furthermore, the method allowed the extraction of the self-diffusion of E. coli macromolecules, which presented similar parameters as those extracted for hemoglobin in red blood cells.
INTRODUCTION
The study of internal molecular motions on the pico- to nanosecond (ps-ns) timescale reveals fundamental dynamical processes required for biological activity and stability. Ps-ns local motions in macromolecules act as the lubricant of larger conformational changes on a slower, millisecond, timescale (1) that are necessary for important biological processes, including ligand binding, intermolecular recognition, enzyme catalysis, and signal transduction (2–5). Incoherent neutron scattering spectroscopy is a powerful technique for the measurement of atomic motions on the ps-ns time domain. The scattering signal is dominated by hydrogen nuclei, which have a neutron incoherent cross section ∼40 times larger than the cross section of any other nucleus or isotope. Hydrogen atoms represent up to about half of the atoms in biological macromolecules and are distributed nearly homogeneously within the structures. Their incoherent scattering signal, therefore, reflects internal molecular motions. Neutron studies have revealed that local molecular motions are influenced by environmental conditions, including hydration level and temperature. The temperature dependence of the global atomic mean-square displacement, which corresponds to internal flexibility, has been studied extensively over recent decades (reviewed by Gabel et al. (6)). At sufficient hydration, it has been found that, below a dynamical transition temperature at ∼180–240 K, atomic motions are harmonic predominantly. The atoms are anchored within the structure, stacked in a given energy state, and they vibrate about their equilibrium position. Above the dynamical transition temperature, the mean-square displacement increases significantly because of the contribution of diffusive motions, which may contribute to the sampling of different conformational substates (7). At physiological conditions, the energy barrier separating different free energy states is similar to the thermal energy, and the molecular subgroups can overcome rotational barriers. Many but not all macromolecules become fully active and functional only when these diffusive motions can take place. The study of localized diffusive motions, therefore, is of fundamental relevance to an understanding of the origin of functional internal flexibility in macromolecules.
Quasielastic incoherent neutron scattering (QENS) provides accurate information on local diffusive motions occurring in macromolecules (8). The technique has been used extensively to study internal molecular motions in hydrated protein powders (9–16) as well as in the integral membrane protein bacteriorhodopsin in purple membrane stacks (17–21). These studies have indicated that internal flexibility decreased when the hydration level was lowered. Pérez et al. (16) have compared internal dynamics in dry powder, at several hydration levels, and in solution for myoglobin and lysozyme. They have shown that the surface side chains of the two types of proteins acquired progressively the ability to diffuse locally as the hydration level increased progressively up to complete coverage. Furthermore, both motion amplitudes and internal diffusive motion rates increased significantly in solution compared with fully hydrated powder. The differences in internal dynamics observed between powder and solution samples led to another challenging question: what about the internal dynamics in the cell interior? Cell macromolecules move and interact in a crowded intracellular matrix. It has been shown that macromolecular self-diffusion coefficients are reduced in the cell cytoplasm (22–25), although macromolecular associations can be favored (26). Very little is known concerning in vivo internal macromolecular dynamics. In particular, to what extent can internal dynamics be enhanced or reduced under cellular conditions of hydration and crowding, compared with that measured in hydrated powder or in solution? In this study, we addressed this question using QENS, and we present direct measurements of global and internal molecular motions in living Escherichia coli at physiological temperature.
MATERIALS AND METHODS
Sample preparation
Native E. coli (BLE21 (DE3) strain) were cultivated at 37°C to an optical density value of 2 in Enfors minimum growth medium with glycerol (Cambridge Isotopes, Cambridge, MA) as the carbon source. Cells were pelleted by centrifugation at 5000 × g in a Beckman (Fullerton, CA) centrifuge (JLA 10500 rotor) for 20 min at 4°C. The supernatant was discarded, and the cells were washed twice with 100 ml of D2O buffer solution (150 mM NaCl, 5 mM KCl, 10 mM Tris-DCl, pH 6.6). The cells were pelleted via 20 min centrifugation and transferred to aluminum sample holders (4 × 3 × 0.03 cm3). After the experiments, a small amount of the pellet was resuspended in the buffer and layered on Petri dishes after several dilution steps. The number of colonies was compared with that obtained for cells from the fresh culture and found to be similar, which indicated that most of the cells remained intact and viable after the total beamtime exposure.
Neutron scattering measurements
The experiments were carried out at room temperature using three spectrometers: the time-of-flight spectrometer IN6 (Institut Laue Langevin (ILL), Grenoble, France; see www.ill.eu for further information), with an energy resolution of 90 μeV (full width at half-maximum, FWHM); the inverted time-of-flight spectrometer IRIS (Rutherford Appleton Laboratory, Chilton, UK; see www.isis.rl.ac.uk), with an energy resolution of 17 μeV (FWHM); and the backscattering spectrometer IN16 (ILL, Grenoble; FWHM = 0.9 μeV). The scattering was measured over a wave-vector of 0.5 Å−1 < Q < 1.7 Å−1 (Q is the wave vector transfer modulus). A vanadium sample (a purely elastic scatterer) was measured to define the instrument resolution and correct for detector efficiency. IRIS, IN6, and IN16 spectra were corrected for detector efficiency, sample container, and buffer scattering, normalized, grouped, and converted to S(Q,ω) data using the MODES and LAMP data-reduction routines (27,28), respectively. The transmissions of the samples were >90%, and multiple scattering was neglected.
Incoherent neutron scattering from living cells
An exhaustive description of QENS can be found in Bée (29). Hydrogen nuclei have an incoherent cross section 40 times larger than that of any other atom and isotope, and they dominate the scattering signal. Because the signal relies on incoherent scattering, the dynamics of hydrogenated molecules can be explored in samples that need not be crystalline or even monodisperse, such as living cells (30). Macromolecules make up ∼96% of the total dry weight of E. coli, of which 55% are proteins, 20% are RNA, and 9% are lipids (see Table 1) (31). Internal motions of E. coli macromolecules were studied by measuring native (natural abundance of H) E. coli resuspended in D2O buffer. A subtraction of the D2O buffer spectra from the spectra measured for the cells gives a valuable approximation of the scattering signal from cell macromolecules. Because proteins are the dominant cellular macromolecules by mass, and the hydrogen percentage is higher in proteins compared with every other type of macromolecule (∼50% for proteins compared with 30% for RNA and lipids), it is reasonable to assume that protein motions dominate the macromolecular scattering signal from living cells.
TABLE 1.
Chemical composition of E. coli (from Madigan et al. (31))
| Molecules | Percentage of dry weight |
|---|---|
| Total macromolecules | 96 |
| Protein | 55 |
| Polysaccharide | 5 |
| Lipid | 9.1 |
| Lipopolysaccharide | 3.4 |
| DNA | 3.1 |
| RNA | 20.5 |
| Total monomers | 3 |
| Amino acids and precursors | 0.5 |
| Sugars and precursors | 2 |
| Nucleotides and precursors | 0.5 |
| Inorganic ions | 1 |
| Total | 100 |
Separation of the diffusive motions using QENS
The diffusive motions of hydrogen atoms in macromolecules explored here belong to the ps-ns time domain and can be detected using the combination of different neutron spectrometers. The energy resolution of the spectrometer defines the upper limit of the accessible times of motions. The IN6 spectrometer, which has a FWHM = 90 μeV, is suitable for the measurement of motions with short characteristic times, τ < 15 ps. The higher resolution of the IRIS spectrometer, FWHM = 17 μeV, resolves slower motions, with τ < 75 ps. Very slow motions that occur up to ∼1 ns can be detected with the very high energy resolution of IN16 (FWHM = 0.9 μeV). On each spectrometer, the average dynamical behavior of all protons diffusing in the time window is measured. The protons, which move very slowly with respect to the timescale associated with the spectrometer, are seen as immobile and contribute to the elastic intensity. On the reverse, very fast protons with respect to the energy resolution contribute in a flat background.
Data analysis
In the quasielastic region of the measured spectra, the calculated scattering function, Scalc(Q,ω), has been described by Bée (29):
 |
(1) |
where DW is a Debye-Waller (DW) factor, which accounts for vibrational modes, and Sdiff(Q,ω) is a diffusive contribution. The DW factor is simply a scaling factor in ω-space that does not modify the shape of the quasielastic scattering function. In the case of global and internal macromolecular motions in the cell interior, Scalc(Q,ω) can be written as follows (29):
 |
(2) |
The quasielastic component arises from the convolution of the self-diffusion scattering function,  with the internal (localized) scattering function,
 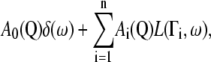 which are supposed to be uncoupled from each other as has been done in previous work on myoglobin in crowded solutions (32). The global and internal scattering functions are both described by Lorentzian functions:
 |
(3) |
with Γi the half width at half-maximum (HWHM) of the Lorentzian peak.
The measured scattering function, Smeas(Q,ω), is obtained by convoluting Scalc(Q,ω) with the energy resolution of the spectrometer, Sres(Q,ω), determined by the vanadium sample:
 |
(4) |
in which  is a detailed balance factor and B0 an inelastic background caused by vibrational modes of lowest energy, also called phonons in crystals (29).
For IRIS spectra, the fits were performed over the energy transfer range −0.2 to +0.5 meV, using the IRIS Bayesian fitting program QL function present in the MODES package (27). The IN16 and IN6 spectra were fitted over the energy transfer ranges −12 μeV to +12 μeV and −1.5 meV to +1.5 meV, respectively, using the QENS_FIT routine present in the LAMP package (28).
RESULTS AND DISCUSSION
Internal motions in living cells by QENS
In biological macromolecules, many different molecular substructure groups experience localized diffusive motions, which occur, in a large part, with correlation times from 0.1 to 200 ps (18). As described in Materials and Methods, the diffusive motions are related to the Lorentzian functions used to fit QENS data (see “Data analysis”). The motions are characterized by the Lorentzian HWHM, Γi, which are related at high Q2 values to the inverse of correlation times, τcor,i, and by quasielastic incoherent structure factors, Ai with i > 0. A Q2-independent linewidth can account for reorientational motions such as jump diffusion motions among a finite number of sites. In contrast, a nonzero extrapolated value of Γi at Q2 = 0, followed by an increase of the linewidth with Q2, reflects diffusive motions within a confined volume. The elastic incoherent structure factor (EISF), which corresponds to the elastic intensity fraction over the total intensity, makes it possible to access the motion geometry as well as the number of mobile and immobile protons in the experimental energy resolution. The Q dependences of Γi and the EISF, therefore, provide information on the nature of the motions.
With the aim of capturing the essence of the complex landscape of internal motions in cell macromolecules, we used a finite number of Lorentzians to parameterize the major types of motions depending on their timescale. The interest was to describe the diffusive motions in a simplified and meaningful way, using only a few phenomenological variables. Each Lorentzian must be understood as an average contribution of the motions that occur in a certain time- and length scales. In the following section, we describe the motions belonging to the ps-to-ns timescale, using the three instrumental energy resolutions presented previously. The characteristic length and time parameters of the motions were extracted from the Lorentzian HWHM and EISF as functions of Q, using both a phenomenological approach and accurate models. The aim of the approach was to determine whether or not internal macromolecular dynamics measured in entire cells was similar to that found in hydrated powder, in membrane, or in solution and to address to what extent the cellular environment influences the diffusive motions in macromolecules.
Fast internal motions
The internal motions captured on IN6 possess characteristic times of a few picoseconds. On this timescale, the global motions contribute to the scattering function as a very sharp Lorentzian that is much narrower than the instrumental energy resolution. Equation 2 simplifies, therefore, as follows:
 |
(5) |
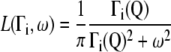
The data were fitted with a single Lorentzian function using Eqs. 4 and 5. The QENS spectra and applied fits are plotted in Fig. 1. Considering the large number of molecular subunits that gives rise to a large variety of motions, the single-Lorentzian analysis is a rough approximation; it gives, however, a good indication of the average motion type. The Q2-dependence of the Lorentzian HWHM, Γfast, is plotted in Fig. 2. Γfast revealed the existence of diffusive motions within confined space, as indicated by the nonzero intercept, Γf0, in the low Q2 region. Γf0 is ∼100 μeV at 280 K and 300 K. The low Q2 profile was well accounted for by the model of Volino and Dianoux, which describes diffusion inside the volume of a sphere (33). The model gave access to the confinement sphere radius. Γf0 follows (33):
 |
(6) |
where Dlocal is the diffusion coefficient inside a spherical volume of radius a. a was extracted from the EISF variation with Q. The model predicts that the experimental EISF follows
 |
(7) |
with p the fraction of immobile protons, with respect to the instrumental time window. The Q dependence of the EISF is plotted in Fig. 3. We found p = 0.61 and a = 3.11 Å at 280 K; p = 0.56 and a = 3.40 Å at 300 K. As revealed by the EISF profile at high Q values, the values of immobile protons, p, have large uncertainties. The fit is improved by using a distribution of radii of sphere. The approach with a single sphere radius was chosen to compare with previous work analyzed in the same way.
FIGURE 1.

IN6 QENS data of native E. coli containing D2O. QENS spectra at Q = 1.5 Å−1, at T = 280 K (left) and T = 300 K (right). The fit for each spectrum was performed in the quasielastic region for −1.5 meV < ℏω < 1.5 meV. The data are indicated by the triangles; the total fitted curve (bold line) was obtained using Eqs. 4 and 5 with a single Lorentzian function. The elastic peak is represented by a dotted line. The Lorentzian is represented by a dash-dotted line. The highest intensity values (top of the frame) in both figures correspond to ∼⅓ of the total intensity at ℏω = 0.
FIGURE 2.

IN6 data. HWHM of the single Lorentzian, Γfast, as a function of Q2 at 280 K (squares) and 300 K (triangles).
FIGURE 3.

IN6 data. EISF as a function of Q, at 280 K (squares) and 300 K (triangles).
At larger Q2 values, the linewidth follows the well-known jump diffusion behavior (29). Γfast increases to approach asymptotically a constant value, Γf∞. Γf∞ is ∼140 μeV at 280 K and 185 μeV at 300 K, which correspond to correlation times, 1/Γf∞, of ∼4.7 ps and 3.6 ps, respectively.
Previous studies performed on hydrated powder at full hydration (hydration level h ∼0.4 g water/g protein) and in solution have revealed similar Q2 dependences for the single Lorentzian analysis (15–17,19,21,34,35). The characteristic parameters, however, appeared to be dependent on the sample type. The length scale explored by the motions in cell macromolecules, given by the sphere radius of ∼3.2 Å, is longer than that explored in fully hydrated powder (15,16) and in the integral membrane protein bacteriorhodopsin (17,21), which present sphere radii between 0.8 Å and 1.7 Å. In contrast, the volume explored by the atoms in cell macromolecules is similar or smaller than the volume explored by the atoms from proteins in solution, depending on the solution concentration. The sphere radii have been found to be 2.5 Å for a concentrated solution of 244 mg/ml of dihydrofolate reductase at 285 K (35); 4.1 Å and 4.4 Å for solutions of 60 mg/ml of myoglobin and lysozyme, respectively, at 293 K (16); and 3.6 Å for a solution of 85 mg/ml of bovine pancreatic trypsin inhibitor at ambient temperature (34). If we exclude the dihydrofolate reductase case, the extrapolated HWHM at Q2 = 0 is smaller for cell macromolecules compared with the value of ∼150 μeV found for proteins in solution and in membrane (16,21) and higher than the value of ∼70 μeV extracted for proteins in fully hydrated powder (15,16). We recall that lower HWHM corresponds to longer correlation times and reflects slower motions. Considering both the length and timescales, the average diffusive motions explored in a few picoseconds inside cell macromolecules lie between those found for proteins in hydrated powder and in solution.
Slow internal motions
By using the 17 μeV energy resolution of the IRIS spectrometer, slower processes belonging to a timescale of a few tens of picoseconds were isolated. As for IN6, the global motions do not contribute to the scattering signal on IRIS. The IRIS spectra were fitted with two Lorentzian functions using Eqs. 4 and 5. The HWHM of the broad Lorentzian, Γfast, is plotted in Fig. 4 for the 280 K and 300 K temperatures. It revealed a similar profile to that found for IN6 data fitted with one Lorentzian: at low Q2, Γf0 is ∼100 μeV at the two temperatures; Γfast increases at larger Q2 values up to Γf∞ values of 140 μeV and 180 μeV at 280 K and 300 K, respectively, which correspond to correlation times of ∼4.7 ps and 3.7 ps, respectively. The broad Lorentzian, therefore, was attributed to the fast internal motions isolated previously on IN6 with the single-Lorentzian approach.
FIGURE 4.

IRIS data. HWHM of the broad Lorentzian, Γfast, as a function of Q2 at 280 K (squares) and 300 K (triangles).
The HWHM of the sharp Lorentzian, Γslow, plotted in Fig. 5 showed a Q2-independent profile, indicating reorientational motions. Γslow had a mean value of ∼14 μeV at the two temperatures, corresponding to a correlation time of 44 ps. The sharp Lorentzian arises from slower internal motions, compared with the fast processes characterized on IN6. The slow processes can be, for example, stochastic reorientations of large molecular subunits, such as polypeptide side chains, fatty acid chains, or other molecular subunits, as well as rotational motions of smaller groups such as protons in methyl groups. Molecular dynamics simulations on hydrated lysozyme at 295 K have shown that methyl groups presented a wide range of associated correlation times, with a mean value of ∼75 ps (14). The Q dependence of the quasielastic incoherent structure factors associated with the slow motions (figure not shown) revealed a profile that suggests a two-site jump diffusion model. It is in good agreement with a previous work on purple membrane (18), in which Fitter et al. have investigated internal molecular motions of bacteriorhodopsin at 297 K, using the same energy resolution on IRIS (18). They have isolated a “slow” proton population, whose motions were described by a two-site jump diffusion model, with associated relaxation times, 2/Γf∞, of 80–100 ps. It corresponds to correlation times of ∼40–50 ps, which are similar to the correlation times found for E. coli.
FIGURE 5.

IRIS data. HWHM of the sharp Lorentzian, Γslow, as a function of Q2, at 280 K (squares) and 300 K (triangles).
Very slow internal motions and macromolecular self-diffusion
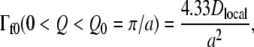
Very slow internal motions were separated from macromolecular self-diffusion using the energy resolution of the IN16 spectrometer (FWHM = 0.9 μeV), which gives access to characteristic times up to 1 ns. The apparent self-diffusion coefficient, D, of hemoglobin in red blood cells has been found to be ∼1.2 × 10⁻⁷ cm2/s in D2O at 310 K (25). Hemoglobin is the main component of red blood cells, with a molecular mass of 64 kDa and a concentration ∼330 mg/ml, close to that in the cell cytoplasm (26). Cellular macromolecules present a distribution of molecular masses, going from a few tens to a few thousands of kilodaltons. Considering similar macromolecular concentrations, the apparent self-diffusion coefficient of E. coli macromolecules, mainly proteins, is expected to be of the same order as the value found for hemoglobin in red blood cells. The QENS broadening arising from global motions of cellular macromolecules coincides, therefore, with the IN16 energy resolution and has to be taken into account to extract very slow internal motions from the scattering signal. The global and internal motions were each well described by a single Lorentzian, and Eq. 2 described in Materials and Methods simplified as follows:
 |
(8) |
The broad Lorentzian arises mainly from the internal contribution, Γvery slow, and is broadened by the self-diffusion contribution, Γself, as described in Eq. 8. The results of the fit obtained using Eq. 8 are shown in Fig. 6.
FIGURE 6.

IN16 QENS data and applied fits for native E. coli containing D2O. QENS spectra at Q = 1.3 Å−1, at T = 284 K (left) and T = 303 K (right). The fit for each spectrum was performed in the quasielastic region for −12 μeV < ℏω < 12 μeV. The data are indicated with the associated error bars. The bold line is the total fitted curve obtained using Eqs. 4 and 8. The broad Lorentzian is shown by a dot-dash line, and the sharp Lorentzian by a dashed line.
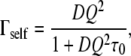
The HWHM of the sharp Lorentzian, Γself, is plotted in Fig. 7. The Γself profile revealed long-range translational motions, as indicated by the increase of the linewidth with Q and the extrapolation to 0 for Q → 0. Γself increased up to ∼0.5 μeV at 284 K and 0.75 μeV at 303 K. The linewidth was well fitted using a jump diffusion model, which describes diffusion between sites with a mean residence time, τ0, at each site (29). Γself follows (29):
 |
(9) |
where D represents the apparent translational diffusion coefficient. We found D = (0.85 ± 0.15) × 10−7 cm2/s, τ0 = 0.97 ± 0.08 ns at 284 K, and D = (1.06 ± 0.11) × 10−7 cm2/s, τ0 = 0.59 ± 0.04 ns at 303 K. The values are consistent with the value of 1.2 × 10⁻⁷ cm2/s found for hemoglobin in red blood cells at 310 K (25). The average characteristic distance between two jumps was found to be 2.2 Å at 284 K and 1.9 Å at 303 K, which are reasonable values for macromolecules with an average radius of gyration of a few tens of angstroms. These values are also in good agreement with the value of 1.0 Å found by Busch et al. at 293 K for myoglobin in crowded solutions with a concentration close to the cell cytoplasm (32). We attributed, therefore, the sharp Lorentzian to the apparent self-diffusion of macromolecules in the E. coli interior.
FIGURE 7.

IN16 data. HWHM of the sharp Lorentzian, Γself, as a function of Q2 at 284 K (squares) and 303 K (triangles).
The HWHM of the broad Lorentzian, corrected for the broadening arising from the self-diffusion contribution, was extracted and is plotted in Fig. 8; Γvery slow revealed a Q2-independent profile. The mean HWHM is 7.0 μeV at 284 K and 7.3 μeV at 303 K, which correspond to correlation times of ∼94 ps and 90 ps, respectively. Γvery slow arises from very slow internal motions from all protons participating, for example, in librations of buried groups, relative displacements of globular domains, sugar conformational changes, or RNA global bending (36). The correlation times found for E. coli macromolecules are close to those found in previous studies on proteins in concentrated solutions (32) or in membrane stacks (20) at similar energy resolutions: using the HFBS spectrometer (FWHM = 0.8 μeV) at NIST (37), Busch et al. found a HWHM = 10 μeV, which corresponds to a correlation time of 65 ps for myoglobin in concentrated solution with a volume fraction of 0.4 (32); using the IN10 spectrometer (FWHM = 1.8 μeV) at the ILL, Fitter et al. evaluated a mean HWHM = 5.5 μeV for bacteriorhodopsin in purple membrane stacks, which corresponds to a correlation time of 120 ps (20).
FIGURE 8.

IN16 data. HWHM of the broad Lorentzian corrected for the self-diffusion contribution as a function of Q2, at 284 K (squares) and 303 K (triangles).
Influence of the cellular environment on macromolecular dynamics
The QENS study on E. coli led to the first dynamical mapping of macromolecular dynamics in vivo, on the full ps-ns timescale accessible through neutron scattering. The large panel of internal macromolecular motions as well as the self-diffusion of cell macromolecules were explored and characterized in vivo.
The analysis of the internal motions permitted the separation between a fast picosecond process and slower (tens of picoseconds) processes. Physiological internal motions were found to be a combination of reorientational and restricted jump diffusion motions. The comparison with previous in vitro studies revealed interesting differences between physiological internal motions and those found in hydrated powders or in solution. Both internal molecular flexibility and diffusion rates occurring in a few picoseconds are increased significantly in the cell interior compared with fully hydrated powders. The result showed that the large amount of cell water plays a decisive role in physiological internal dynamics. The effect of water, which was observed mainly on the picosecond timescale associated with hydrogen bond breaking and formation, suggested that the cell water hydrogen bond network influences the hydrogen bond dynamics in macromolecular structures and contributes to physiological structural flexibility. However, the smaller values found for the parameters measured in vivo compared with those measured in solution suggested that weak forces caused by the vicinity of macromolecules attenuate the lubricating effect of water.
The work on E. coli demonstrated that powders and solutions do not accurately picture the physiological dynamical behavior of macromolecules. It underlined the central role of cellular water as well as the slight influence of macromolecular crowding on internal macromolecular dynamics in living cells. The study suggests that the intracellular complexity participates in physiological functional dynamics necessary to biological activity.
Acknowledgments
We thank the ILL and the ISIS neutron facilities for providing beam time. We acknowledge Dr. M. Koza and Dr. B. Frick (ILL, France) for assistance with the IN6 and IN16 measurements, and Dr. S. Rols (ILL, France) for help with the QENS_fit routine handling. We thank Dr. M. F. Telling (ISIS, Rutherford Laboratory, UK) for help with the IRIS measurements and the MODES program.
M.J. acknowledges support of a French Science Ministry doctoral fellowship. M.T. acknowledges the ILL, the CNRS, and the IBS (UMR 5075) for financial support of this work. The research was supported by the European Union under the two contracts for the Deuteration Laboratory (ILL, France), HPRI-CT-2001-50035 and RII3-CT-2003-505925, and by the Integrated Infrastructure Initiative for Neutron Scattering and Muon Spectroscopy (NMI3).
M. Jasnin's present address is Institut Laue Langevin, Grenoble, France.
M. Tehei's present address is the University of Wollongong, School of Chemistry, Wollongong, Australia.
Editor: Elliot L. Elson.
References
- 1.Brooks, C. L., M. Karplus, and B. M. Pettitt. 1988. Proteins: a theoretical perspective of dynamics, structure, and thermodynamics. Adv. Chem. Phys. 71:1–249. [Google Scholar]
- 2.Austin, R. H., K. W. Beeson, L. Eisenstein, H. Frauenfelder, and I. C. Gunsalus. 1975. Dynamics of ligand binding to myoglobin. Biochemistry. 14:5355–5373. [DOI] [PubMed] [Google Scholar]
- 3.Rousseau, F., and J. Schymkowitz. 2005. A systems biology perspective on protein structural dynamics and signal tranduction. Curr. Opin. Struct. Biol. 15:23–30. [DOI] [PubMed] [Google Scholar]
- 4.Tousignant, A., and J. N. Pelletier. 2004. Protein motions promote catalysis. Chem. Biol. 11:1037–1042. [DOI] [PubMed] [Google Scholar]
- 5.Jimenez, R., G. Salazar, J. Yin, T. Joo, and F. E. Romesberg. 2004. Protein dynamics and the immunological evolution of molecular recognition. Proc. Natl. Acad. Sci. USA. 101:3803–3808. [DOI] [PMC free article] [PubMed] [Google Scholar]
- 6.Gabel, F., D. Bicout, U. Lehnert, M. Tehei, M. Weik, and G. Zaccai. 2002. Protein dynamics studied by neutron scattering. Q. Rev. Biophys. 35:327–367. [DOI] [PubMed] [Google Scholar]
- 7.Frauenfelder, H., F. Parak, and R. D. Young. 1988. Conformational substates in proteins. Annu. Rev. Biophys. Biophys. Chem. 17:451–479. [DOI] [PubMed] [Google Scholar]
- 8.Smith, J. C. 1991. Protein dynamics: comparison of simulations with inelastic neutron scattering experiments. Q. Rev. Biophys. 24:227–291. [DOI] [PubMed] [Google Scholar]
- 9.Andreani, C., A. Filabozzi, F. Menzinger, A. Desideri, A. Deriu, and D. Di Cola. 1995. Dynamics of hydrogen atoms in superoxide dismutase by quasielastic neutron scattering. Biophys. J. 68:2519–2523. [DOI] [PMC free article] [PubMed] [Google Scholar]
- 10.Dellerue, S., A. J. Petrescu, J. C. Smith, and M. C. Bellissent-Funel. 2001. Radially softening diffusive motions in a globular protein. Biophys. J. 81:1666–1676. [DOI] [PMC free article] [PubMed] [Google Scholar]
- 11.Doster, W., S. Cusack, and W. Petry. 1989. Dynamical transition of myoglobin revealed by inelastic neutron scattering. Nature. 337:754–756. [DOI] [PubMed] [Google Scholar]
- 12.Fitter, J. 1999. The temperature dependence of internal molecular motions in hydrated and dry α-amylase: The role of hydration water in the dynamical transition of proteins. Biophys. J. 76:1034–1042. [DOI] [PMC free article] [PubMed] [Google Scholar]
- 13.Paciaroni, A., A. Orecchini, S. Cinelli, G. Onori, R. E. Lechner, and J. Pieper. 2003. Protein dynamics on the picosecond timescale as affected by the environment: a quasielastic neutron scattering study. Chem. Phys. 292:397–404. [Google Scholar]
- 14.Roh, J. H., J. E. Curtis, S. Azzam, V. N. Novikov, I. Peral, Z. Chowdhuri, R. B. Gregory, and A. P. Sokolov. 2006. Influence of hydration on the dynamics of lysozyme. Biophys. J. 91:2573–2588. [DOI] [PMC free article] [PubMed] [Google Scholar]
- 15.Zanotti, J. M., M. C. Bellissent-Funel, and J. Parello. 1997. Dynamics of a globular protein as studied by neutron scattering and solid-state NMR. Physica B (Amsterdam). 234:228–230. [Google Scholar]
- 16.Pérez, J., J. M. Zanotti, and D. Durand. 1999. Evolution of the internal dynamics of two globular proteins from dry powder to solution. Biophys. J. 77:454–469. [DOI] [PMC free article] [PubMed] [Google Scholar]
- 17.Fitter, J., O. P. Ernst, T. Hauß, R. E. Lechner, K. P. Hofmann, and N. A. Dencher. 1998. Molecular motions and hydration of purple membranes and disk membranes studied by neutron scattering. Eur. Biophys. J. 27:638–645. [DOI] [PubMed] [Google Scholar]
- 18.Fitter, J., R. E. Lechner, G. Büldt, and N. A. Dencher. 1996. Internal molecular motions of bacteriorhodopsin: hydration-induced flexibility studied by quasielastic incoherent neutron scattering using oriented purple membranes. Proc. Natl. Acad. Sci. USA. 93:7600–7605. [DOI] [PMC free article] [PubMed] [Google Scholar]
- 19.Fitter, J., R. E. Lechner, G. Büldt, and N. A. Dencher. 1996. Temperature dependence of molecular motions in the membrane protein bacteriorhodopsin from QINS. Physica B (Amsterdam). 226:61–65. [Google Scholar]
- 20.Fitter, J., R. E. Lechner, and N. A. Dencher. 1997. Picosecond molecular motions in bacteriorhodopsin from neutron scattering. Biophys. J. 73:2126–2137. [DOI] [PMC free article] [PubMed] [Google Scholar]
- 21.Fitter, J., R. E. Lechner, and N. A. Dencher. 1999. Interactions of hydration water and biological membranes studied by neutron scattering. J. Phys. Chem. B. 103:8036–8050. [Google Scholar]
- 22.Ellis, R. J. 2001. Macromolecular crowding: an important but neglected aspect of the intracellular environment. Curr. Opin. Struct. Biol. 11:114–119. [DOI] [PubMed] [Google Scholar]
- 23.Elowitz, M. B., M. G. Surette, P. E. Wolf, J. B. Stock, and S. Leibler. 1999. Protein mobility in the cytoplasm of Escherichia coli. J. Bacteriol. 181:197–203. [DOI] [PMC free article] [PubMed] [Google Scholar]
- 24.Luby-Phelps, K. 2000. Cytoarchitecture and physical properties of cytoplasm: volume, viscosity, diffusion, intracellular surface area. Int. Rev. Cytol. 192:189–221. [DOI] [PubMed] [Google Scholar]
- 25.Doster, W., and S. Longeville. 2007. Microscopic diffusion and hydrodynamic interactions of hemoglobin in red blood cells. Biophys. J. 93:1360–1368. [DOI] [PMC free article] [PubMed] [Google Scholar]
- 26.Ellis, R. J. 2001. Macromolecular crowding: obvious but underappreciated. Trends Biochem. Sci. 26:597–604. [DOI] [PubMed] [Google Scholar]
- 27.MODES. A graphic user interface for IRIS data analysis. http://www.isis.rl.ac.uk/molecularspectroscopy/iris/.
- 28.LAMP. The Large Array Manipulation Program. http://www.old.ill.fr/data_treat/lamp/front.html.
- 29.Bée, M. 1988. Quasielastic Neutron Scattering: Principles and Applications in Solid State Chemistry, Biology and Materials Science. Adam Hilger, Philadelphia.
- 30.Tehei, M., B. Franzetti, D. Madern, M. Ginzburg, B. Z. Ginzburg, M. T. Giudici-Orticoni, M. Bruschi, and G. Zaccai. 2004. Adaptation to extreme environments: macromolecular dynamics in bacteria compared in vivo by neutron scattering. EMBO Rep. 5:66–70. [DOI] [PMC free article] [PubMed] [Google Scholar]
- 31.Madigan, M. T., J. M. Martinko, and J. Parker. 2000. Brock Biology of Microorganisms. Prentice Hall, Engelwood Cliffs, NJ.
- 32.Busch, S., W. Doster, S. Longeville, and V. G. Sakai. 2007. Microscopic protein diffusion at high concentration. MRS Bulletin. Quasielastic Neutron Scattering Conference 2006, p.117–116.
- 33.Volino, F., and A. J. Dianoux. 1980. Neutron incoherent scattering law for diffusion in a potential of spherical symmetry: general formalism and application to diffusion inside a sphere. Mol. Phys. 41:271–279. [Google Scholar]
- 34.Appavou, M. S., G. Gibrat, and M. C. Bellissent-Funel. 2006. Influence of pressure on structure and dynamics of bovine pancreatic trypsin inhibitor (BPTI): small angle and quasi-elastic neutron scattering studies. Biochim. Biophys. Acta. 1764:414–423. [DOI] [PubMed] [Google Scholar]
- 35.Tehei, M., J. C. Smith, C. Monk, J. Ollivier, M. Oettl, V. Kurkal, J. L. Finney, and R. M. Daniel. 2006. Dynamics of immobilized and native Escherichia coli dihydrofolate reductase by quasielastic neutron scattering. Biophys. J. 90:1090–1097. [DOI] [PMC free article] [PubMed] [Google Scholar]
- 36.Mc Cammon, J. A., and S. C. Harvey. 1987. Dynamics of Proteins and Nucleic Acids. Cambridge University Press, New York.
- 37.Meyer, A., R. M. Dimeo, P. M. Gehring, and D. A. Neumann. 2003. The high-flux backscattering spectrometer at the NIST Center for Neutron Research. Rev. Sci. Instrum. 74:2759–2777. [Google Scholar]