

Abstract
Wide angle x-ray scattering (WAXS) from oriented lipid multilayers is used to examine liquid-ordered (Lo)/liquid-disordered (Ld) phase coexistence in the system 1,2-dioleoyl-sn-glycero-3-phosphocholine/1,2-dipalmitoyl-sn-glycero-3-phosphocholine/cholesterol (DOPC/DPPC/Chol), which is a model for the outer leaflet of the animal cell plasma membrane. Using the method of analysis developed in the accompanying work, we find that two orientational distributions are necessary to fit the WAXS data at lower temperatures, whereas only one distribution is needed at temperatures higher than the miscibility transition temperature, Tmix = 25–35°C (for 1:1 DOPC/DPPC with 15%, 20%, 25%, and 30% Chol). We propose that the necessity for two distributions is a criterion for coexistence of Lo domains with a high Sx-ray order parameter and Ld domains with a lower order parameter. This criterion is capable of detecting coexistence of small domains or rafts that the conventional x-ray criterion of two lamellar D spacings may not. Our Tmix values tend to be slightly larger than published NMR results and microscopy results when the fluorescence probe artifact is considered. This is consistent with the sensitivity of WAXS to very short time and length scales, which makes it more capable of detecting small, short-lived domains that are likely close to Tmix.
INTRODUCTION
A wealth of research has indicated that cell membrane “rafts”, small domains containing cholesterol and rich in sphingolipids, provide platforms for protein and lipid sorting and play important roles in cellular processes such as signal transduction and membrane transport (1–3). Detection of these lipid domains in cells relies on indirect methods such as detergent extraction and cholesterol depletion because they are too small to be observed with optical microscopy (4). Although cell membrane rafts are not easily visualized, macroscopic liquid-liquid phase separation has been observed with optical microscopy in models of the outer leaflet of the plasma membrane, consisting of ternary mixtures of cholesterol, sphingomyelin or a saturated phospholipid, and an unsaturated phospholipid (5).
In these model membranes, liquid-ordered (Lo) domains, containing cholesterol and rich in saturated lipid, separate from liquid-disordered (Ld) domains, rich in unsaturated lipid. The Lo domains in model membranes have been linked to the detergent-resistant fractions in cell membranes, but the exact relationship between liquid-liquid phase coexistence in model membranes and rafts in cell membranes remains unclear (6–8). However, several theories have linked macroscopic lipid domains observed in model systems to submicroscopic rafts in the cell membrane. These include confinement of nanoscopic lipid microenvironments by corrals in the cytoskeleton network (9) and nanoscale fluctuating lipid domains at physiological temperature (10), which is generally above the temperatures at which macroscopic phase coexistence is observed in model systems. Therefore, techniques which are capable of detecting submicroscopic domains in model membranes may prove particularly valuable for understanding the physical origin and behavior of membrane rafts in vivo.
Since the observation of macroscopic liquid-liquid coexistence in giant unilamellar vesicles composed of 1:1:1 1,2-dioleoyl-sn-glycero-3-phosphocholine (DOPC)/brain sphingomyelin (BSM)/Chol by fluorescence microscopy (11), many experimenters have used this technique to examine Ld-Lo phase coexistence in model membrane systems. However, based on the observation of only a single lamellar repeat in x-ray data for multilamellar vesicles (MLVs) composed of 1:1:1 DOPC/BSM/Chol, it was concluded that x-ray scattering showed no evidence of phase separation in this system (12). This discrepancy between x-ray and fluorescence microscopy results is particularly relevant at this time because of recent work documenting artifacts caused by fluorescent probes in model membrane systems (13–15).
In addition to fluorescence microscopy, many other common methods for investigating phase coexistence in model membranes, including fluorescence resonance energy transfer (16) and electron spin resonance (17,18), require potentially perturbing probe molecules. The use of probe-free methods for detecting phase coexistence in model membranes, particularly biologically relevant liquid-liquid coexistence in ternary mixtures, is relatively limited. Although double lamellar repeats have not been observed in 1:1:1 DOPC/BSM/Chol (12), double lamellar repeats have been observed in DOPC/1,2-dipalmitoyl-sn-glycero-3-phosphocholine (DPPC)/Chol mixtures using x-ray scattering from MLVs (19) and aligned multilayers (20). Liquid-liquid phase coexistence has been investigated in DOPC/DPPC-d62/Chol mixtures using 2H-NMR (10,21), small angle neutron scattering (22), and coherent anti-Stokes Raman scattering microscopy (23). Improved 1H-NMR techniques have been used to detect Ld-Lo coexistence in ternary mixtures without isotopic labeling (24,25). Calorimetry has been used to study phase coexistence in binary lipid/Chol mixtures (26), although investigators disagree on its interpretation (27). Accurately and completely mapping complicated ternary phase diagrams requires several techniques sensitive to different physical properties (28), and so another reliable probe-free method, such as x-ray scattering, for detecting liquid-liquid phase coexistence in such systems would be of value.
Two well-known criteria for observing phase coexistence via x-ray scattering are 1), the existence of two lamellar repeat (D) spacings in low/small angle x-ray scattering (LAXS/SAXS) data, and 2), two chain-chain correlation (d) spacings in wide angle x-ray scattering (WAXS) data. Since chain ordering is one of the fundamental features that distinguishes the different lamellar phases, WAXS is useful because it directly probes chain correlations. As gel phases are characterized by sharp WAXS peaks at d ∼ 4.2 Å and fluid phases are characterized by broad wide angle scattering with d ∼ 4.5 Å, gel-fluid coexistence can be determined by two nonoverlapping d spacings (criterion 2). Because Ld and Lo phases are characterized by broad, fluid-like bands, we expect the WAXS peaks to overlap. However, oriented WAXS images contain additional information about chain orientational order not available from unoriented samples (29,30). Using an approach first applied to lipid multilayers by Levine and Wilkins (29), in the accompanying work (31) we show that the angular distribution (φ, as defined in Mills et al. (31)) of scattering can be analyzed to obtain orientational order parameters (Sx-ray) for liquid-phase samples. For more ordered phases, the angular distribution of scattering is narrower. We show that we can deconvolute I(φ) data into scattering from two separate chain distributions with different order parameters, thereby providing a third, and what we believe is a new x-ray criterion for observing phase coexistence. All the criteria are listed in Table 1, which also lists many properties to be explained in detail later.
TABLE 1.
Summary of x-ray criteria for phase coexistence
| Criterion | See Fig. | Gel-fluid?* | Ld-Lo?* | Requires oriented samples? | Complications |
|---|---|---|---|---|---|
| 1 (Double Ds) | 4 | Yes | Yes | No | Sufficient but not necessary |
| 2a (Double ds obvious in I(q) plot) | 1 A | Yes | No | No | 1. Fluid WAXS peak often obscured in unoriented samples |
| 2. A single gel phase can have 2 d spacings† | |||||
| 2b (Double ds inferred from shape of q0(φ) plot) | 3 | No | Yes | Yes | Requires 
|
| 3 (Double Sx-ray) | 2 | No | Yes | Yes | Requires modeling |
The phrases “gel-fluid?” and “Ld-Lo?” ask if the criterion is applicable to that type of phase coexistence.
The Lβ′ phase has two wide angle d spacings due to its distorted hexagonal lattice. However, both Lβ′ peaks are narrower (40) than fluid-phase peaks.
DOPC/DPPC/Chol is a good test system, as its phase diagram has been reported using both fluorescence microscopy (32) and 2H-NMR (10,21). We compare our new method (criterion 3) with our x-ray results for the miscibility transition temperature Tmix obtained using criterion 1 (double Ds) as well as a refinement of criterion 2 (double ds). We then compare our x-ray results with Tmix results from 2H-NMR (10) and from fluorescence microscopy (32). Overall, the x-ray, NMR, and fluorescence results agree but exhibit small differences that may result from fluorescent probe artifacts and limitations in the length scales probed (more than ∼1 μm for microscopy and more than ∼20 nm for 2H-NMR). WAXS is probe-free and detects down to molecular length scales, which may prove advantageous for detecting small domains.
MATERIALS AND METHODS
Mixtures of DOPC (Avanti Polar Lipids, Alabaster, AL; Lot No. 181PC-211), DPPC (Avanti Polar Lipids; Lot No. 160PC-270), and cholesterol (Chol) (Nuchek Prep, Elysian, MN; Lot No. CH-800-MA7-L and Lot No. CH-800-AU25-Q) were prepared from stock solutions in high performance liquid chromatography-grade chloroform (Fisher Scientific, Pittsburgh, PA). A detailed description of sample preparation of oriented and MLV samples and experimental x-ray setups is provided in the accompanying work (31). For all the ternary mixtures studied (1:1 DOPC/DPPC + 15%, 20%, 25%, and 30% Chol) as well as 1:1 DOPC/DPPC, the solvent mixture used for the rock-and-roll method of oriented sample deposition was 2:1 chloroform/trifluoroethanol. (The notation “1:1 DOPC/DPPC + 30% Chol” indicates a sample composed of the following ratio of mole fractions: 0.35:0.35:0.30 DOPC/DPPC/Chol.) A table of lamellar repeat data for MLV and oriented samples is given in Data Supplement 5 of the accompanying work (31).
To analyze the WAXS data to obtain information about the chain orientational distribution, we follow the approach of Levine and Wilkins (29) described in the accompanying work (31), which models the angular I(φ) distribution of scattering as originating from grains, each oriented at an angle β to the membrane normal. If the sample is in a single phase, a single orientational distribution f(β) should describe the system. The fitting equation for the I(φ) data, assuming a single Maier-Saupe orientational distribution, is given in the accompanying work (see Eq. 4 in Mills et al. (31)). If there is phase coexistence between a disordered and a more ordered phase (i.e., Ld-Lo coexistence in ternary mixtures), the system may require two distribution functions to fit the data:
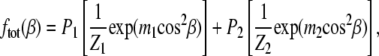 |
(1) |
where P1 and P2 are the fraction of each phase, Z1 and Z2 are normalization constants, and m1 and m2 are positive parameters which determine the width of the orientational distribution. Larger m corresponds to a narrower distribution with greater orientational order. The fitting equation is
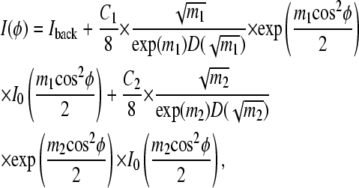 |
(2) |
where D is Dawson's integral, I0 is the modified Bessel function of the first kind, and the five fitting parameters are the constant background Iback, C1 and m1 for phase 1, and C2 and m2 for phase 2. The parameters C1 and C2 are proportional to the amount of sample, beam intensity, and length of exposure. A problem with interpreting P1 = C1/(C1 + C2) and P2 = C2/(C1 + C2) as true phase fractions is that the model assumes all the wide angle scattering results from chain-chain interactions. However, in addition to phospholipid-phospholipid scattering, cholesterol-cholesterol and cholesterol-phospholipid scattering also contribute to the total scattering observed, and so we resist overinterpreting the quantities P1 and P2, especially when phases in the sample have different amounts of cholesterol. Two order parameters  each corresponding to one of the two phases, are calculated from m1 and m2. In the rest of the work, we refer to Eq. 4 from Mills et al. (31) as the single-order parameter fit and to Eq. 2 as the double-order parameter fit.
Although the double-order parameter fit always describes the data as well as or better than the single-order parameter fit because it has more fitting parameters (5 vs. 3), the double-order parameter fit was rejected if either
the single-order parameter fit was reasonable, i.e., if the residual plot was random and the background-subtracted data remained positive, or
any of the fitting parameters for the double-order parameter fit had an uncertainty on the same order as the value of the parameter (see also the Supplementary Material, Data S1).
Both the data and fits shown in this work were normalized by first subtracting Iback and then dividing by C (for the single-order parameter fit) or C1 + C2 (for the double-order parameter fit). Normalizing in this way reveals if the background-subtracted data are unphysically negative.
Sample preparation, equilibration, and hydration are all factors which can affect phase behavior (discussed further in the Supplementary Material, Data S2). As described in the accompanying work (31), all the oriented and MLV samples were annealed in a hydrated state at ∼65°C for 4–8 h to ensure the mixing of the lipid components and then slowly cooled over the course of ∼8 h to allow the system time to equilibrate at lower temperature.
Considerable care is required to fully hydrate oriented samples without depositing a layer of excess water (flooding). As flooding partially obscures the lipid WAXS peak, the oriented WAXS data reported here are for samples within 5 Å of the fully hydrated D spacing (31). Data were also collected from oriented samples at full hydration. The choice between the single- or double-order parameter fit was independent of whether the samples were fully hydrated or within 5 Å of full hydration; but the flooded sample data were noisy, and fits resulted in larger uncertainties in the fitting parameters.
The existence of two lamellar repeat spacings is evidence of two coexisting phases, but insufficient time for hydration and temperature equilibration can also cause transient double lamellar repeats. Before being loaded into capillaries, our MLV samples (with 5:1–10:1 (v/v) water/lipid) were temperature-cycled (three cycles between −20°C and 65°C with mechanical mixing) and annealed at 65°C and slowly cooled to room temperature at 2°C/h. For the ternary mixtures, x-ray scattering data were first collected from the capillary samples at 15°C. After increasing the temperature in 5°C steps to 45°C (above the melting temperature of DPPC), the samples were cycled back down to 15°C in 5°C steps. At each temperature step, samples were equilibrated for at least 30 min before data collection. In all cases, only a single D spacing was observed at 45°C. At lower temperatures, the observation of double D spacings was reproducible between the heating and cooling cycles. The values of the D spacings varied by no more than 0.3 Å between the heating and cooling cycles, confirming that the double D spacings in our samples are due to equilibrium phase separation.
RESULTS AND DISCUSSION
Fig. 1 A shows oriented sample WAXS images and the corresponding I(q) plots for a binary mixture reported to have coexisting gel and fluid domains by fluorescence methods (32,33). Gel-fluid coexistence is evident in Fig. 1 A from the sharp peak at q = 1.5 Å−1 (d = 4.2 Å), which is characteristic of a gel phase, and a broad peak at q ∼ 1.4 Å−1 (d ∼ 4.5 Å), which is characteristic of a fluid phase. Fig. 1 B shows WAXS images and the corresponding I(q) plots for a ternary mixture reported by fluorescence microscopy (32) and NMR (10) to have coexisting Ld and Lo domains below the miscibility transition temperature, Tmix. In contrast to Fig. 1 A, two wide angle d spacings are not obvious in Fig. 1 B, which is expected, as both the Ld and Lo phases are characterized by broad, diffuse bands due to fluid-like positional disorder.
FIGURE 1.

Two-dimensional charge-coupled device images for (A) 1:1 DOPC/DPPC at 25°C; (B) 1:1 DOPC/DPPC + 15% Chol at 25°C; and (C) 1:1 DOPC/DPPC + 15% Chol at 45°C. The bottom row shows the corresponding I(q) plots with φ-ranges of 5–15°, 15–25°, …, 75–85°. Data collection and processing are described in detail in the accompanying work (31). Uncertainties in measured intensities are 1% of the maximum intensity.
In unoriented WAXS data, gel-fluid coexistence can be detected based on two separated peaks, but liquid-liquid coexistence cannot be identified because of overlap of the broad scattering from the Ld and Lo phases. Fig. 1 C shows data for the same ternary mixture as in Fig. 1 B, but in a single Ld phase above Tmix. However, it is not obvious from a comparison of Fig. 1 C and Fig. 1 B that one is in a single phase and the other is phase separated. Oriented WAXS data of the type shown in Fig. 1, B and C, were typical for all the ternary mixtures we studied: 1:1 DOPC/DPPC + 15%, 20%, 25%, and 30% Chol. The I(q) plots in Fig. 1, B and C, show that these samples are liquid-like because the peak has a large halfwidth at half-maximum (HWHM; ∼0.16 Å−1), similar to liquid phase DOPC/Chol and DPPC/Chol mixtures (31). The angular (φ, as defined in Fig. 1 C) distribution of scattering in oriented WAXS data gives additional information, which we explore in this work in regard to liquid-liquid phase coexistence.
Oriented WAXS data provide evidence of liquid-liquid phase coexistence in ternary mixtures
Fits to I(φ) data
Fig. 2 shows the normalized I(φ) plots with fits assuming one order parameter in A and two order parameters in B (using Eq. 2) for the mixture 1:1 DOPC/DPPC + 15% Chol. For T ≥ 35°C, the data were well fit with one order parameter which, by our criterion 3, indicates a single phase. (The double-order parameter fits are not shown for 40°C and 45°C because they gave the same value, to within 0.01, for both order parameters.) For T ≤ 30°C, the single-order parameter fit can clearly be rejected for the two reasons given in Materials and Methods; this was also the case for other ternary mixtures we studied. According to our new x-ray criterion 3 for phase coexistence, the necessity for a double-order parameter fit indicates liquid-liquid phase coexistence for T ≤ 30°C and a single phase for T ≥ 35°C; so the Tmix value for 1:1 DOPC/DPPC + 15% Chol falls between 30°C and 35°C. (Data S1 in the Supplementary Material contains more details about data fitting and error analysis.)
FIGURE 2.

I(φ) experimental plots for 1:1 DOPC/DPPC + 15% Chol at various temperatures are shown by gray data points. Black lines show (A) the single-order parameter fits (Eq. 4 in Mills et al. (31)) and (B) the double-order parameter fits (Eq. 2). Both the data and fits are normalized as described in Materials and Methods. Each plot is offset from the one below by 0.15 normalized intensity units. In (B) under the 15°C data, the dashed and dotted lines show the scattering intensity from the less ordered (m1 = 3.69, S1 = 0.52) and more ordered (m2 = 30.6, S2 = 0.95) distributions, respectively. Uncertainties in measured intensities are 0.5% of the maximum intensity.
We note that criterion 3 depends upon the choice of the f(β) orientational distribution. Although the Maier-Saupe distribution works well to describe the scattering from many liquid crystalline systems, other distributions could sometimes be more appropriate (34), and so it is important to establish that a single Maier-Saupe distribution fits the data when the sample is known to have a single phase. Our interpretation that a poor single-order parameter fit is evidence of phase coexistence is therefore supported by the observation that these ternary mixtures for T ≥ 35°C and the single-phase DOPC/Chol and DPPC/Chol mixtures (31) are all well fitted by a single Maier-Saupe distribution.
WAXS peak position as a function of φ
Fig. 3 shows the value q0 of the maximum in the WAXS intensity as a function of φ for 1:1 DOPC/DPPC + 15% Chol at 15°C, 25°C, 35°C, and 45°C. For samples known to be in a single phase (fluid-phase DOPC or DPPC), the q0(φ) data are similar to the 35°C and 45°C data in Fig. 3: as a function of φ, q0 monotonically increases because the isotropic water peak at q ∼ 2.0 Å−1 is a larger fraction of the scattering at larger φ (see Data Supplement 3 in Mills et al. (31)). However, for 1:1 DOPC/DPPC + 15% Chol at T ≤ 30°C, q0 decreases as a function of φ up to φ ∼ 20° and then begins to increase. Similar behavior was observed for all the ternary mixtures studied. The observation of a minimum in the q0(φ) data at temperatures of 30°C and below correlates well with criterion 3 in the previous subsection. Although the q0(φ) behavior does not provide additional information about the coexisting phases (such as order parameters from the I(φ) plots), it may be a useful model-independent criterion for detecting liquid-liquid phase coexistence using WAXS from oriented samples. We henceforth call this criterion 2b in Table 1 and the previous criterion 2 is criterion 2a. Criterion 2b also uses the q dependence of the intensity maxima as in criterion 2a, but in a more subtle way that uses the φ-dependence rather than just relying on two d values. We note that criterion 2b obviously requires oriented samples, whereas criterion 2a may not.
FIGURE 3.

Wide angle peak position, q0(φ), plot for 1:1 DOPC/DPPC + 15% Chol at different temperatures. Each data point represents a Δφ = 5° range, with the data point plotted at the start value. The 20°C and 30°C data also had a dip at small φ, whereas the 40°C data were monotonically increasing. In each plot, the error bars, which are shown only on the first data point, are the same magnitude for the rest of the data points.
Observation of a minimum in a q0(φ) plot requires the assumption that q0 is smaller for the Ld phase than for the Lo phase; this appears to be the case for the DOPC/DPPC/Chol mixtures studied, but may not necessarily be true for all ternary mixtures (see the Supplementary Material, Data S3, for a discussion of the plausibility of this assumption). On the other hand, if q0 is larger for the Ld phase than for the Lo phase, q0 will monotonically increase as a function of φ as in single-phase samples. Therefore, criterion 2b may give a false negative for phase coexistence and should not supersede criterion 3.
Lamellar repeat data for ternary mixtures
Fig. 4 shows the lamellar repeat data for MLVs composed of 1:1 DOPC/DPPC with 15% and 30% Chol. For 1:1 DOPC/DPPC + 15% Chol (Fig. 4 A), two peaks corresponding to two lamellar D spacings are clearly resolvable in the second-order reflection for T ≤ 30°C. (Second-order data are better resolved compared with first-order data (not shown), and higher order peaks are difficult to observe.) For 1:1 DOPC/DPPC + 30% Chol (Fig. 4 B), two peaks are resolvable for T ≤ 20°C, although at 25°C there is a broad shoulder on the right-hand side of the single peak. Data S2 in the Supplementary Material includes a comparison of our D spacing data to previous reports (19,20) of double Ds in DOPC/DPPC/Chol mixtures. Our larger D spacings (see Table S2.1 in Data S2) indicate that the samples in these other studies were less than fully hydrated, which may affect phase behavior (discussed further in Data S2). Although reaching full hydration of aligned multilayers even under nominal 100% relative humidity conditions, as used in Karmakar et al. (20), is a challenge, the samples used in Chen et al. (19) were MLVs in excess water.
FIGURE 4.

I(q) plots for MLVs of 1:1 DOPC/DPPC with (A) 15% Chol and (B) 30% Chol. The q-range shows only the second-order lamellar Bragg peaks.
In contrast to DOPC/DPPC/Chol, only one D spacing was reported for 1:1:1 DOPC/BSM/Chol (12), a mixture which has been called the “canonical raft mixture”. This mixture is close to a phase boundary, and so a small uncertainty in the lipid ratio could have caused the mixture to be outside the two-phase region (35). The mixture 1:1 DOPC/BSM + 20% Chol was suggested as a better choice for such experiments because it is well within a two-phase region at 25°C (35). However, our x-ray scattering results for an MLV sample of 1:1 DOPC/BSM + 20% Chol also have only one D = 69.7 Å at 25°C (data not shown).
We also observe only one D for 1:1 DOPC/DPPC at 25°C (D = 63.2 Å for MLVs) in both fully hydrated unoriented MLV samples and oriented samples. This mixture is known to exhibit gel-fluid coexistence (32,33); in addition, our WAXS data clearly show two wide angle peaks for this sample (see Fig. 1 A). On the other hand, two D spacings were reported for 1:1 DOPC/BSM at 25°C (12), which also separates into gel and fluid phases. Clearly, relying on lamellar repeat spacings to determine the absence of phase coexistence can be misleading.
To see two lamellar repeat spacings, the following conditions must be met:
The D spacings must be different enough for the peaks to be resolved.
The Lo (or Ld) domains must be aligned with the Lo (or Ld) domains across the water layer in the neighboring bilayers.
Fig. 5 A shows that alignment of domains across many bilayers leads to packing frustration (12), particularly if the two lamellar repeat spacings are very different. The system could relieve strain by organizing as shown in Fig. 5 B, in which case an average D spacing would be observed. In Fig. 5 A, the phase separation is three dimensional, whereas in Fig. 5 B the phase separation is two dimensional, as it occurs within single bilayers. Lipid type, lipid purity, and sample preparation may all affect whether the two conditions are met. For example, pure DOPC and pure DPPC have very similar D spacings at 25°C (D ∼ 63–64 Å), providing a possible explanation for why two Ds were not resolvable in 1:1 DOPC/DPPC.
FIGURE 5.

(A) Cartoon showing the Ld (black) and Lo (gray) domains in alignment between neighboring bilayers with two D spacings. (B) The domains are unaligned in neighboring bilayers, resulting in a single average D spacing. The white spaces represent water, and the filled areas represent a single lipid bilayer.
Comparison of x-ray criteria for detecting phase coexistence
Table 1 summarizes the criteria for phase coexistence based on the x-ray scattering data discussed above. Although double Ds (criterion 1) provide clear evidence of phase coexistence, the absence of two D spacings does not imply the absence of phase coexistence. Criterion 2 (double ds) is separated into parts 2a and 2b; 2b is described in the section “WAXS peak position as a function of φ”. Criterion 2a can in principle be applied to both oriented and unoriented samples, but in practice the fluid-phase WAXS peak can be obscured in unoriented samples with gel-fluid coexistence (for example, see Fig. 3 in Chen et al. (19)). We suggest that criterion 3, described in the section “Fits to I(φ) data”, may be the best for liquid-liquid coexistence, but we reiterate from the accompanying work (31) that it should not be applied to gel-fluid coexistence.
Fig. 6 shows Sx-ray results and lamellar repeat results for the four ternary mixtures studied. For a given temperature, phase coexistence is indicated by two different values of Sx-ray (criterion 3) or two lamellar D spacings (criterion 1). The assignment of the larger D to the Lo phase was based on the trend in D as cholesterol concentration was varied in binary mixtures with DPPC or with DOPC and on the assumption of nearly horizontal tie lines in the liquid-liquid coexistence region (10). According to criterion 3, Tmix is between 30°C and 35°C for all four ternary mixtures. For the mixtures studied, criterion 2b was always consistent with criterion 3, and so we can assign a single miscibility temperature  For 1:1 DOPC/DPPC with 25% and 30% Chol, there is a single lamellar repeat at temperatures with two Sx-ray values. As discussed in the previous section, the absence of two lamellar repeats does not imply a single phase.
FIGURE 6.

Top plots show Sx-ray (solid symbols) or SNMR (open symbols), and bottom plots show lamellar repeat D (for MLV samples) versus temperature for 1:1 DOPC/DPPC + varying amounts of cholesterol: (A) 15%, (B) 20%, (C) 25%, and (D) 30%. Different shapes represent different phases: squares, Lo; circles, Ld; triangles, single phase. The dashed vertical line shows the miscibility transition temperature  detected by NMR (10), and the dotted line shows
  detected by fluorescence microscopy (32). An offset of +2.5°C has been added to the 2H-NMR temperatures, reflecting the lower melting temperature of DPPC-d62 compared with DPPC. For many of the Sx-ray data points, the error bars (determined from uncertainties in the fits) are smaller than the symbols. Uncertainties in lamellar repeats are ±0.5 Å.
WAXS measures correlations over molecular length scales. Assuming a Lorentzian lineshape, the correlation length given by ξ = 1/HWHM is ξ ∼ 6 Å for fluid-phase WAXS peaks. In contrast, lamellar scattering results from correlations over several bilayers at least, each with D ∼ 60 Å. In principle, the correlation length in the direction of the membrane normal can be calculated from the width of the lamellar peaks using the Scherrer equation (36). The data shown in Fig. 4 were resolution limited, allowing assignment of only a lower limit on the correlation length of ∼800 Å, or ∼13 lipid bilayers in correlated stacks. The requirement that bilayers be aligned to observe lamellar peaks means that the sample must be phase-separated in three dimensions to see two D spacings (12). In contrast, WAXS scattering from well-hydrated samples is incoherent between different bilayers, even in gel phases. It therefore detects only the behavior of single bilayers, including two-dimensional phase separation within single bilayers. The oriented WAXS methods (criteria 3 and 2b) may be more reliable than the SAXS method (criterion 1) for detecting liquid-liquid phase coexistence by giving fewer false negatives because WAXS is intrinsically capable of detecting small domains because of its short correlation length.
Comparison of WAXS results to NMR and fluorescence microscopy
Fig. 6 compares our values of Sx-ray to  from 2H-NMR data (10). 2H-NMR first moments (M1) were converted to SNMR using Eq. 11 in Ipsen et al. (37). The Sx-ray values tend to be larger than the SNMR values. This was also the case for DPPC/Chol mixtures at 45°C (31). Sx-ray and SNMR do not report exactly the same physical quantity, and so they should not necessarily have the same value (31).
The miscibility transition temperatures,  from 2H-NMR (10) and
  from fluorescence microscopy (32), are indicated in Fig. 6. Uncertainties in
  are reported to be ±2°C (10). Uncertainties in
  have been reported to be at most 5°C (32). Fig. 6, A and B, shows that
  agrees with
  and
and  for the lower cholesterol concentrations to within the 5°C or 10°C steps used in the x-ray experiments. For the higher cholesterol concentrations there is agreement between
  and
and  (Fig. 6, C and D), but
  is lower than
  This difference is not large and could be accounted for by a +5°C relative shift of
  For the 25% and 30% Chol samples, the third and largest difference is between
  and
and  However, artifactual light-induced domains expand the region of Ld-Lo coexistence (13,14), which would lead to an increase in
  This explanation then suggests that our
  is higher than both
  and dye artifact-corrected
  for these samples. We next consider why this is plausible.
When comparing Tmix values, we must consider the effect of differences in averaging between 2H-NMR and x-ray methods (38). The 2H-NMR data reflect the environment experienced by individual molecules averaged over the characteristic time for spin decay (microsecond timescale). Because each molecule diffuses during this time, if individual domains are smaller than 20 nm, the 2H-NMR signal will be averaged (39). In contrast, an x-ray image is a spatial average of very fast snapshots (subpicosecond) of the state of the system, so diffusive motion is not significant. In principle, then, WAXS can detect spatial heterogeneities that have too short a length scale to be seen by NMR. Since the length scale of spatial heterogeneities typically decreases with increasing temperature, one might expect WAXS to detect small scale heterogeneities at higher temperatures than NMR and dye-corrected fluorescence. Indeed,  was higher than
  for half our ternary mixtures.
CONCLUSIONS
We have developed what we believe is a new x-ray scattering criterion to detect phase coexistence in lipid bilayer mixtures. Fits to the WAXS I(φ) data suggest the presence of liquid-liquid coexistence in ternary mixtures of DOPC, DPPC, and cholesterol. Our results are in good agreement with 2H-NMR and fluorescence microscopy, suggesting that our method of determining if two order parameters are necessary to fit the WAXS data is a valid way to decide if a mixture is phase-separated into two fluid phases. Due to the complexity of ternary phase diagrams, multiple techniques are required to fully characterize the phase behavior. WAXS also provides a tool for studying orientational and positional order in such systems.
WAXS is sensitive to molecular (∼6 Å) length scales and averages over a very fast timescale, making it particularly suitable for detecting nanoscale lipid domains in single bilayers, which may be most relevant to cell membrane rafts. In contrast, the conventional observation of two lamellar D spacings requires the larger length scale alignment of domains across several bilayers, which can lead to packing frustration and false negative diagnosis of phase separation. The small length scale of WAXS is also an advantage compared to fluorescence microscopy (∼1-μm-length scale), which has the added complication of requiring potentially perturbing dye. 2H-NMR is subject to microsecond time averaging, which limits detectable domain size to tens of nanometers. In contrast, the length and timescales for WAXS are much shorter.
SUPPLEMENTARY MATERIAL
To view all of the supplemental files associated with this article, visit www.biophysj.org.
Supplementary Material
Acknowledgments
We thank Sarah L. Veatch for sharing NMR data before publication and for helpful discussions. We thank Mark W. Tate for help with the rotating anode x-ray measurements and Arthur Woll, Detlef-M. Smilgies, and Norbert Kučerka for help with the CHESS experiments. T.T.M. acknowledges Elaine Farkas, Adam Hammond, Jeremy Pencer, David Worcester, Sol Gruner, Carl Franck, and James Sethna for helpful discussions.
This work was supported by grants from the National Science Foundation (MCB-0315330) to G.W.F. and the National Institutes of Health (GM 44976) to J.F.N. T.T.M., F.A.H., and N.F.M. were supported in part by a National Institutes of Health research award (1-T32-GM08267). The rotating anode x-ray facility is supported by the Department of Energy award DE-FG02-97ER62443 to Sol Gruner. This work is based upon research conducted at the Cornell High Energy Synchrotron Source (CHESS), which is supported by the National Science Foundation and the National Institutes of Health/National Institute of General Medical Sciences under National Science Foundation award DMR-0225180.
Editor: Thomas J. McIntosh.
References
- 1.Simons, K., and E. Ikonen. 1997. Functional rafts in cell membranes. Nature. 387:569–572. [DOI] [PubMed] [Google Scholar]
- 2.Mukherjee, S., and F. R. Maxfield. 2004. Membrane domains. Annu. Rev. Cell Dev. Biol. 20:839–866. [DOI] [PubMed] [Google Scholar]
- 3.Holowka, D., J. A. Gosse, A. T. Hammond, X. M. Han, P. Sengupta, N. L. Smith, A. Wagenknecht-Wiesner, M. Wu, R. M. Young, and B. Baird. 2005. Lipid segregation and IgE receptor signaling: a decade of progress. Biochim. Biophys. Acta. 1746:252–259. [DOI] [PubMed] [Google Scholar]
- 4.London, E. 2005. How principles of domain formation in model membranes may explain ambiguities concerning lipid raft formation in cells. Biochim. Biophys. Acta. 1746:203–220. [DOI] [PubMed] [Google Scholar]
- 5.Veatch, S. L., and S. L. Keller. 2005. Seeing spots: complex phase behavior in simple membranes. Biochim. Biophys. Acta. 1746:172–185. [DOI] [PubMed] [Google Scholar]
- 6.Brown, D. A. 2006. Lipid rafts, detergent-resistant membranes, and raft targeting signals. Physiology (Bethesda). 21:430–439. [DOI] [PubMed] [Google Scholar]
- 7.Hancock, J. F. 2006. Lipid rafts: contentious only from simplistic standpoints. Nat. Rev. Mol. Cell Biol. 7:456–462. [DOI] [PMC free article] [PubMed] [Google Scholar]
- 8.Simons, K., and W. L. C. Vaz. 2004. Model systems, lipid rafts, and cell membranes. Annu. Rev. Biophys. Biomol. Struct. 33:269–295. [DOI] [PubMed] [Google Scholar]
- 9.Kusumi, A., and K. Suzuki. 2005. Toward understanding the dynamics of membrane-raft-based molecular interactions. Biochim. Biophys. Acta. 1746:234–251. [DOI] [PubMed] [Google Scholar]
- 10.Veatch, S. L., O. Soubias, S. L. Keller, and K. Gawrisch. 2007. Critical fluctuations in domain-forming lipid mixtures. Proc. Natl. Acad. Sci. USA. 104:17650–17655. [DOI] [PMC free article] [PubMed] [Google Scholar]
- 11.Dietrich, C., L. A. Bagatolli, Z. N. Volovyk, N. L. Thompson, M. Levi, K. Jacobson, and E. Gratton. 2001. Lipid rafts reconstituted in model membranes. Biophys. J. 80:1417–1428. [DOI] [PMC free article] [PubMed] [Google Scholar]
- 12.Gandhavadi, M., D. Allende, A. Vidal, S. A. Simon, and T. J. McIntosh. 2002. Structure, composition, and peptide binding properties of detergent soluble bilayers and detergent resistant rafts. Biophys. J. 82:1469–1482. [DOI] [PMC free article] [PubMed] [Google Scholar]
- 13.Ayuyan, A. G., and F. S. Cohen. 2006. Lipid peroxides promote large rafts: effects of excitation of probes in fluorescence microscopy and electrochemical reactions during vesicle formation. Biophys. J. 91:2172–2183. [DOI] [PMC free article] [PubMed] [Google Scholar]
- 14.Zhao, J., J. Wu, H. L. Shao, F. Kong, N. Jain, G. Hunt, and G. Feigenson. 2007. Phase studies of model biomembranes: macroscopic coexistence of Lα + Lβ, with light-induced coexistence of Lα + Lo phases. Biochim. Biophys. Acta. 1768:2777–2786. [DOI] [PMC free article] [PubMed] [Google Scholar]
- 15.Veatch, S. L., S. S. W. Leung, R. E. W. Hancock, and J. L. Thewalt. 2007. Fluorescent probes alter miscibility phase boundaries in ternary vesicles. J. Phys. Chem. B. 111:502–504. [DOI] [PubMed] [Google Scholar]
- 16.Heberle, F. A., J. T. Buboltz, D. Stringer, and G. W. Feigenson. 2005. Fluorescence methods to detect phase boundaries in lipid bilayer mixtures. Biochim. Biophys. Acta. 1746:186–192. [DOI] [PMC free article] [PubMed] [Google Scholar]
- 17.Chiang, Y. W., Y. Shimoyama, G. W. Feigenson, and J. H. Freed. 2004. Dynamic molecular structure of DPPC-DLPC-cholesterol ternary lipid system by spin-label electron spin resonance. Biophys. J. 87:2483–2496. [DOI] [PMC free article] [PubMed] [Google Scholar]
- 18.Recktenwald, D. J., and H. M. McConnell. 1981. Phase equilibria in binary mixtures of phosphatidylcholine and cholesterol. Biochemistry. 20:4505–4510. [DOI] [PubMed] [Google Scholar]
- 19.Chen, L., Z. W. Yu, and P. J. Quinn. 2007. The partition of cholesterol between ordered and fluid bilayers of phosphatidylcholine: a synchrotron x-ray diffraction study. Biochim. Biophys. Acta. 1768:2873–2881. [DOI] [PubMed] [Google Scholar]
- 20.Karmakar, S., B. R. Sarangi, and V. A. Raghunathan. 2006. Phase behaviour of lipid-cholesterol membranes. Solid State Commun. 139:630–634. [Google Scholar]
- 21.Veatch, S. L., I. V. Polozov, K. Gawrisch, and S. L. Keller. 2004. Liquid domains in vesicles investigated by NMR and fluorescence microscopy. Biophys. J. 86:2910–2922. [DOI] [PMC free article] [PubMed] [Google Scholar]
- 22.Pencer, J., T. Mills, V. Anghel, S. Krueger, R. M. Epand, and J. Katsaras. 2005. Detection of submicron-sized raft-like domains in membranes by small-angle neutron scattering. Eur. Phys. J. E. 18:447–458. [DOI] [PubMed] [Google Scholar]
- 23.Li, L., H. F. Wang, and J.-X. Cheng. 2005. Quantitative coherent anti-Stokes Raman scattering imaging of lipid distribution in coexisting domains. Biophys. J. 89:3480–3490. [DOI] [PMC free article] [PubMed] [Google Scholar]
- 24.Filippov, A., G. Orädd, and G. Lindblom. 2004. Lipid lateral diffusion in ordered and disordered phases in raft mixtures. Biophys. J. 86:891–896. [DOI] [PMC free article] [PubMed] [Google Scholar]
- 25.Polozov, I. V., and K. Gawrisch. 2006. Characterization of the liquid-ordered state by proton MAS NMR. Biophys. J. 90:2051–2061. [DOI] [PMC free article] [PubMed] [Google Scholar]
- 26.Vist, M. R., and J. H. Davis. 1990. Phase equilibria of Chol/dipalmitoylphosphatidylcholine mixtures: 2H nuclear magnetic resonance and differential scanning calorimetry. Biochemistry. 29:451–464. [DOI] [PubMed] [Google Scholar]
- 27.McMullen, T. P. W., and R. N. McElhaney. 1995. New aspects of the interaction of cholesterol with dipalmitoylphosphatidylcholine bilayers as revealed by high-sensitivity differential scanning calorimetry. Biochim. Biophys. Acta. 1234:90–98. [DOI] [PubMed] [Google Scholar]
- 28.Zhao, J., J. Wu, F. A. Heberle, T. T. Mills, P. Klawitter, G. Huang, G. Costanza, and G. W. Feigenson. 2007. Phase studies of model biomembranes: complex behavior of DSPC/DOPC/Chol. Biochim. Biophys. Acta. 1768:2764–2776. [DOI] [PMC free article] [PubMed] [Google Scholar]
- 29.Levine, Y. K., and M. H. F. Wilkins. 1971. Structure of oriented lipid bilayers. Nat. New Biol. 230:69–72. [DOI] [PubMed] [Google Scholar]
- 30.Spaar, A., and T. Salditt. 2003. Short range order of hydrocarbon chains in fluid phospholipid bilayers studied by x-ray diffraction from highly oriented membranes. Biophys. J. 85:1576–1584. [DOI] [PMC free article] [PubMed] [Google Scholar]
- 31.Mills, T. T., G. E. S. Toombes, S. Tristram-Nagle, D.-M. Smilgies, G. W. Feigenson, and J. F. Nagle. 2008. Order parameters and areas in fluid-phase oriented lipid membranes using wide angle x-ray scattering. Biophys. J. 95:669–681. [DOI] [PMC free article] [PubMed] [Google Scholar]
- 32.Veatch, S. L., and S. L. Keller. 2003. Separation of liquid phases in giant vesicles of ternary mixtures of phospholipids and cholesterol. Biophys. J. 85:3074–3083. [DOI] [PMC free article] [PubMed] [Google Scholar]
- 33.Lentz, B. R., Y. Barenholz, and T. E. Thompson. 1976. Fluorescence depolarization studies of phase transitions and fluidity in phospholipid bilayers. 2. Two-component phosphatidylcholine liposomes. Biochemistry. 15:4529–4537. [DOI] [PubMed] [Google Scholar]
- 34.Savenko, S. V., and M. Dijkstra. 2004. Accuracy of measuring the nematic order from intensity scatter: a simulation study. Phys. Rev. E Stat. Nonlin. Soft Matter Phys. 70:011705. [DOI] [PubMed] [Google Scholar]
- 35.Veatch, S. L., and S. L. Keller. 2003. A closer look at the canonical ‘raft mixture’ in model membrane studies. Biophys. J. 84:725–726. [DOI] [PMC free article] [PubMed] [Google Scholar]
- 36.Guinier, A. 1963. X-Ray Diffraction in Crystals, Imperfect Crystals, and Amorphous Bodies. W. H. Freeman and Company, San Francisco.
- 37.Ipsen, J. H., O. G. Mouritsen, and M. Bloom. 1990. Relationships between lipid membrane area, hydrophobic thickness, and acyl-chain orientational order. The effects of cholesterol. Biophys. J. 57:405–412. [DOI] [PMC free article] [PubMed] [Google Scholar]
- 38.Bloom, M., E. Evans, and O. G. Mouritsen. 1991. Physical properties of the fluid lipid-bilayer component of cell membranes: a perspective. Q. Rev. Biophys. 24:293–397. [DOI] [PubMed] [Google Scholar]
- 39.Bloom, M., and J. L. Thewalt. 1995. Time and distance scales of membrane domain organization. Mol. Membr. Biol. 12:9–13. [DOI] [PubMed] [Google Scholar]
- 40.Sun, W. J., R. M. Suter, M. A. Knewtson, C. R. Worthington, S. Tristram-Nagle, R. Zhang, and J. F. Nagle. 1994. Order and disorder in fully hydrated unoriented bilayers of gel phase dipalmitoylphosphatidylcholine. Phys. Rev. E Stat. Phys. Plasmas Fluids Relat. Interdiscip. Topics. 49:4665–4676. [DOI] [PubMed] [Google Scholar]
Associated Data
This section collects any data citations, data availability statements, or supplementary materials included in this article.