

Abstract
Abstract. Objectives: Polycystin‐1 (PC1), a signalling receptor regulating Ca2+‐permeable cation channels, is mutated in autosomal dominant polycystic kidney disease, which is typically characterized by increased cell proliferation. However, the precise mechanisms by which PC1 functions on Ca2+ homeostasis, signalling and cell proliferation remain unclear. Here, we investigated the possible role of PC1 as a modulator of non‐capacitative Ca2+ entry (NCCE) and Ca2+ oscillations, with downstream effects on cell proliferation. Results and discussion: By employing RNA interference, we show that depletion of endogenous PC1 in HEK293 cells leads to an increase in serum‐induced Ca2+ oscillations, triggering nuclear factor of activated T cell activation and leading to cell cycle progression. Consistently, Ca2+ oscillations and cell proliferation are increased in PC1‐mutated kidney cystic cell lines, but both abnormal features are reduced in cells that exogenously express PC1. Notably, blockers of the NCCE pathway, but not of the CCE, blunt abnormal oscillation and cell proliferation. Our study therefore provides the first demonstration that PC1 modulates Ca2+ oscillations and a molecular mechanism to explain the association between abnormal Ca2+ homeostasis and cell proliferation in autosomal dominant polycystic kidney disease.
INTRODUCTION
Increases in cytosolic concentration of Ca2+ ions [Ca2+]i regulate virtually all cellular processes, including events such as survival, proliferation and apoptosis, which decide the fate of each cell (Berridge et al. 2000). These functions are disturbed in autosomal dominant polycystic kidney disease (ADPKD), one of the most common inherited diseases in humans (1 in 500 to 1 in 1000), and one that accounts for about 10% of end‐stage renal failure. The primary phenotype of ADPKD is the progressive expansion, in both kidneys, of multiple fluid‐filled cysts, which gradually replace normal renal tissue and lead to end‐stage renal failure and dialysis dependency by mid‐to‐late adulthood (Gabow 1990). The systemic nature of the disease is determined by a number of extrarenal manifestations (from hepatic and brain cysts to heart valve and cerebrovascular abnormalities) that accompany the kidney cysts (Gabow 1990) and indicate the complex role of ADPKD causative gene products (Ong & Harris 2005).
In approximately 85% of ADPKD cases, the disease arises as a consequence of loss of function and missense mutations of the PKD1 gene, which encodes polycystin‐1 (PC1), with the remaining cases being caused by mutations in polycystin‐2‐encoding PKD2 gene (PC2) (Mochizuki et al. 1996; Harris 1999). The phenotypes associated with either genotype are otherwise very similar, indicating that the two proteins function with the same pathways. PC1 and PC2 are the prototype members of a new family of integral membrane proteins that play important roles in a variety of biological processes, including fertilization, ion translocation and mechanotransduction (Delmas 2004). PC1 (around 450 kDa and 11 transmembrane domains) acts as an orphan receptor mainly involved in control of epithelial cell population growth (Bhunia et al. 2002; Kim et al. 2004; Li et al. 2005; Manzati et al. 2005), migration (Nickel et al. 2002; Polgar et al. 2005), differentiation (Aguiari et al. 1998; Puri et al. 2004) and apoptosis (Boca et al. 2006). In association with PC2, a Ca2+‐regulated Ca2+‐permeable non‐selective cation channel (Hanaoka et al. 2000; González‐Perrett et al. 2001; Koulen et al. 2002), PC1 is required for regulation of the cell cycle (Bhunia et al. 2002) and activation of cation permeable currents (Vandorpe et al. 2001; Babich et al. 2004; Pelucchi et al. 2006); it is also thought to be involved in regulation of G‐protein signalling (Parnell et al. 1998; Delmas et al. 2002).
Our group has recently found that expression of a membrane‐targeted PC1 C‐terminus in kidney HEK293 cells increases cell response to ATP‐evoked [Ca2+]i (Aguiari et al. 2003) and serum‐evoked cell proliferation (Manzati et al. 2005). It has also recently been reported that the treatment of PKD‐cystic cells with molecules causing sustained increases in [Ca2+]i may reverse their mitogenic response (Yamaguchi et al. 2006). Therefore, the aim of the present work was to determine the mechanism by which PC1 modulates Ca2+ levels, considering the possibility that a reduction in endogenous PC1 by small‐interference RNA might affect Ca2+ mobilization and thus induce a growth‐stimulated phenotype characteristic of PKD cells. Our results, obtained by employing pharmacological tools on kidney cell lines depleted of endogenous PC1 by PKD1 RNA interference or in PKD1 mutated cystic cell lines, demonstrate that down‐regulation of PC1 leads to elevation in Ca2+ oscillations by stimulating non‐capacitative Ca2+ entry (NCCE). Such oscillatory signals trigger nuclear factor of activated T cell (NFAT) activation and other Ca2+‐dependent signalling pathways, leading to increased cell proliferation. Furthermore, the inhibitory effects of exogenously expressed PC1 on Ca2+ oscillations, as well as proliferation of HEK293 cells, indicate PC1 as a physiological modulator of NCCE, which plays a crucial role on basal and evoked [Ca2+]i levels. These findings pave the way to future investigations on involvement of such channels in both the physiology and pathophysiology of kidney cells.
MATERIALS AND METHODS
Reagents
Dulbeccos's modified Eagle's medium/F12 and minimum essential medium media, G418 antibiotic, bovine serum albumin (BSA), 1‐(beta‐[3‐(4‐methoxyphenyl) propoxy]‐4‐methoxyphenethyl)‐1H‐imidazole hydrochloride (SKF96365), cyclosporin A, gadolinium and anti‐FLAG M2 mouse monoclonal antibody were obtained from Sigma‐Aldrich (Milano, Italy), foetal bovine serum (FBS) was obtained from Eurobio (Celbio, Milan, Italy) and selective cell‐permeable inhibitors of protein kinase C (PKC)‐α and PKC‐β1 (Ro‐320432 and hispidin, respectively), were purchased from Calbiochem (La Jolla, CA, USA) and protease inhibitors were from Roche Diagnostics (Monza, Italy). Rabbit polyclonal antitubulin and antirabbit rhodamine‐ and FITC‐conjugated antibody were obtained from Santa Cruz (DBA Italia Srl, Segrate, Italy), while rabbit polyclonal antip27 antibody was obtained from Cell Signalling Technology (Celbio SRL, Italy). Enhanced chemiluminescent substrates for Western blotting (SuperSignalDura or SuperSignalFemto) and horseradish peroxidase‐conjugated goat antirabbit and antimouse antibodies were purchased from Pierce (Celbio S.r.l., Milan, Italy). The pSUPER RNAi System was obtained from OligoEngene (Seattle, WA, USA). (R,S)‐(3,4‐dihydro‐6,7‐dimethoxy‐isochinolin‐1‐yl)‐2‐phenyl‐N,N‐di[2‐(2,3,4trimethoxyphenyl)ethyl] acetamid mesylate (LOE908) was kindly provided by Boehringer Ingelheim (Ingelheim, Germany).
Production of siRNA expressing vectors
Two siRNAs (a and b) for PC1 were constructed according to a published method (Brummelkamp et al. 2002). Briefly, 64 nt primers were designed to include a 19‐nt PKD1 sequence, its complement, a spacer region, 5′BglII site and 3′HindIII site.
The forward PKD1a primer sequence: 5′‐GATCCCCCGACAAGCAGTCCCTGACCTTCAAGAGAGGTCAGGGACTGCTTGTCGTTTTAAA‐3′ and the reverse primer sequence: 5′‐AGCTTTTCCAAAAACGACAAGCAGTCCCTGACCTCTCTTGAAGGTCAGGGACTGCTTGTCGGGG‐3′.
The forward PKD1b primer sequence: 5′‐GATCCCCCTTCACGCGGAGCGGCACGTTCAAGAGACGTGCCGCTCCGCGTGAAGTTTTTGGAAA‐3′ and the reverse primer sequence: 5′‐AGCTTTTCCAAAAACTTCACGCGGAGCGGCACGTCTCTTGAACGTGCCGCTCCGCGTGAAGGGG‐3′. The target PKD1 sequence was substituted by a scramble nucleotide sequence as control: 5′‐TTCTCCGAACGTGTCACGT‐3′. Annealed double strands of DNAs were cloned into the pSUPER plasmid vector following the Oligoengene procedure.
Cells, stable transfection, cell cycle and proliferation assays
HEK293 cells were maintained and cultured as previously described (Manzati et al. 2005). Wild‐type (pSUPER) and recombinant constructs (pSiScramble, pSsiPKD1 a and b) were co‐transfected with pCDNA3 (ratio 1 : 10, respectively) by the calcium phosphate method, in HEK293 cells (Pelucchi et al. 2006), and G418‐resistant clones (HEK293pSUPER, HEK293pSiScramble and HEK293pSsiPKD1), and were screened by Western blotting analysis, through detection of endogenous PC1 protein using 7e12 monoclonal antibody (Qian et al. 2003). PKD1 RNA levels were analysed by real‐time RT‐PCR, as previously reported (Aguiari et al. 2004). PKD1 RNA quantification was obtained by the ΔCT method. Transcription of the ACTIN housekeeping gene was used as endogenous RNA control for normalization and the ΔCT was then calculated (ΔCT = CT(target gene) –CT(actin gene)). Final results, expressed as Nfold content in PKD1 gene expression relative to the ACTIN gene, were determined as follows: N(target) = 2−ΔΔCT, as previously described (Aguiari et al. 2004).
Cell cycle analysis was done with the use of flow cytometry of propidium iodide‐treated cells, using the FACSCalibur Becton Dickinson Immunocytometry System. Previously described SV40‐transformed human cell lines (one derived from normal and two from cystic kidney cell lines) (Nauli et al. 2006), were grown in Dulbeccos's modified Eagle's medium/F12, 10% FBS. Cystic cells carry the Q2556X PKD1 mutation: one is heterozygous, while the other is hemizygous, for deletion of the normal allele (Nauli et al. 2006). After plating at low density (30 000 cells/mL) in 24‐well plates, cell proliferation was measured by direct cell counting (Manzati et al. 2005), and by 24 and 48 h incubation with [3H] thymidine (1 µCi/mL).
Transient transfection and immunofluorescence analysis
HEK293pSUPER and HEK293pSsiPKD1 cells were cultured on 24‐mm coverslips for 24 h then were transiently transfected with full‐length FLAG‐tagged mouse PC1 (Grimm et al. 2003) by Ca2+ phosphate precipitation. After 3 days of transfection, non‐fixed cells were washed twice with phosphate‐buffered saline (PBS) buffer and incubated at room temperature for 1 h with anti‐FLAG M2 mouse monoclonal antibody at a dilution of 1 : 200, in a solution containing 0.2% gelatin. After three washes with PBS, cells were treated with a 0.2% gelatin PBS solution that contained secondary antirabbit rhodamine‐conjugated antibody at room temperature in the dark for 1 h. After three washes in PBS, cells were analysed using a Zeiss Axiovert 200 fluorescence microscope equipped with a back‐illuminated CCD camera (Roper Scientific, Tucson, AZ, USA), excitation and emission filter wheels (Sutter Instrument Company, Novato, CA, USA), and piezoelectric motoring of the Z stage (Physik Instrumente, GmbH and Co., Karlsruhe, Germany).
Ca2+ measurement
Measurements of FBS‐evoked calcium levels were performed in cells grown on coverslips and transfected with recombinant cytoplasmic aequorin cDNA (Aguiari et al. 2003). Seventy‐two hours after aequorin reconstitution, cells on coverslips were transferred into the perfusion chamber of a luminometer and, following 1 min of perfusion, stimulated with 1% FBS. The relationship between photon emission (L/L max) and Ca2+ concentration allows conversion by computer algorithm of light released into the specimen. L and L max are the instant and maximal rates of light emission, the former having been obtained after 1% FBS stimulation and the latter brought about by cell lysis with 100 µm digitonin (Manzati et al. 2005).
Cytoplasmic Ca2+ oscillations were measured in Fura‐2AM‐loaded cells (Manzati et al. 2005). Cells, grown on coverslips, were starved ON with BSA, loaded with Fura‐2AM (4 µm/30 min/37 °C), and transferred to the thermostated stage of a Zeiss Axiovert 200 inverted microscope equipped with a Sutter filterwheel and 340/380 excitation filters. Cells were stimulated either with 1% FBS alone or with other molecules for 15 min or 30 min, acquiring 1 image every 1 s or 3 s, respectively. Signals were computed into relative ratio units of the fluorescence intensity of different wavelengths (340/380 nm). Ca2+ oscillation amplitude was calculated by measuring Ca2+ concentration in Fura‐2AM‐loaded cells, as previously described (Manzati et al. 2005). Calibration was carried out using MetaFluor software, according to the equation [Ca2+] = K d × (Sf2/Sb2) × (R–R min)/(R max–R), using K d = 224 nm. R max and R min were determined at the end of each experiment in KRB/Ca2+/1 µm ionomycin, and KRB/1 mm EGTA/ionomycin, respectively.
NFAT and PKC‐α fluorescence analysis
Cells were transfected with either NFAT–green fluorescent protein (GFP) or PKC‐α‐GFP constructs by using the Ca2+ phosphate procedure (Manzati et al. 2005). NFAT and PKC‐α subcellular localization was analysed using a digital fluorescence microscope, and images were captured and recorded using a digital‐imaging system (Manzati et al. 2005).
NFAT luciferase assay
After 24 h plating in a 6‐well plastic plate, cells were transiently transfected with 4 µg of pNFAT‐TA‐Luc plasmid DNA by the Ca2+ phosphate method, and 6 h post‐transfection, they were washed and incubated for an additional 20 h in medium supplemented with 1% FBS. After cell treatment with passive lysis buffer (Promega, Madison, WI, USA), 25 µl of cell lysate was added to 50 µl of luciferase substrate (Promega) and then the samples were analysed using a 20/20n luminometer (Turner Biosystems, Sunnyvale, CA, USA).
Statistical analysis
Where applicable, statistical errors of averaged data were given as means ± SD or SEM and statistical significance was assessed by Student's t‐test.
RESULTS
Relationship between PC1 depletion by RNA interference and proliferation of HEK293 cells
A variable, but consistent down‐regulation of PC1 was accomplished in HEK293pSsiPKD1 cell clones obtained by stable transfection with pSUPER plasmid expressing PKD1 siRNAs (Fig. 1a). An average of more than ∼50% reduction in PC1 protein was found in clones transfected by either the a or b PKD1 siRNA‐cloned sequence, as compared to those transfected with the empty vector or that expressing the scramble nucleotide sequence, as controls [Fig. 1b, PC1/β‐tubulin: 0.70 ± 0.09 and 0.55 ± 0.5 in HEK293pSsiPKD1 a and b clones (pSsiPKD1), respectively, versus 1.52 ± 0.11 and 1.46 ± 0.34 in control HEK293pSUPER and HEK293pSiScramble clones (pS and pSSc); P < 0.01 and P < 0.05, respectively, versus pS and P < 0.05 versus pSc]. This inhibition of PC1 by siRNA was found to be selective as neither variations in β‐tubulin were observed, nor PC1 levels altered, in clones expressing the control vectors. Moreover, extent of PC1 inhibition was consistent with the reduction in PKD1 RNA, as shown in HEK293pSsiPKD1 a cells by real‐time RT‐PCR analysis (Fig. 1c).
Figure 1.
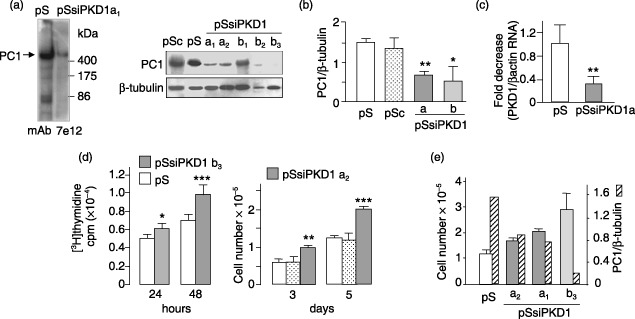
PKD1 gene silencing increases cell proliferation in HEK293 cells. (a) Western blot analysis of PC1 from plasma membranes of HEK293 cells stably transfected with plasmids expressing two PKD1‐specific siRNA (pSsiPKD1 a and b) and one scramble RNA sequence (pSsiScramble, pSc), and transfected with the pSUPER empty vector (pS). A representative entire blot of the control HEK293pSUPER clone 1 (pS), and HEK293pSsiPKD1 clone a1 (pSsiPKD1) is included. The analysis of PC1 probed with the monoclonal antibody 7e12 (Qian et al. 2003) was related to β‐tubulin. The variations in β‐tubulin levels were due to unequal protein loading. Two a and three b HEK293pSsiPKD1 clones are shown. (b) The expression of either pSsiPKD1 a or b construct significantly reduced PC1 production in comparison with that of β‐tubulin. Bars show the average relative PC1 expression (± SEM) in six controls (three HEK293pSUPER, pS, white bar; and three HEK293pSsiScramble, pSc, grained bar), 10 HEK293pSsiPKD1 a and 3 HEK293pSsiPKD1 b clones (dark and light grey bars) from three independent experiments (a and b versus pS, **P < 0.01 and *P < 0.05, respectively, unpaired Student's t‐test). (c) Fold decrease in PKD1 mRNA levels in HEK293pSsiPKD1 clone a (grey bar) compared to HEK293pSUPER cells (pS, white bar), as detected by real‐time RT‐PCR analysis. PKD1 RNA levels relative to those of actin RNA were measured by ΔΔCt values that were calculated as described in the Methods section. Bars show the average (± SD) of four different experiments (**P < 0.01, unpaired Student's t‐test). (d) [3H] thymidine incorporation after both 24 and 48 h incubation with 1% FBS was higher in HEK293pSsiPKD1 clone b3 (grey bar) than to HEK293pSUPER control cells (white bar); moreover, HEK293pSsiPKD1 cell proliferation was also increased after 3 and 5 days of culture in the presence of 1% FBS (HEK293pSUPER cells, white bars, HEK293pSsiScramble cells, grained bars, and HEK293pSsiPKD1 clone a2, grey bars, the only one studied after 5 days). The data shown are the mean (± SD) of at least two independent experiments (*P < 0.05, **P < 0.01 and ***P < 0.001, unpaired Student's t‐test). (e) After 3 days, cell proliferation increase was greater in HEK293pSsiPKD1 b3 clone showing lower PC1 expression (hatched bars).
Because the loss of PC1 in kidney cysts is associated with proliferation of epithelial cells, and HEK293 cells overexpressing the putative dominant negative PC1 C‐terminus have been shown to increase cell proliferation (Manzati et al. 2005), HEK293pSsiPKD1 stably transfected cells were assessed for possible changes in cell proliferation. PC1 inhibition did indeed cause a significant increase in 1% FBS‐induced cell proliferation, as illustrated by the examples shown in Fig. 1d. This increase was detectable both in [3H] thymidine uptake after 24 and 48 h incubation, and after 3 and 5 days of culture (106 667 ± 5700 versus 62 333 ± 8500 and 65 100 ± 11 300 after 3 days of culture, and 203 333 ± 6500 versus 126 667 ± 5600 and 120 600 ± 17 800 after 5 days, respectively, in HEK293pSsiPKD1 cells versus HEK293pSUPER and HEK293pSiScramble control cells; P < 0.01 and P < 0.001 after 3 and 5 days, respectively). Furthermore, proliferation increase in HEKpSsiPKD1 a1 and a3 cells was found to be smaller than that observed in b3 cells, which showed the lowest PC1 levels (Fig. 1e), thus indicating a relationship between degree of PC1 suppression and cell proliferation.
PC1 expression reduces calcium oscillation
The effect of PC1 silencing on [Ca2+]i evoked by FBS, at 1% concentration used in cell proliferation studies, was initially investigated in HEKpSsiPKD1 clone a1 through both aequorin and Fura‐2AM experiments.
After transfection with Ca2+‐sensitive photoprotein aequorin, a slight, although non‐significant, increase in serum‐induced cytoplasmic Ca2+ peak was found in HEKpSsiPKD1 cells, as compared to control cells (bars of Fig. 2a). Nevertheless, it is apparent from representative traces of Fig. 2a that Ca2+ levels were more sustained and oscillating in HEKpSsiPKD1 cells. These differences were confirmed in single‐cell Ca2+‐imaging experiments (Fig. 2b). Representative traces from HEK293pSUPER and HEK293pSsiPKD1 cells revealed a pattern of changes in FBS‐evoked Ca2+ levels that was characterized by oscillation frequency that was consistently higher in HEK293pSsiPKD1 cells. The oscillation increase was observed in 81.5% of cells (n = 76). When the analysis was performed in different HEKpSsiPKD1 clones, mean oscillation frequency increased ∼2‐fold as compared to control cells (9.78 versus 5.52 and 5.36 in HEK293pSsiPKD1 and HEKpSiScramble cells, respectively, the mean values in a 15‐min period, P < 0.01) (Fig. 2c), suggesting a relationship between reduced PC1 expression and increased Ca2+ oscillation. Oscillation amplitude, expressed as Ca2+ concentration, was not different in HEK293pSUPER and HEK293pSsiPKD1 cells (98.05 ± 29.12 nm and 102.00 ± 20.89 nm in HEK293pSUPER and HEK293pSsiPKD1 cells, respectively, Fig. 2d), lending further support to the hypothesized association between PC1 deficiency and oscillation frequency. Because the difference in oscillation frequency at 10% FBS concentration was markedly reduced (from about 2 in 1% FBS to about 1.4‐fold in 10% FBS, Fig. 2e), further experiments were performed in 1% FBS. Moreover, because no significant differences were observed between HEK293pSUPER and HEK293pSiScramble cells, further experiments were mainly performed using HEK293pSUPER cells.
Figure 2.
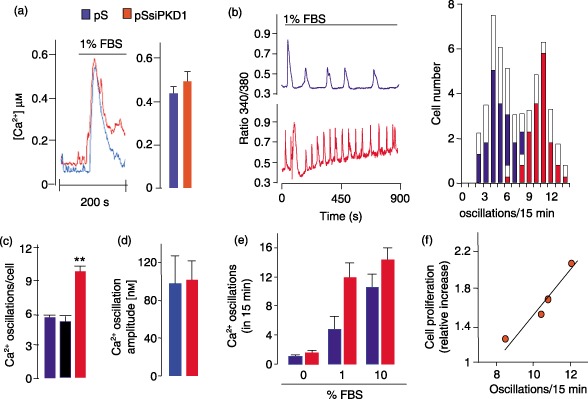
PKD1 gene silencing increases FBS‐induced Ca2+ oscillation frequency in HEK293 cells. (a) Representative cytoplasmic Ca2+ levels from control HEK293pSUPER 1 (pS, blue trace) and HEK293pSsiPKD1 a1 (red trace) cells. Ca2+ levels were measured in cells transfected with the Ca2+‐binding photoprotein cytAEQ. Where indicated, cells were challenged with 1% FBS. Bars represent the peak evoked by FBS stimulation (averages ± SEM, P = 0.057) in control (blue) and HEK293pSsiPKD1 (red) clones. (b) FBS increased Ca2+ oscillation frequency in PKD1‐specific siRNA expressing cells. Representative Ca2+ signals from an individual control pS (blue trace) and HEK293pSsiPKD1 a1 cell (red trace) loaded with Fura‐2‐AM and stimulated with 1% FBS. Average distribution of Ca2+ oscillation frequency (± SD, white parts of the bars) from HEK293pSUPER 1 (n = 66 cells, four experiments) and HEK293pSsiPKD1 a1 cells (61 = cells min period, four experiments) in 15 min after FBS stimulation. (c) Bars indicate the average Ca2+ oscillation frequency in four HEK293pSUPER, three HEK293pSsiScramble (black bar) and four HEK293pSsiPKD1 different clones. The data are the means ± SEM of five experiments (P < 0.01 versus pS, unpaired Student's t‐test). (d) Average (± SD) of Ca2+ oscillation amplitude in three HEK293pSUPER (blue bar) and five HEK293pSsiPKD1 (red bar) clones. Amplitude is expressed as Ca2+ concentration, measured as described in the Materials and Methods section. (e) Calcium oscillations (average ± SD) evoked by treatment with 0%, 1% and 10% FBS in three HEK293pSUPER (blue bars) and four HEK293pSsiPKD1 (red bars) clones. (f) Cell proliferation increase as a function of Ca2+ oscillation frequency in four different HEK293pSsiPKD1 clones relative to the HEK293pSUPER 1 control clone.
Consistent with increase in proliferation observed in HEK293pSsiPKD1 cells, oscillation frequency was higher in HEK293pSsiPKD1 clones with higher proliferation rates (Fig. 2f), strongly indicating the relation between Ca2+ oscillation frequency and cell proliferation. The b3 clone, which exhibited greatest oscillation and proliferation associated with the most pronounced PC1 down‐regulation (Fig. 1e), was used in the further experiments.
To test the hypothesis of a role for PC1 in regulating Ca2+ oscillatory patterns, the latter were examined in HEK293pSsiPKD1 cells transiently transfected with a cDNA plasmid expressing mouse full‐length PC1‐containing N‐ter FLAG and C‐ter HA tags (Grimm et al. 2003). Exogenous expression of mouse PC1 (mPC1) was demonstrated by anti‐FLAG immunoblotting in total lysates of both HEK293pSUPER and HEK293pSsiPKD1 mPC1‐transfected cells, and confirmed in at least 20% of cells by anti‐FLAG immunofluorescence (inset of Fig. 3), indicating that mPC1 was not silenced by specific human PKD1 siRNA. mPC1 expression caused a clear reduction in oscillation frequency in some cells (Fig. 3a), leading to an average 30% reduction (Fig. 3b, left). Notably, a similar reduction was also observed in PC1‐transfected HEK293pSUPER control cells (Fig. 3a,b, right). Combined, these findings suggest that exogenous expression of PC1 is capable of reducing Ca2+ oscillation in HEK293 kidney cells. Furthermore, stable transfection of mouse PC1 in HEK293 cells caused a statistically significant reduction in cell proliferation (Fig. 3c). After 3 days of 1% FBS treatment, mean cell proliferation was reduced almost by half in four different PC1‐transfected clones (371 833 ± 171 660 versus 766 666 ± 28 284 cells in transfected versus untrasfected cells, respectively, P < 0.05). This finding demonstrates that PC1‐dependent reduction in Ca2+ oscillations is strongly associated to reduction in cell proliferation.
Figure 3.
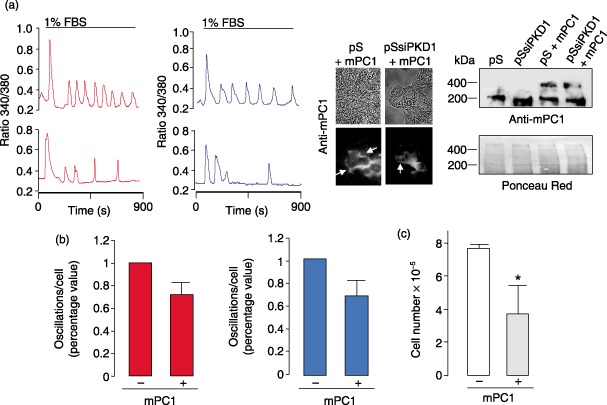
Exogenous expression of PC1 reduces Ca2+ oscillation frequency in HEK293 cells. (a) Representative Ca2+ oscillation patterns from individual HEK293pSsiPKD1 (red) and HEK293pSUPER (blue) cells before (upper traces) and after (lower traces) transient transfection with the mouse PC1 expressing plasmid (mPC1). Cells were grown on coverslips, transfected with the plasmid DNA as described in the Materials and Methods section, loaded with Fura‐2‐AM after 48 h and stimulated with 1% FBS, as described in Fig. 2. Inset: the expression of the mouse PC1 was confirmed by Western blotting and immunofluorescence analysis, as shown in HEK293pSUPER (pS) and HEK293pSsiPKD1 (pSsiPKD1) transfected cells, the latter showing that mPC1 is not silenced by human PKD1 siRNA. Cells were lysed and total extracts were analysed by immunoblotting with the anti‐FLAG M2 mouse monoclonal antibody recognizing the FLAG‐tagged mouse PC1, as described in the Materials and Methods section. The antibody identified a band of about 400 kDa in only mPKD1 cDNA‐transfected HEK293pSUPER and HEK293pSsiPKD1 cells. The ~200 kDa band was deemed to be aspecific as present in all samples. For immunofluorescence analysis, cells were fixed and treated with M2 antibody, as described in the Materials and Methods section. Upper and lower panels: contrast phase and fluorescence images. Staining of plasma membranes was indicated by arrows, mainly at cell–cell interactions. (b) Average percent reduction in Ca2+ oscillation frequency in a 15‐min period obtained after transient transfection with the mouse PC1 expressing plasmid of HEK293pSsiPKD1 clone b3 (red bars; n = 122 cells, five experiments) and HEK293pSUPER cells (blue bars, n = 60, three experiments). (c) Reduction in cell proliferation in HEK293 cells stably expressing the full length mouse PC1. pCDNA3 stably transfected control cells (white bar) and cells stably transfected with the full length mouse PKD1 cDNA plasmid (grey bar) were grown for 3 days in presence of 1% FBS. Data are expressed as the average values (± SD; *P < 0.05 unpaired Student's t‐test) obtained from two control and four PC1‐transfected clones that were plated as described in the Materials and Methods section.
Calcium oscillation increases in human PC1‐deficient cystic cells
Enhancement of proliferation by PKD1 RNA interference suggests that HEK293pSsiPKD1 cells behave in a similar fashion to ADPKD cyst cells, and an increase in cell proliferation and frequency of Ca2+ oscillations in cells derived from PKD1 cysts was therefore expected. In order to test this hypothesis immortalized cell lines from kidney cysts, which are heterozygous and putatively hemizygous for the Q2556X PKD1 mutation (Nauli et al. 2006), were analysed and results were compared to those obtained with PKD1 wild‐type non‐cystic cells.
After 1% FBS treatment for 24 h, cell cycle analysis showed that S and G2/M phases in hemizygous and heterozygous PC1‐mutant cystic cells were higher than in wild‐type cells, thereby demonstrating a higher proliferation rate of the cystic cells (Fig. 4a). Consistently in these cells, FBS‐evoked Ca2+ oscillations were increased (Fig. 4b). In particular, average oscillation frequency over a 15‐min period was 9.35 ± 1.36 and 7.36 ± 1.16 in cystic versus 3.904 ± 0.04 in normal cells (P < 0.05, wild‐type versus either hemizygous or heterozygous cells) (bars in Fig. 4b).
Figure 4.
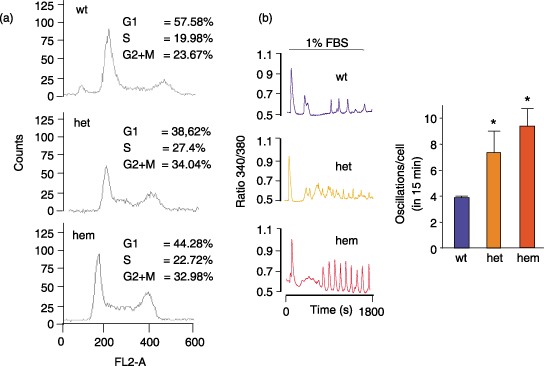
Immortalized cyst‐lining cells derived from a human kidney with a PKD1 mutation have increased cell proliferation and Ca2+ oscillations. (a) Cell cycle analysis in cystic cells, heterozygous (het) and hemizygous (hem) for the Q2556X PKD1 mutation (Nauli et al. 2006) showed an increase in S and G2/M phases compared to normal kidney cells (wt). After 24 h culture in 1% FBS, cells were analysed with propidium iodide staining as described in the Materials and Methods section. (b) Kidney normal (wt) and cystic (het and hem) cells were plated on coverslips 1 day before Ca2+ imaging experiments, starved in BSA and loaded with Fura‐2‐AM as described in the Materials and Methods section. During the experiment, cells were stimulated with 1% FBS and, after the initial Ca2+ transient, oscillations were analysed. Representative Ca2+ oscillation patterns from individual cells are shown. The average oscillation frequency (± SD) in 15 min is indicated by bars (wt, n = 56; het, n = 83; hem, n = 51 cells, in three experiments, *P < 0.05 unpaired Student's t‐test, wt versus hem and versus het).
Inhibitors of NCCE blunt both increased oscillation and cell proliferation
In order to ascertain the type of channel involved in the increase in FBS‐evoked Ca2+ oscillations in HEK293pSsiPKD1 clones, Ca2+ influx was evaluated in the presence of inhibitors of CCE and NCCE (Berridge 2002) (Fig. 5a). The frequency of FBS‐evoked Ca2+ oscillations in HEK293pSsiPKD1 remained unaffected by the presence of 1 µm Gd3+, sufficient to block CCE (Mignen et al. 2003a). However, oscillations were markedly affected by 5 µm Gd3+, which also completely inhibits NCCE (Mignen et al. 2003a), in both HEK293pSsiPKD1 and HEK293pSUPER control cells. Interestingly, treatment with 100 nm SKF96365, a putative inhibitor of receptor‐operated Ca2+ entry with NCCE blocker activity at this low concentration (Moneer et al. 2003), provoked markedly greater reduction in oscillation frequency in HEK293pSsiPKD1 more than in HEK293pSUPER cells. In particular, treatment of HEK293pSUPER cells with either 1 µm Gd3+ or 100 nm SKF96365 caused a 38% or 50% reduction in Ca2+ oscillations, respectively; conversely, in HEK293pSsiPKD1 cells, 1 µm Gd3+ did not affect Ca2+ oscillations, while SKF96365 caused an 82% reduction (see percentage values in Fig. 5). Ca2+ oscillations were also reduced by 2.5 times in HEK293pSsiPKD1 (64%) than in HEK293pSUPER (25%) by treatment with 30 µm LOE908, another NCCE blocker (Moneer & Taylor 2002) (data not shown), suggesting involvement of NCCE activity in abnormal Ca2+ oscillations seen in PC1‐deficient cells.
Figure 5.
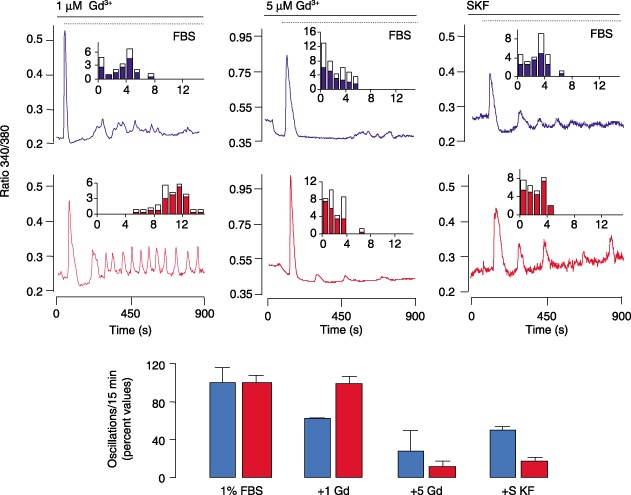
NCCE‐specific inhibitors blunt the effect of the PKD1 gene silencing or PKD1 nonsense mutation on FBS‐induced increase in Ca2+ oscillations. Effect of gadolinium (Gd3+) and SKF96365 on Ca2+ oscillation frequency. Representative Ca2+ traces from individual HEK293pSUPER (blue lines) and HEK293pSsiPKD1 cells (red lines) loaded with Fura‐2‐AM and treated with the indicated blocker and 1% FBS, are shown. The 1 µm Gd3+ did not affect Ca2+ oscillations activated by 1% FBS in HEK293pSsiPKD1 cells; 5 µm Gd3+ and 100 nm SKF96365 markedly reduced Ca2+ oscillations. Inset bars represent the average distribution of Ca2+ oscillation frequency (± SD) from HEK293pSUPER cells (1 µm Gd3+: n = 45 cells; 5 µm Gd3+: n = 50 cells; 100 nm SKF96365: n = 52 cells) and from HEK293pSsiPKD1 cells (1 µm Gd3+: n = 54 cells; 5 µm Gd3+: n = 42 cells; 100 nm SKF96365: n = 49 cells) in a 15‐min period after FBS stimulation. Results are representative of three independent experiments. Blue and red bars represent percentage reductions (± SD) produced by each treatment in HEK293pSUPER (blue) and HEK293pSsiPKD1 cells (red) compared to untreated cells.
Consistently with the results on Ca2+ oscillations, 5 µm Gd3+, but not 1 µm Gd3+, 100 nm SKF96365 and 30 µm LOE908 markedly reduced the FBS‐induced cell proliferation in HEK293pSsiPKD1 clones (Fig. 6a). As shown in the summary graph of Fig. 6a (showing percentage values), reductions in proliferation caused by different treatments highlighted the strong inhibition caused by NCCE blockers in HEK293pSsiPKD1 cell proliferation (67% to 61%), in comparison to the effect in control cells, which was observed to be four times lower (15%).
Figure 6.
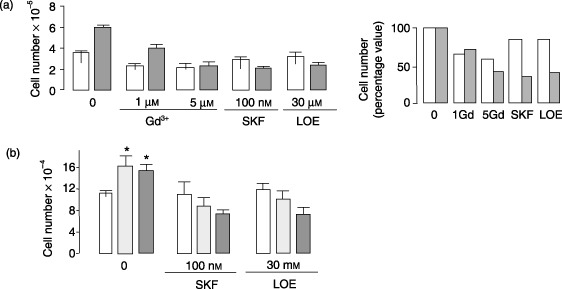
NCCE‐specific inhibitors blunt the effect of the PKD1 gene silencing or PKD1 nonsense mutation on FBS‐induced increase in cell proliferation. (a) The 5 µm Gd3+, 100 nm SKF96365 and 30 µm LOE908 inhibitors markedly inhibited the FBS‐induced increase in cell proliferation of HEK293pSsiPKD1 cells (grey bars) compared to HEK293pSUPER cells (white bars), while 1 µm Gd3+ affected to a lesser extent HEK293pSsiPKD1 cells. Cells were counted after 48 h culture in 1% FBS, in the absence or presence of the inhibitor. Results obtained in four independent experiments with different clones are shown as means ± SD. In the bar graph (on the right), the blocker effects are expressed in terms of percentage proliferation of untreated cells. (b) Inhibitory effect of NCCE blockers on cell proliferation of cystic kidney cell lines. Cells were treated as reported for HEK293 cells in (a). Only cystic cell proliferation was inhibited by the treatment with the NCCE blockers. Bars represent mean values (± SEM) of three (for SKF96365) and two (for LOE908) independent experiments (*P < 0.05 unpaired Student's t‐test) with cells obtained from non‐cystic kidney (white), from kidney cysts heterozygous for the Q2556X mutation (light grey) and hemizygous for the same mutation (dark grey).
In order to confirm inhibition also in cyst‐derived cells, the effects of NCCE channel blockers were examined in PKD1 Q2556X‐mutated cell lines. As expected, cell proliferation was higher in cystic cells than in wild‐type cells (152 888.6 ± 18 151 and 130 553.3 ± 10 210 versus 105 777.5 ± 4337, in heterozygous and hemizygous versus wild‐type cells, P < 0.05) (Fig. 6b). Treatment with either 100 nm SKF96365 or 30 µm LOE908 NCCE blockers did not modify proliferation of wild‐type cells, although it did reduce that of PKD1 heterozygous and hemizygous cells (Fig. 6b). Overall, these results confirm the association between abnormal increase in Ca2+ oscillations and cell proliferation in ADPKD tubular cells, ascribing the regulatory effect of PC1 mainly to NCCE.
Increase in NFAT activity in HEK293pSsiPKD1 cells is associated with cell proliferation
It has been reported that oscillations are an efficient way of differentially coding Ca2+ signals and that frequency of oscillations may modulate gene transcription (Dolmetsch et al. 1998). NFAT is a Ca2+‐dependent transcription factor expressed in many cells, including those of the kidney (Puri et al. 2004), which is regulated by frequency of Ca2+ oscillations (Tomida et al. 2003). We, therefore, investigated whether the FBS‐induced oscillations observed in HEK293 PKD1‐suppressed cells affected NFAT signalling. We monitored NFAT translocation to the nucleus in HEK293pSUPER and HEK293pSsiPKD1 cells expressing a GFP‐tagged NFAT2. Prior to FBS treatment (0 min of Fig. 7a, left), NFAT‐GFP was present in cytoplasmic regions of both HEK293pSsiPKD1 and HEK293pSUPER cells, whereas its nuclear translocation following 1% FBS treatment was clearly faster in HEK293pSsiPKD1 than in HEK293pSUPER cells. Thus, Ca2+ oscillations induced rapid and constant NFAT nuclear translocation in HEK293pSsiPKD1. This faster activation was also observed in PC1‐mutant cystic cells (Fig. 7a, right). Moreover, HEK293 cells were transiently transfected with an NFAT‐promoter luciferase‐reporter plasmid, and luciferase activity was assessed after FBS treatment. Following 2 days of stimulation, ∼3.5‐fold increase in luciferase activity in HEK293pSsiPKD1 cells as compared to HEK293pSUPER cells was observed (Fig. 7b). This suggests that gene expression is modulated by the effect of PC1 depletion on the oscillatory pattern of Ca2+ responses and is further supported by the observation that SKF96365 treatment, which blocked HEK293pSsiPKD1 cell proliferation, also reduced the NFAT‐dependent luciferase activity (Fig. 7c).
Figure 7.
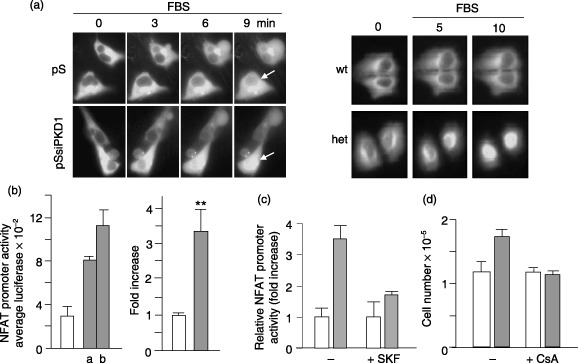
NFAT mediates the cell proliferation increase caused by PKD1 gene silencing and mutation. (a) The fluorescence images of representative cells transfected with NFAT‐GFP construct show the distribution of the NFAT‐GFP at various time points before and after exposure to 1% FBS. The calcineurin‐dependent nuclear translocation of NFAT occurred faster in HEK293pSsiPKD1 (pSsiPKD1) and heterozygous (het) cells than in HEK293pSUPER (pS) and in normal kidney (wt) control cells. Arrows show the marked difference in nuclear translocation between silenced and control cells. Pictures are representative of four different experiments. (b) NFAT‐dependent transcription was increased by gene silencing of PC1. HEK293pSsiPKD1 and control cells were transfected with an NFAT‐dependent luciferase reporter plasmid. Cell extracts were collected after 20 h of 1% FBS treatment. Results of luciferase assays from a representative experiment are shown (HEK293pSsiPKD1 clone a1 and b3, grey bars; HEK293pSUPER control cells, white bar). Results obtained are expressed as fold activation over the luciferase units displayed by control cells. The data are the means ± SEM of five independent experiments (**P < 0.01 paired Student's t‐test). (c) Inhibitory effect of 100 nm SKF96365 on luciferase promoter activity in HEK293pSsiPKD1 (grey bars) and HEK293pSUPER control cells (white bars). Cells were transfected with an NFAT‐dependent luciferase reporter plasmid and results of three independent experiments are expressed as average fold increase in untreated and SKF96365‐treated cells. (d) The calcineurin inhibitor Cyclosporin A (CsA) blunted the FBS‐induced increase in cell proliferation of HEK293pSsiPKD1 cells. Cells were counted after 2 days of culture in 1% FBS. CsA (100 ng/mL) was present or absent as indicated. Results obtained in a triplicate experiment are shown as means ± SD and are representative of four independent experiments obtained from different clones.
In order to test whether the FBS‐induced NFAT activation contributed to the increase in proliferation of HEK293pSsiPKD1 cells, the cell proliferation rate was analysed in the presence of cyclosporin A (CsA), a typical inhibitor of the Ca2+‐calmodulin‐dependent serine/threonine protein phosphatase calcineurin, which dephosphorylates and activates NFAT (Puri et al. 2004). FBS‐induced increase in HEK293pSsiPKD1 cell proliferation was completely inhibited by CsA (Fig. 7d), supporting the hypothesis of a relationship between the reduction in PC1 levels and increase in both Ca2+ oscillations and NFAT‐dependent cell proliferation in HEK293pSsiPKD1 cells.
Cytoplasmic Ca2+ levels and PKC‐α activity
Over all, these data suggest a model in which the impairment of PC1 signalling in PC1‐deficient cells leads to elevation of serum‐evoked Ca2+ oscillations, thus activating calcineurin and NFAT signalling and leading ultimately to cell proliferation. This hypothesis is further supported by the measurement of basal Ca2+ levels which, in the absence of serum, are higher in HEK293pSsiPKD1 than in control cells (140.78 ± 27.4 versus 85.92 ± 8.19, respectively). This is consistent with basal Ca2+ levels observed in HEK293 cells expressing the isolated cytoplasmic carboxyl terminus of PC1 (Manzati et al. 2005). As observed for glutamate‐induced intracellular Ca2+ oscillations in astrocytes, which involve activation of conventional PKC (Codazzi et al. 2001), only serum‐induced Ca2+ oscillations lead to Ca2+ levels sufficient to activate the calcium‐dependent PKC‐α isoform (Fig. 8a). Serum treatment was indeed accompanied by a prominent recovery of PKC‐α‐GFP fluorescence in the membrane compartments of HEK293pSsiPKD1 cells, while diffuse fluorescence in control cells indicated that the kinase remains confined to cytoplasm.
Figure 8.
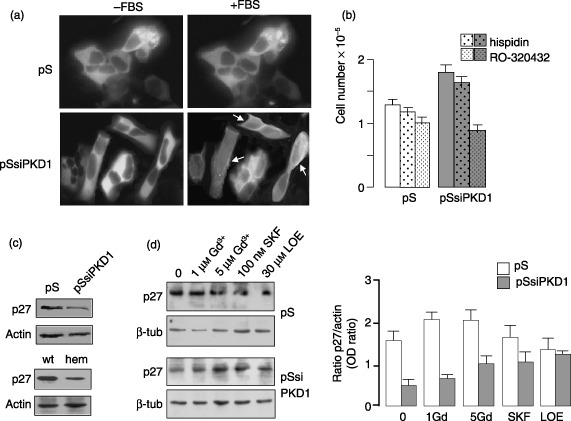
PKD1 gene silencing‐dependent cell proliferation is associated to PKC‐α activation and reduction of p27Kip1 in HEK293 cells. (a) The calcium‐dependent membrane translocation of PKC‐α occurred in serum treated HEK293pSsiPKD1 (pSsiPKD1), but not in control cells (pS). Fluorescence images of cells expressing a PKC‐α‐GFP construct show that the PKC‐α partly translocates to the plasma membrane after 10 min exposure to 1% serum, while control cells maintain a cytoplasm diffuse staining. Arrows indicate the membrane fluorescence. Pictures are representative of three different experiments. (b) The PKC‐α‐specific inhibition blunted the serum‐induced increase in proliferation of HEK293pSsiPKD1. Cells were counted after 48 h culture in 1% FBS in the absence or presence of either a PKC‐β‐specific (hispidin, 5 µm) or PKC‐α‐specific inhibitor (Ro320432, 10 µm). Results obtained in a triplicate experiment are shown as means ± SD and are representative of three independent experiments. (c) Whole cell lysates of HEK293pSsiPKD1, HEK293pSUPER cells (upper panel) and of non cystic (wt) and cystic PKD1 Q2556X hemizygous cells (hem) (lower panel), were analysed by immunoblot for expression levels of p27Kip1. The levels were normalized for the expression of actin housekeeping gene. (d) Immunoblot of total lysates of HEK293pSUPER and HEK293pSsiPKD1 cells after 24 h treatment with CCE and NCCE blockers. NCCE inhibitors (100 nm SKF96365 and 30 µm LOE908) markedly increased p27Kip1 expression only in HEK293pSsiPKD1 cells. Bar graph shows that p27Kip1 expression (grey bars) is increased of more than twice in HEK293pSsiPKD1 cells by NCCE inhibitors, but remains unchanged in HEK293pSUPER cells. Results have been obtained in two independent experiments and expressed as means ± SD.
Because the PKC‐α‐specific inhibitor Ro‐320432, and not the PKC‐β inhibitor hispidin, markedly reduced growth of HEK293pSsiPKD1 cell population (Fig. 8b); cell proliferation increase was also shown to be dependent on a PKC‐α pathway. As we previously observed in HEK293 cells expressing the PC1 C‐terminal tail (Manzati et al. 2005), in HEK293pSsiPKD1 cells this increase was also accompanied by a marked reduction of the growth inhibitory protein p27Kip1 (Fig. 8c, upper part). Consistently, p27Kip1 was similarly reduced in PKD1 Q2556X‐mutated hemizygous cystic cells (Fig. 8c, lower part). Moreover, treatment of HEK293pSsiPKD1 cells with either 5 µm Gd3+, 100 nm SKF96365 or 30 µm LOE908, which reduces cell proliferation, led to increased p27 levels (Fig. 8d).
The present findings, therefore, provide evidence that lack of balance in PC1 levels caused by a reduction in wild‐type protein, as well as by PC1 C‐tail overexpression, plays a critical role for Ca2+ signalling pathways with similar effects on gene expression and subsequently on cell cycle regulation.
DISCUSSION
Our study demonstrates for the first time that PC1 controls Ca2+ oscillations and provides a molecular mechanism to explain association of abnormal Ca2+ homeostasis and increased cell proliferation in ADPKD, caused by PKD1 mutations. We have shown that either inhibition of PC1 expression by RNA interference in HEK293 cells or loss of PC1 expression in ADPKD kidney cystic cells increases oscillatory activity of cytoplasmic Ca2+, evoked by low serum concentrations. Consistently, we have also found that expression of exogenous PC1 reduces the frequency of serum‐evoked Ca2+ oscillations not only in PC1‐deficient HEK293pSsiPKD1 cells, but also in HEK293 control cells. The main conclusion of this study is therefore that PC1 is required for negative control of Ca2+ oscillation in kidney‐derived cells. The implication is that PC1 exerts a profound influence on Ca2+ signalling by controlling Ca2+ oscillation induced by serum, with a crucial role in cell proliferation. Cell growth studies have shown that cell proliferation in PC1‐deficient HEK293 cells is inversely related to the level of PC1 expression which, in turn, is inversely related to the Ca2+ oscillation frequency.
Ca2+ oscillation and cell proliferation
Intracellular Ca2+ homeostasis appears to be altered in HEK293pSsiPKD1 cells with basal Ca2+ levels higher than those of controls. Increased Ca2+ levels have already been observed in the HEK293 cells expressing the dominant negative PC1 C‐terminus (Puri et al. 2004; Manzati et al. 2005). These results therefore indicate that loss of PC1 function may be associated with increase in basal Ca2+ levels, which may contribute to increased proliferation of these cells. This hypothesis is also supported by the observation that overexpression of TRPV6 slightly increases intracellular Ca2+ levels and Ca2+‐dependent proliferation of HEK293 cells (Schwarz et al. 2006). However, in primary cultures of ADPKD cystic cells reduction in basal Ca2+ levels has been documented, imputing abnormal proliferation of cystic cells to this alteration (Yamaguchi et al. 2006). Even though characterization of molecular lesions in primary ADPKD cultures has not been reported, these differences in basal Ca2+ levels may be related to the different type of cell culture. Nevertheless, in the light of these contrasting results it is difficult to explain the PKD‐dependent abnormal proliferation with abnormal basal Ca2+ levels.
Interestingly, in HEK293pSsiPKD1 cells, serum treatment that increased cell proliferation, did not produce a significant increase in evoked Ca2+ levels (Fig. 2a), but rather a clear change (2‐fold statistically significant increase) in frequency of FBS‐induced Ca2+ oscillations. Notably, frequency of Ca2+ oscillation is also increased in cystic cells either heterozygous or hemizygous for the Q2556X PKD1. Because both cystic cell lines show increased FBS‐evoked Ca2+ oscillations, these may be a cause of aberrant proliferation in these cells as well as in HEK293pSsiPKD1 cells. It must, however, be considered that the present study was performed in immortalized cells. Although these are derived from normal and cyst‐lining epithelia and maintain many features of tubule of origin, immortalized cells are poorly differentiated and polarized, particularly when cultured under subconfluent conditions such as those used for a proliferation study. Therefore, the precise role of abnormal Ca2+ oscillations on cyst formation and cell population growth in the kidney remains to be ascertained.
The finding that HEK293 cells expressing mouse PC1 showed reductions in both Ca2+ oscillation and cell proliferation, provides evidence for the role of Ca2+ oscillations in the PC1‐dependent control of cell proliferation. In the light of these observations therefore growth suppression activity of PC1 may be explained by its inhibitory action on Ca2+ oscillations as was observed in both normal and HEK293pSsiPKD1 cells exogenously expressing the mouse PC1.
Ca2+ channel activity and cell proliferation
Ca2+ entry that supports [Ca2+]i cycling, predominantly occurs through store‐operated or a CCE pathway (Bird & Putney 2005). Nevertheless, in many cell types, including HEK293 cells, extracellular Ca2+ entry and Ca2+ oscillations also result from NCCE, whose activation is independent of store depletion (Mignen et al. 2001).
Non‐capacitative Ca2+ entry activity appears to be crucial for HEK293pSsiPKD1 cell proliferation. Ca2+ oscillations in HEK293pSsiPKD1 cells are insensitive to 1 µm Gd3+, but markedly inhibited by the NCCE blocker, which also inhibited cell proliferation. Moreover, in the absence of external Ca2+, no difference was observed in 1% evoked Ca2+ oscillations between HEK293pSsiPKD1 and HEK293pSUPER control cells (3.34 ± 0.31 versus 2.58 ± 0.9 oscillations in 15 min/cell, respectively), consistently with a role of NCCE activity on the oscillation increase. Therefore, the PC1 loss leads to deregulation of the NCCE pathway, strongly associating increased Ca2+ oscillations and proliferation to abnormal activity of NCCE channels. Consistently, both SKF96365 and LOE908 are able to reduce proliferation in PKD1‐mutated heterozygous and hemizygous cystic cells, but not wild‐type kidney tubule cells. Ca2+ influx through NCCE channels is therefore necessary for the increased [Ca2+]i oscillatory response and cell proliferation in PC1‐deficient cells.
On the basis of these considerations, we hypothesize that PC1 controls an as yet uninvestigated activity of NCCE channels. In HEK293 cells, NCCE has been shown to be associated to the activity of the arachidonate‐regulated Ca2+ channel (ARC channel) (Mignen et al. 2003a), but because we have observed that calcineurin activity is required for the FBS‐induced proliferation increase in HEK293pSsiPKD1 cells (Fig. 7d), and because ARC channels are turned off by calcineurin activation (Mignen et al. 2003b), these channels do not seem to be the target of the PC1 control. On the other hand, an arachidonate‐activated NCCE channel activity, which displays biophysical properties different from the ARC channels of HEK293 cells, has been reported in endothelial cells (Fiorio Pla & Munaron 2001). Interestingly, this NCCE activity is required for the promotion of cell proliferation activated by peptidic growth factors like the basic fibroblast growth factor (Fiorio Pla & Munaron 2001). This NCCE activity is also involved in peripheral and localized Ca2+ events, probably leading to the involvement of differential patterns of Ca2+‐dependent proteins and genes (Tomatis et al. 2007), including calcineurin and PKC pathways, abnormally activated in HEK293pSsiPKD1 cells. This activity may lead, in addition to increased cell proliferation, to the abnormal polarity, migration and apoptosis typically observed in ADPKD cystic cells (Ong & Harris 2005).
Ca2+ oscillations and signalling
The results of our studies suggest that a loss of PC1 in HEK293pSsiPKD1 cells promotes a serum‐induced proliferation increase by inducing Ca2+ entry and subsequent activation of the calcineurin/NFAT pathway. As reported in other cell types (Lipskaia & Lompre 2004), NFAT activation in HEK293pSsiPKD1 cells promotes cell cycle progression in association with a reduction in the activity of cyclin kinase inhibitors. Consistently, cyclosporin A treatment, which, by inhibiting calcineurin, inhibits NFAT dephosphorylation and its nuclear translocation (Hogan et al. 2003), blocks the PC1‐dependent increase in proliferation (Fig. 7d). Here, we also show that once NCCE‐mediated Ca2+ entry is blocked by SKF96365 treatment in HEK293pSsiPKD1 cells, NFAT activation is markedly reduced. Thus, as previously demonstrated in other cell types (Dolmetsch et al. 1998; Tomida et al. 2003), activation of NFAT in HEK293pSsiPKD1 appears to be linked to increase in Ca2+ oscillation, possibly accompanied by the release of Ca2+ from intracellular stores and activation of store‐operated Ca2+ entry, as proposed in cells expressing the PC1 C‐terminus (Puri et al. 2004). Because this peptide appears to act as a dominant negative (Manzati et al. 2005; Xu et al. 2007), NFAT activation in these cells is consistent with that found in HEKpSsiPKD1 cells. HEK293pSsiPKD1 cell proliferation requires PKC‐α activation and p27 down‐regulation (see Fig. 8), as in cells expressing the PC1 C‐terminus that show reduced levels of both p27Kip and p21Waf associated to increased cell proliferation (Manzati et al. 2005). This observation is consistent with previous findings showing that exogenous expression of full‐length PC1 in kidney cells induces cell cycle arrest in G0/G1 by up‐regulating p21Waf expression through the JAK‐STAT pathway (Bhunia et al. 2002). It has also been reported that calcineurin and NFAT activity is required in keratinocytes for the expression of p21 and p27, which contribute to growth arrest of these cells (Santini et al. 2001). This supports the postulated cross‐talk between calcineurin, p21 and p27. In HEK293pSsiPKD1, this cross‐talk may either be misfunctional or p27 gene down‐regulation may result by one or more different Ca2+‐dependent signalling pathways activated by PC1 depletion (see Fig. 8).
Furthermore, the association between PKC‐α membrane translocation and Ca2+ oscillation is consistent with the activation of PKC by glutamate‐induced Ca2+ waves in astrocytes (Codazzi et al. 2001).
Because NFAT nuclear translocation occurs in HEK293pSsiPKD1 and control cells only after serum treatment, the role of basal Ca2+ again appears to be irrelevant in the proliferation increase of PC1‐deficient cells, while the role of Ca2+ oscillations appears to be crucial. These results provide new insight into the molecular and physiological mechanism of Ca2+ oscillations in PKD1‐like kidney cells and in promoting NFAT‐dependent kidney cell proliferation.
In summary, our results establish that the molecular suppression of endogenous PC1 in HEK293 cells and PKD1 cystic cells leads to abnormal Ca2+ oscillations and has a profound influence on Ca2+ signalling and cell proliferation, as illustrated in Fig. 9. At present, it is impossible to say how many steps may lie between PC1 and the NCCE channel. Because PC1 has been implicated in gene expression control by activating a variety of transcription factors including the NFAT investigated here, NCCE modulation may result from changes in gene expression, or in post‐translational modification (Li et al. 2005). Moreover, either a direct or indirect interaction between PC1 and NCCE channel may exist. PC1 may, in fact, constitute Ca2+‐permeable channel activities either by interacting with PC2 in the PC1/PC2 receptor‐ion channel (Hanaoka et al. 2000), or independently of PC2 (Babich et al. 2004).
Figure 9.
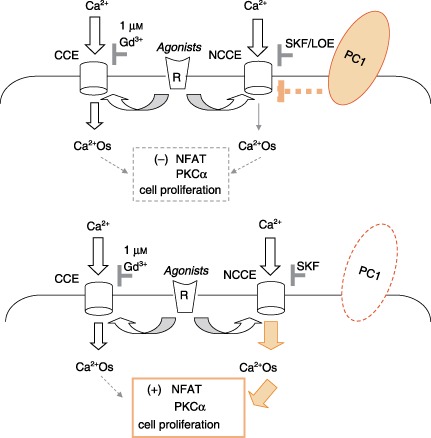
A hypothetical model illustrating the role of PC1 on the agonist‐evoked NCCE channel activity and effects of Ca2+ oscillations (Ca2+Os) on NFAT pathway and cell proliferation. In HEK293pSUPER and tubular kidney control cells, PC1 negatively modulates NCCE activity through a still undefined direct or indirect mechanism (dotted bar); Ca2+ oscillations are dependent on both CCE and NCCE activities as shown by comparable inhibitory effects of 1 µm Gd3+ and SKF96365 on Ca2+ oscillations and cell proliferation (5, 6). Loss of PC1 function causes an increase in NCCE channel activity and in Ca2+ oscillations thus leading to an increase in Ca2+‐dependent NFAT activation and cell proliferation.
In conclusion, our findings suggest that PC1 may function as a controller of Ca2+ release in response to extracellular stimuli also through the NCCE pathway, thus regulating the Ca2+‐mediated signal transduction involved in cell proliferation through the NFAT pathway. Moreover, because NCCE channel blockers may reduce the PC1 suppression‐dependent [Ca2+]i oscillation as well as cell proliferation, these channels could be potential therapeutic targets for treatment of the abnormalities observed in cystic cells.
ACKNOWLEDGEMENTS
We thank Dr. A.L. Armesilla (University of Manchester) and Dr. E. Olson (South‐western University, Dallas, TX, USA) for providing NFAT promoter‐luciferase reporter and GFP‐tagged NFAT2 plasmids, respectively, Consugar M. (Mayo Clinic, Rochester, MN, USA) for PKD1‐mutated cell line cultures, and Anna Foster for correcting the manuscript. LOE908 was a kind gift from Boehringer Ingelheim Pharma GmbH & Co. KG (Biberach, Germany). This work was supported by grants from Italian Telethon GTF01011, Italian MIUR COFIN 2002, FIRB 2005, Cassa di Risparmio di Ferrara, Local University Funds, and the Italian Association for Cancer Research.
Re‐use of this article is permitted in accordance with the Creative Commons Deed, Attribution 2·5, which does not permit commercial exploitation.
REFERENCES
- Aguiari G, Piva R, Manzati E, Mazzoni E, Augello G, Chiari E, Moretti S, Neri LM, Del Senno L (1998) K562 erythroid and HL60 macrophage differentiation downregulates polycystin, a large membrane‐associated protein. Exp. Cell Res. 244, 259–267. [DOI] [PubMed] [Google Scholar]
- Aguiari G, Campanella M, Manzati E, Pinton P, Banzi M, Moretti S, Piva R, Rizzuto R, Del Senno L (2003) Expression of polycystin‐1 C‐terminal fragment enhances the ATP‐induced Ca2+ release in human kidney cells. Biochem. Biophys. Res. Commun. 301, 657–664. [DOI] [PubMed] [Google Scholar]
- Aguiari G, Banzi M, Gessi S, Cai Y, Zeggio E, Manzati E, Piva R, Lambertini E, Ferrari L, Peters DJ, Lanza F, Harris PC, Borea PA, Somlo S, Del Senno L (2004) Deficiency of polycystin‐2 reduces Ca2+ channel activity and cell proliferation in ADPKD lymphoblastoid cells. FASEB J. 18, 884–886. [DOI] [PubMed] [Google Scholar]
- Babich V, Zeng WZ, Yeh BI, Ibraghimov‐Beskrovnaya O, Cai Y, Somlo S, Huang CL (2004) The N‐terminal extracellular domain is required for polycystin‐1‐dependent channel activity. J. Biol. Chem. 279, 25582–25589. [DOI] [PubMed] [Google Scholar]
- Berridge MJ (2002) The endoplasmic reticulum: a multifunctional signaling organelle. Cell Calcium 32, 235–249. [DOI] [PubMed] [Google Scholar]
- Berridge MJ, Lipp P, Bootman MD (2000) The versatility and universality of calcium signalling. Nat. Rev. Mol. Cell Biol. 1, 11–21. [DOI] [PubMed] [Google Scholar]
- Bhunia AK, Piontek K, Boletta A, Liu L, Qian F, Xu PN, Germino FJ, Germino GG (2002) PKD1 induces p21 (waf1) and regulation of the cell cycle via direct activation of the JAK‐STAT signaling pathway in a process requiring PKD2. Cell 109, 157–168. [DOI] [PubMed] [Google Scholar]
- Bird GS, Putney JW Jr (2005) Capacitative calcium entry supports calcium oscillations in human embryonic kidney cells. J. Physiol. 562, 697–706. [DOI] [PMC free article] [PubMed] [Google Scholar]
- Boca M, Distefano G, Qian F, Bhunia AK, Germino GG, Boletta A (2006) Polycystin‐1 induces resistance to apoptosis through the phosphatidylinositol 3‐kinase/Akt signaling pathway. J. Am. Soc. Nephrol. 17, 637–647. [DOI] [PMC free article] [PubMed] [Google Scholar]
- Brummelkamp TR, Bernards R, Agami R (2002) A system for stable expression of short interfering RNAs in mammalian cells. Science 296, 550–553. [DOI] [PubMed] [Google Scholar]
- Codazzi F, Teruel MN, Meyer T (2001) Control of astrocyte Ca2+ oscillations and waves by oscillating translocation and activation of protein kinase C. Curr. Biol. 11, 1089–1097. [DOI] [PubMed] [Google Scholar]
- Delmas P (2004) Polycystins: from mechanosensation to gene regulation. Cell 118, 145–148. [DOI] [PubMed] [Google Scholar]
- Delmas P, Nomura H, Li X, Lakkis M, Luo Y, Segal Y, Fernandez‐Fernandez JM, Harris P, Frischauf AM, Brown DA, Zhou J (2002) Constitutive activation of G‐proteins by polycystin‐1 is antagonized by polycystin‐2. J. Biol. Chem. 277, 11276–11283. [DOI] [PubMed] [Google Scholar]
- Dolmetsch RE, Xu K, Lewis RS (1998) Calcium oscillations increase the efficiency and specificity of gene expression. Nature 392, 933–936. [DOI] [PubMed] [Google Scholar]
- Fiorio Pla A, Munaron L (2001) Calcium influx, arachidonic acid, and control of endothelial cell proliferation. Cell Calcium 30, 235–244. [DOI] [PubMed] [Google Scholar]
- Gabow PA (1990) Autosomal dominant polycystic kidney disease – more than a renal disease. Am. J. Kidney Dis. 16, 403–413. [DOI] [PubMed] [Google Scholar]
- González‐Perrett S, Kim K, Ibarra C, Damiano AE, Zotta E, Batelli M, Harris PC, Reisin IL, Arnaout MA, Cantiello HF (2001) Polycystin‐2, the protein mutated in autosomal dominant polycystic kidney disease (ADPKD), is a Ca2+‐permeable nonselective cation channel. Proc. Natl. Acad. Sci. USA 98, 1182–1187. [DOI] [PMC free article] [PubMed] [Google Scholar]
- Grimm DH, Cai Y, Chauvet V, Rajendran V, Zeltner R, Geng L, Avner ED, Sweeney W, Somlo S, Caplan MJ (2003) Polycystin‐1 distribution is modulated by polycystin‐2 expression in mammalian cells. J. Biol. Chem. 278, 36786–36793. [DOI] [PubMed] [Google Scholar]
- Hanaoka K, Qian F, Boletta A, Bhunia AK, Piontek K, Tsiokas L, Sukhatme VP, Guggino WB, Germino GG (2000) Co‐assembly of polycystin‐1 and ‐2 produces unique cation‐permeable currents. Nature 408, 990–994. [DOI] [PubMed] [Google Scholar]
- Harris PC (1999) Autosomal dominant polycystic kidney disease: clues to pathogenesis. Hum. Mol. Genet. 8, 1861–1866. [DOI] [PubMed] [Google Scholar]
- Hogan PG, Chen L, Nardone J, Rao A (2003) Transcriptional regulation by calcium, calcineurin, and NFAT. Genes Dev. 17, 2205–2232. [DOI] [PubMed] [Google Scholar]
- Kim H, Bae Y, Jeong W, Ahn C, Kang S (2004) Depletion of PKD1 by antisense oligodeoxynucleotide induces premature G1/S‐phase transition. Eur. J. Hum. Genet. 12, 433–440. [DOI] [PubMed] [Google Scholar]
- Koulen P, Cai Y, Geng L, Maeda Y, Nishimura S, Witzgall R, Ehrlich BE, Somlo S (2002) Polycystin‐2 is an intracellular calcium release channel. Nat. Cell Biol. 4, 191–197. [DOI] [PubMed] [Google Scholar]
- Li X, Luo Y, Starremans PG, McNamara CA, Pei Y, Zhou J (2005) Polycystin‐1 and polycystin‐2 regulate the cell cycle through the helix‐loop‐helix inhibitor Id2. Nat. Cell Biol. 7, 1202–1212. [DOI] [PubMed] [Google Scholar]
- Lipskaia L, Lompre AM (2004) Alteration in temporal kinetics of Ca2+ signaling and control of growth and proliferation. Biol. Cell 96, 55–68. [DOI] [PubMed] [Google Scholar]
- Manzati E, Aguiari G, Banzi M, Manzati M, Selvatici R, Falzarano S, Maestri I, Pinton P, Rizzuto R, Del Senno L (2005) The cytoplasmic C‐terminus of polycystin‐1 increases cell proliferation in kidney epithelial cells through serum‐activated and Ca2+‐dependent pathway(s). Exp. Cell Res. 304, 391–406. [DOI] [PubMed] [Google Scholar]
- Mignen O, Thompson JL, Shuttleworth TJ (2001) Reciprocal regulation of capacitative and arachidonate‐regulated noncapacitative Ca2+ entry pathways. J. Biol. Chem. 276, 35676–35683. [DOI] [PubMed] [Google Scholar]
- Mignen O, Thompson JL, Shuttleworth TJ (2003a) Ca2+ selectivity and fatty acid specificity of the noncapacitative, arachidonate‐regulated Ca2+ (ARC) channels. J. Biol. Chem. 278, 10174–10181. [DOI] [PubMed] [Google Scholar]
- Mignen O, Thompson JL, Shuttleworth TJ (2003b) Calcineurin directs the reciprocal regulation of calcium entry pathways in nonexcitable cells. J. Biol. Chem. 278, 40088–40096. [DOI] [PubMed] [Google Scholar]
- Mochizuki T, Wu G, Hayashi T, Xenophontos SL, Veldhuisen B, Saris JJ, Reynolds DM, Cai Y, Gabow PA, Pierides A, Kimberling WJ, Breuning MH, Deltas CC, Peters DJ, Somlo S (1996) PKD2, a gene for polycystic kidney disease that encodes an integral membrane protein. Science 272, 1339–1342. [DOI] [PubMed] [Google Scholar]
- Moneer Z, Taylor CW (2002) Reciprocal regulation of capacitative and non‐capacitative Ca2+ entry in A7r5 vascular smooth muscle cells: only the latter operates during receptor activation. Biochem. J. 362, 13–21. [DOI] [PMC free article] [PubMed] [Google Scholar]
- Moneer Z, Dyer JL, Taylor CW (2003) Nitric oxide co‐ordinates the activities of the capacitative and non‐capacitative Ca2+‐entry pathways regulated by vasopressin. Biochem. J. 370, 439–448. [DOI] [PMC free article] [PubMed] [Google Scholar]
- Nauli SM, Rossetti S, Kolb RJ, Alenghat FJ, Consugar MB, Harris PC, Ingber DE, Loghman‐Adham M, Zhou J (2006) Loss of polycystin‐1 in human cyst‐lining epithelia leads to ciliary dysfunction. J. Am. Soc. Nephrol. 17, 1015–1025. [DOI] [PubMed] [Google Scholar]
- Nickel C, Benzing T, Sellin L, Gerke P, Karihaloo A, Liu ZX, Cantley LG, Walz G (2002) The polycystin‐1 C‐terminal fragment triggers branching morphogenesis and migration of tubular kidney epithelial cells. J. Clin. Invest. 109, 481–489. [DOI] [PMC free article] [PubMed] [Google Scholar]
- Ong AC, Harris PC (2005) Molecular pathogenesis of ADPKD: the polycystin complex gets complex. Kidney Int. 67, 1234–1247. [DOI] [PubMed] [Google Scholar]
- Parnell SC, Magenheimer BS, Maser RL, Rankin CA, Smine A, Okamoto T, Calvet JP (1998) The polycystic kidney disease‐1 protein, polycystin‐1, binds and activates heterotrimeric G‐proteins in vitro . Biochem. Biophys. Res. Commun. 251, 625–631. [DOI] [PubMed] [Google Scholar]
- Pelucchi B, Aguiari G, Pignatelli A, Manzati E, Witzgall R, Del Senno L, Belluzzi O (2006) Nonspecific cation current associated with native polycystin‐2 in HEK‐293 cells. J. Am. Soc. Nephrol. 17, 388–397. [DOI] [PubMed] [Google Scholar]
- Polgar K, Burrow CR, Hyink DP, Fernandez H, Thornton K, Li X, Gusella GL, Wilson PD (2005) Disruption of polycystin‐1 function interferes with branching morphogenesis of the ureteric bud in developing mouse kidneys. Dev. Biol. 286, 16–30. [DOI] [PubMed] [Google Scholar]
- Puri S, Magenheimer BS, Maser RL, Ryan EM, Zien CA, Walker DD, Wallace DP, Hempson SJ, Calvet JP (2004) Polycystin‐1 activates the calcineurin/NFAT (nuclear factor of activated T‐cells) signaling pathway. J. Biol. Chem. 279, 55455–55464. [DOI] [PubMed] [Google Scholar]
- Qian Q, Li M, Cai Y, Ward CJ, Somlo S, Harris PC, Torres VE (2003) Analysis of the polycystins in aortic vascular smooth muscle cells. J. Am. Soc. Nephrol. 14, 2280–2287. [DOI] [PubMed] [Google Scholar]
- Santini MP, Talora C, Seki T, Bolgan L, Dotto GP (2001) Cross talk among calcineurin, Sp1/Sp3, and NFAT in control of p21 (WAF1/CIP1) expression in keratinocyte differentiation. Proc. Natl. Acad. Sci. USA 98, 9575–9580. [DOI] [PMC free article] [PubMed] [Google Scholar]
- Schwarz EC, Wissenbach U, Niemeyer BA, Strauß B, Philipp SE, Flockerzi V, Hoth M (2006) TRPV6 potentiates calcium‐dependent cell proliferation. Cell Calcium 39, 163–173. [DOI] [PubMed] [Google Scholar]
- Tomatis C, Fiorio Pla A, Munaron L (2007) Cytosolic calcium microdomains by arachidonic acid and nitric oxide in endothelial cells. Cell Calcium 41, 261–269. [DOI] [PubMed] [Google Scholar]
- Tomida T, Hirose K, Takizawa A, Shibasaki F, Iino M (2003) NFAT functions as a working memory of Ca2+ signals in decoding Ca2+ oscillation. EMBO J. 22, 3825–3832. [DOI] [PMC free article] [PubMed] [Google Scholar]
- Vandorpe DH, Chernova MN, Jiang L, Sellin LK, Wilhelm S, Stuart‐Tilley AK, Walz G, Alper SL (2001) The cytoplasmic C‐terminal fragment of polycystin‐1 regulates a Ca2+‐permeable cation channel. J. Biol. Chem. 276, 4093–4101. [DOI] [PubMed] [Google Scholar]
- Xu C, Rossetti S, Jiang L, Harris PC, Brown‐Glaberman U, Wandinger‐Ness A, Bacallao R, Alper SL (2007) Human ADPKD primary cyst epithelial cells with a novel, single codon deletion in the PKD1 gene exhibit defective ciliary polycystin localization and loss of flow‐induced Ca2+ signaling. Am. J. Physiol. Renal Physiol. 292, 930–945. [DOI] [PMC free article] [PubMed] [Google Scholar]
- Yamaguchi T, Hempson SJ, Reif GA, Hedge AM, Wallace DP (2006) Calcium restores a normal proliferation phenotype in human polycystic kidney disease epithelial cells. J. Am. Soc. Nephrol. 17, 178–187. [DOI] [PubMed] [Google Scholar]