Abstract
We use NMR spectra to determine protein-protein contact sites by observing differences in amide proton hydrogen-deuterium exchange in the complex compared to the free protein in solution. Aprotic organic solvents are used to preserve H/D labeling patterns that would be scrambled in water solutions. The binding site between the mammalian cochaperone Aha1 with the middle domain of the chaperone Hsp90 obtained by our H/D exchange method corresponds well with that in the X-ray crystal structure of the homologous complex from yeast, even to the observation of a secondary binding site. This method can potentially provide data for complexes with unknown structure and for large or dynamic complexes inaccessible via NMR and X-ray methods.
Keywords: protein complexes, binding sites, NMR spectroscopy, hydrogen-deuterium exchange
1. INTRODUCTION
The wealth of information derived from the sequencing of a number of genomes will only be efficiently utilized when the data can be applied to the delineation of structure and function in real molecular systems. One of the most important applications of the sequence and structural databases will be to elucidate functional complexes between components of biological systems. Methods for rapid screening of potential ligands are in place but there are very few methods, short of detailed x-ray structure determination, for delineating the contact surfaces that are formed in such complexes. Spectroscopic methods employing labels that can detect fluorescence resonance energy transfer or spin labels to detect the close proximity of groups on different molecules have been extensively used, but they have significant limitations. Firstly, the information is obtained only for the immediate vicinity of the attached label. Labeling sites must necessarily be designed with some underlying knowledge or hypothesis about the location of the binding site. Secondly, the presence of the label may perturb the interaction under study, rendering the results difficult to interpret.
In this paper, we describe an alternative approach that utilizes hydrogen/deuterium exchange in solution, followed by NMR spectroscopy, to delineate the binding sites between macromolecules. H/D exchange has been previously employed for determining the combining sites of antibodies [1], but the determination of amide proton protection patterns in aqueous solutions has insurmountable problems that render the data difficult to interpret. The technique is simple: the hydrogen/deuterium exchange rates of the amide protons in a protein are mapped by comparing the NMR spectra of the protein in water (H2O) solution with the spectrum after transfer into deuterium oxide (D2O) solution. Since the deuterium nucleus is invisible in the proton NMR spectrum, the signals of the amides where the proton has exchanged with deuterium will disappear. For a folded protein, the solvent-accessible amide protons close to the outer surface of the protein will be exchanged most rapidly; amides that are hydrogen-bonded in secondary structure and/or sequestered in the interior of a hydrophobic pocket, will be exchanged more slowly. Some slowly-exchanging amides may persist for months or years at room temperature. The H/D exchange experiment to delineate a binding site involves a comparison of the amide proton protection pattern in the presence of a binding partner. Formation of the complex will cause additional sequestration of amides in the binding site, which should be visible in the NMR spectrum as an increase in the proton NMR signal over that observed in the free protein.
The major problem with this experiment when applied to real protein systems is that the comparison of the amide signals in the free protein and in the complex is very difficult to make when the binding partner is of a significant size. If the molecular weight of the complex is significantly greater than that of the free protein, the signals will be relatively broader. If the complex is large enough, the signals may disappear. The signals belonging to a single component of the complex would still be detectable, but dissociation of the complex in aqueous solution or D2O would result in loss of the information on amide proton protection in the complex.
We propose a variation of this protocol where the complex is dissociated under controlled conditions and the amide proton protection patterns are preserved by freezing and lyophilization of the solution followed by NMR spectroscopy in an aprotic solvent. The comparison between the “free” and “bound” amide proton protection pattern is made under identical solvent conditions. Amide proton protection has been measured in this way to determine the structure of amyloid fibrils [2] and in quench-flow protein folding studies of apomyoglobin [3]. Here we apply the H/D exchange method followed by NMR analysis in the aprotic solvent DMSO to delineate the binding site of the middle (M) domain of human Hsp90 on the cochaperone human Aha1. The binding site observed in these experiments is entirely consistent with the published X-ray structure of the homologous complex from yeast [4]. Our measurements even detect the presence of a secondary binding site deduced from crystal contacts in the X-ray structure.
MATERIALS AND METHODS
Preparation of Proteins
Constructs for the middle domain of human Hsp90α (M, residues 293–554) were amplified from a full length clone and subsequently cloned by standard restriction enzyme methods into the expression vector pET21a (Novagen). The Hsp90 binding domain of Aha1 (residues 1–162 of human Aha1) was amplified by PCR from a human liver cDNA library and cloned into pET21a. Proteins were expressed in M9 minimal medium in the E. coli host BL21 (DE3) [DNAY] with induction at 15°C for 12–20 hours. Cells were lysed by sonication in 25 mM Tris buffer, pH 8.0, supplemented with 5 mM DTT, a tablet of Protease Inhibitor Cocktail (Roche) and 2 mM EDTA. The soluble fraction of the cell lysate was applied to a 60 ml Sepharose Q FF column equilibrated with 25 mM Tris, pH 7.5, 2 mM EDTA, 2 mM DTT and proteins eluted with a linear gradient to 1M NaCl, concentrated using Centriprep10 (Amicon) and purified by gel filtration chromatography on a 350 ml Sephacryl S100HR (2.6×65 cm) in 20 mM Tris, pH 7.5, 0.2 M KCl, 2 mM EDTA, 2 mM DTT. Aha1 isotopically labeled with 15N or with 15N and 13C was obtained by expression of the protein in E. coli grown in the presence of (15NH4)2SO4, 15NH4Cl and 13C-glucose as appropriate.
DMSO solutions of Aha1 for resonance assignment were prepared by dialyzing concentrated protein samples into 20mM ammonium acetate pH 7.1, 0.5mM TCEP. Sample pH was adjusted to 2.7 with 2% TFA immediately prior to freezing in liquid nitrogen and lyophilization. Lyophilized 15N, 13C double-labeled protein was dissolved in dry DMSO-D6 (CIL) immediately prior to NMR analysis.
NMR Spectra
All NMR spectra were acquired at 20°C on a Bruker DRX600 spectrometer equipped with a cryoprobe. Standard HSQC [5] and triple resonance spectra, HNCA [6], HNCO [6], HNCACO [7], HNCACB [8] and CBCA(CO)NH [9] were used to assign the resonances of Aha1 in DMSO solution. Data were processed using NMRPipe [10] and NMRView [11].
H/D Exchange Experiments
For the H/D exchange, all samples were dialyzed overnight into 20 mM ammonium acetate buffer, pH 7.1, containing 0.5 mM TCEP. 15N-labeled Aha1 was used at an identical final concentration of 100 µM in the free state and in complex with Hsp90 M domain. The complex was formed by addition of unlabeled human Hsp90α (293–554) to 15N-labeled Aha1 in a 1:1 molar ratio. “Interrupted” hydrogen-deuterium exchange was carried out as previously described [3,12]. Exchange of both the free and Hsp90 M domain-bound Aha1 was initiated by manual dilution into a 10-fold volume of the same buffer (20 mM ammonium acetate buffer, pH 7.1, containing 0.5 mM TCEP) in D2O at 4° C. After incubation at various times between 24s and 72 h at 4° C, aliquots were withdrawn and the H/D exchange was quenched by adding 0.1% (vol/vol) trifluoroacetic acid solution in D2O, to give a final pH* (Measured pH value in a D2O solution, uncorrected for the deuterium isotope effect) of approximately 2.5 for the solution. Each sample was quickly frozen in liquid nitrogen and lyophilized. The lyophilized proteins were taken up in dry DMSO for NMR analysis.
3. RESULTS
Resonance Assignments for Human Aha1(1–162) in DMSO solution
In order to determine which of the Aha1 amide protons are protected from H/D exchange, it is necessary to assign the resonances. Further, since the amide protection patterns of the protein in the presence and absence of Hsp90 M domain are preserved and detected by NMR analysis in the aprotic solvent DMSO, it is necessary to obtain assignments for the protein in this solvent, under the conditions that will be used to determine the amide protection patterns. Assignments were made using standard triple resonance methods.
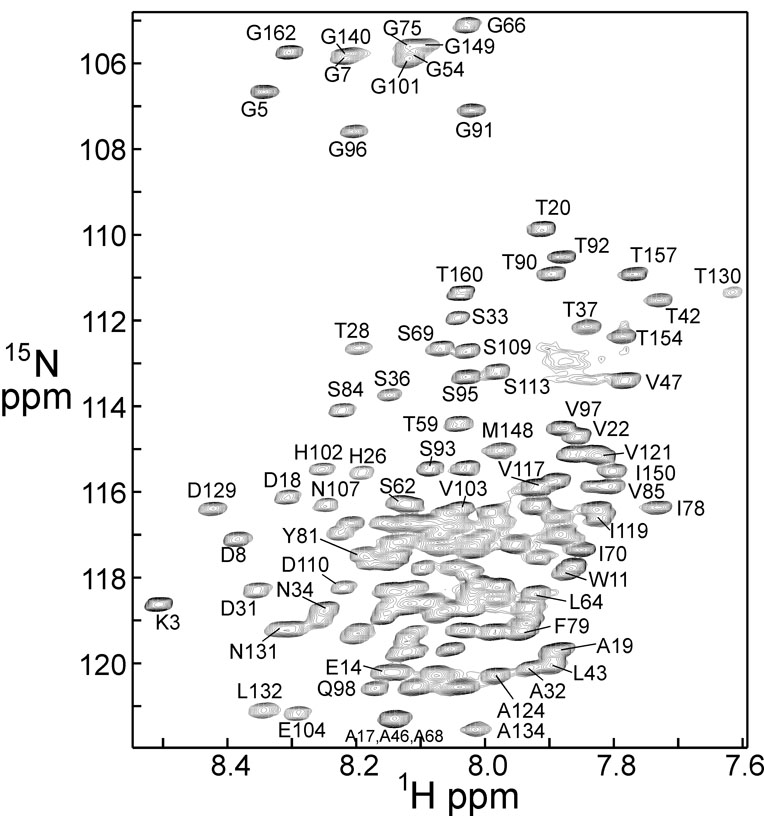
Aha1(1–162) is completely unfolded in DMSO solution, as indicated by the tight dispersion of the proton resonances in the 1H-15N HSQC spectrum (Figure 1). As previously noted, the 15N dispersion is similar to that of a folded protein [13]. Despite the poor 1H resolution, the resonances are distinguishable due to the narrow linewidth typical of unfolded proteins [13], and close to complete backbone assignments have been made.
Figure 1.
600 MHz 1H-15N HSQC spectrum of Aha1 in 100% DMSO solution, showing selected assignments.
H/D Exchange of Aha1
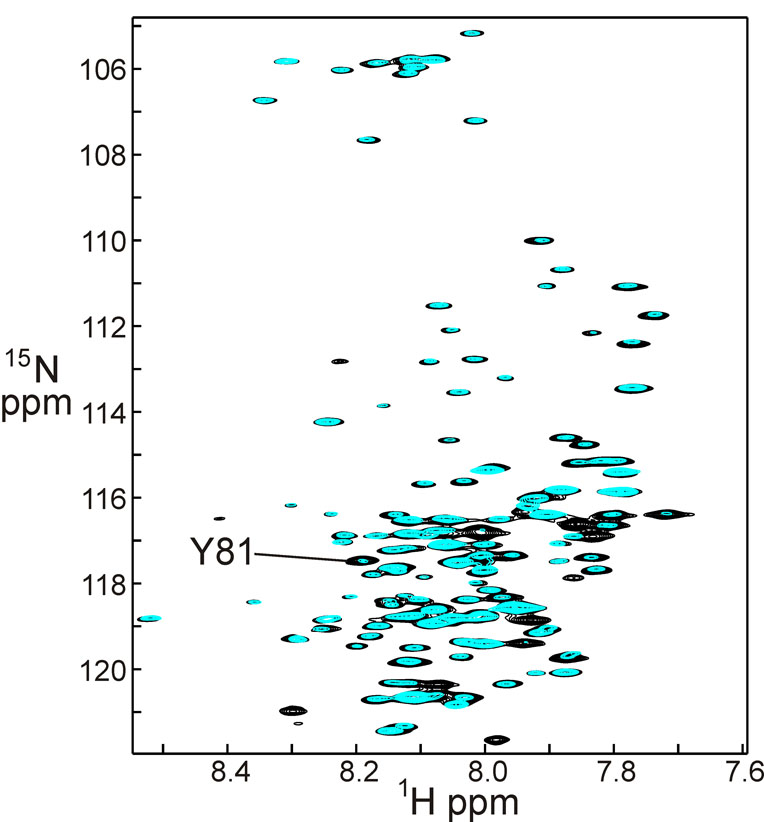
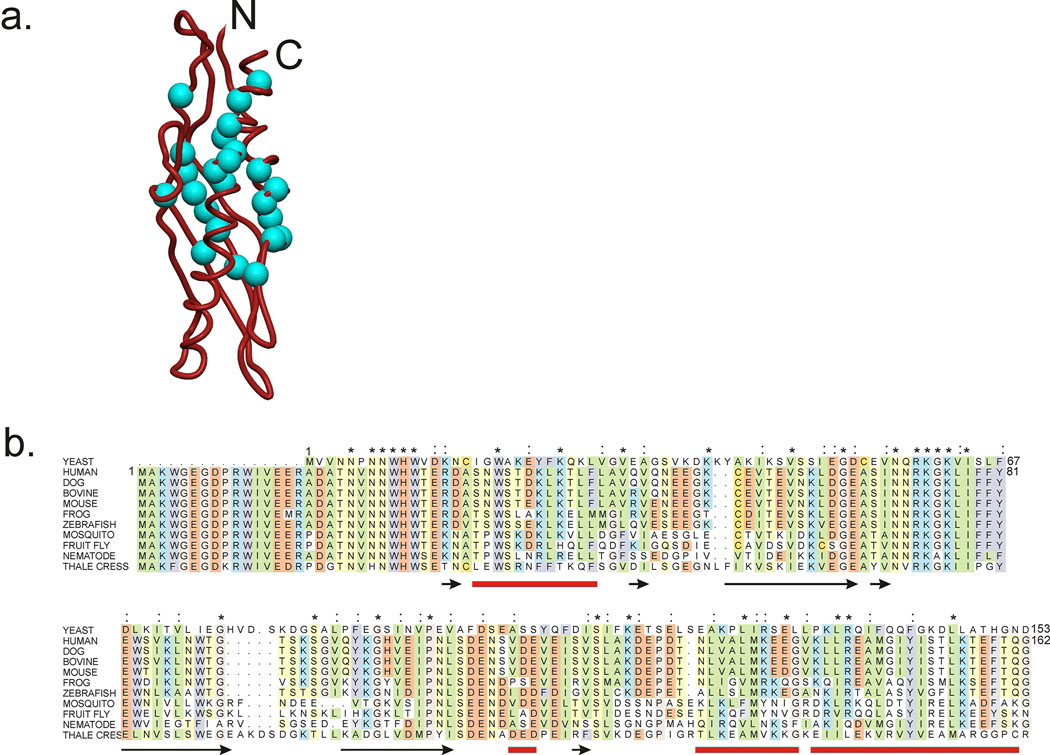
The amide proton protection of Aha1(1–162) after 72 hours in D2O at 4° C is shown in Figure 2. The underlying black spectrum shows the cross peaks of free Aha1 before D2O exchange, and is equivalent to the spectrum in Figure 1. The overlying blue spectrum shows differences in the intensity of a number of cross peaks, corresponding to the extent to which the amide proton has been exchanged for deuterium. The cross peaks with unchanged intensity correspond to the protected amides, which are normally present in hydrogen-bonded secondary structure and/or sequestered in the interior of the protein, resulting in the retention of the proton at this position, i.e. its protection from exchange. Highly protected amides identified from the spectra in Figure 2 are shown in Figure 3a, plotted on the structure of the homologous yeast protein [4]. The amino acid sequence alignment between yeast and human Aha1, and other eukaryotic proteins of this family is shown in Figure 3b. Although the sequences share rather low similarity (18% identical, 17% similar), the protected amides of the human protein fall into regions that correspond to expected regions of high protection in the yeast protein structure: the inner surfaces of two helices and the central strand of the β-sheet. We infer that, while the structure of the human Aha1 protein may differ in detail, the overall topology must be similar to that of the yeast protein for which the structure was obtained.
Figure 2.
Superposition of a 600 MHz 1H-15N HSQC spectrum of Aha1 in 100% DMSO solution (black) with a spectrum taken under the same conditions of Aha1 following incubation in 100% D2O at 4° C for 72 hours (blue). Resonances of amides protected from exchange show comparable intensities in the black and blue spectra, while those that exchange show a reduced intensity in the blue spectrum.
Figure 3.
a. Ribbon diagram showing the backbone structure of yeast Aha1 from the X-ray crystal structure of the complex of yeast Aha1 with the middle (M) domain of yeast Hsp90. Blue spheres represent the backbone N atoms of the residues whose amides are fully protected in the free protein (i.e. cross peak intensity in the black and blue spectra of Figure 2 are the same). Figure prepared with MolMol [15]. b. Amino acid sequence alignment (ClustalW) of Aha1 from yeast with a number of other eukaryotic Aha1 sequences. Highly conserved hydrophobic amino acids are shown in green, acidic in red, aromatic in purple, basic in blue, neutral hydrophilic in yellow, glycine and proline in pink and cysteine in gold. Positions of β-strands in the X-ray structure of yeast Aha1 [4] are indicated by black arrows, and α-helices are shown by red lines. Asterisks indicate residues that are identical between the yeast and human sequences, and colons indicate similar residues between these two sequences.
H/D Exchange of Aha1 in complex with Hsp90 M domain
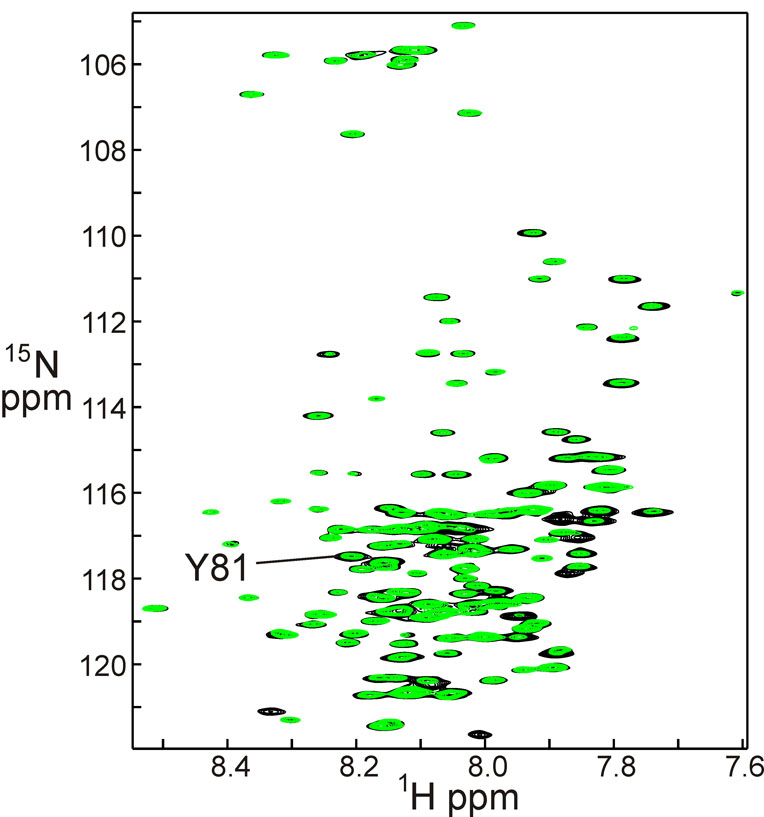
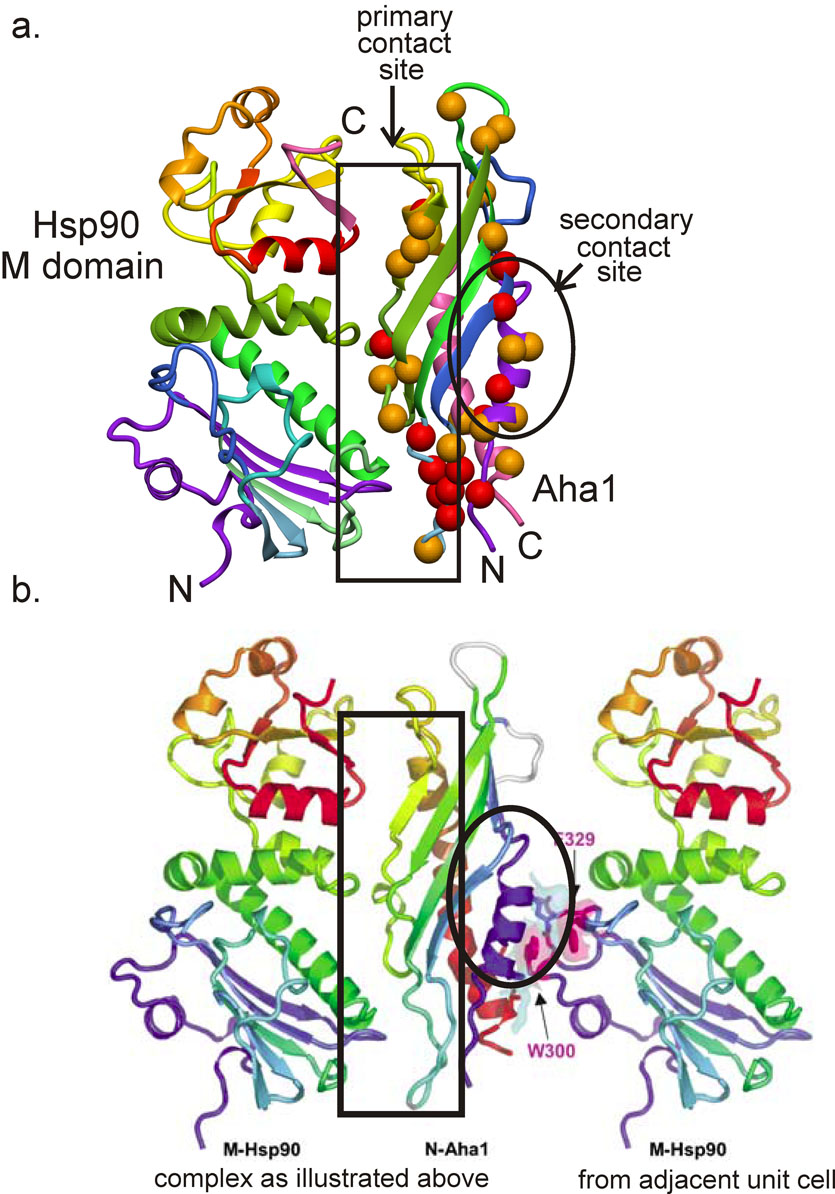
Small but significant differences are observed in the protection of amides when H/D exchange is measured in the presence of the Hsp90 M domain (Figure 4). This domain has been shown both by the X-ray structure of the yeast protein [4] and by NMR experiments [14] to bind specifically to the Hsp90 M domain. Figure 4 shows a superposition of the 1H-15N HSQC spectrum of 15N-labeled Aha1 in the presence of unlabeled Hsp90 M domain. As for Figure 2, the black spectrum represents the protein before initiation of H/D exchange, and corresponds both to the black spectrum of Figure 2 and to Figure 1. The overlaid green spectrum was acquired after the complex had spent 72 hours in D2O, exactly analogous to the blue spectrum of Figure 2. A comparison of the overlaid spectra of Figure 2 with those of Figure 4 shows that there is a significant increase in the intensity of several of the cross peaks, indicating that the protection of certain amides has been increased in the complex compared to the free protein. The extent of the difference in protection was quantified by measuring the intensity of each cross peak in each spectrum, and then comparing the ratios of the intensity change for the free protein with that of the bound protein. For example, the cross peak for Tyr 81 has an intensity of 10 before exchange in either the free or bound states (black spectra of Figure 2 and Figure 4) but the free form has an intensity of 2 after 72 hours in D2O (blue spectrum), whereas the intensity of the cross peak for the complex is 5 (green spectrum). The ratio between the intensities at zero time and 72 hours for the free protein is thus 5.0, while the corresponding ratio for the bound protein is 2.0. The difference between these two numbers, 3.0, represents one of the larger changes in protection between free and bound Aha1. A total of 13 amides showed a difference of greater than 2 in the intensity ratio between free and bound Aha1, and another 30 amides showed a smaller difference (1< intensity ratio difference < 2). Figure 5 shows the positions of these amides plotted onto the structure of the complex between yeast Aha1 and the M domain of yeast Hsp90.
Figure 4.
Superposition of a 600 MHz 1H-15N HSQC spectrum of the Aha1 complex with Hsp90 M domain, dissolved in 100% DMSO solution (black) with a spectrum taken under the same conditions of the Aha1 complex with Hsp90 M domain, following incubation in 100% D2O at 4° C for 72 hours (green). As for Figure 2, resonances of amides protected from exchange show comparable intensities in the black and green spectra, while those that exchange show a reduced intensity in the green spectrum. Note that the H/D exchange experiment for the complex took place in D2O solution, and this solution was subsequently quenched and lyophilized before being taken up in DMSO. The complex is dissociated in DMSO and both proteins are unfolded. However, despite the presence of the (unlabeled) Hsp90 M domain in the DMSO solution, it has no effect on the resonances of the (labeled) Aha1.
Figure 5.
a. Ribbon diagram showing the backbone structure of the complex of yeast Aha1 with yeast Hsp90 M domain (PDB 1USU) [4]. Red spheres represent the amides that show the greatest difference in protection between human Aha1 free and in the complex with human Hsp90 M domain (intensity ratio difference > 2), while orange spheres show resides with smaller differences (1< intensity ratio difference < 2). The residues are identified with reference to the sequence alignment shown in Figure 3b. Figure prepared with MolMol [15]. b. Crystal contacts between Aha1 and the Hsp90 M domain present in the same unit cell (left) and in the adjacent unit cell (right). Figure adapted from Meyer et al. [4] with permission.
4. DISCUSSION
The positions of the amides whose level of protection is increased in the complex with the Hsp90 M domain differ from those that were fully protected in the free protein (Figure 3a). Indeed, this must be so, since the fully protected amides could not be expected to increase their protection in a complex; the only circumstance where these amides could change their protection would be if the protein were to unfold in the complex, giving decreased protection. The level of protection of the amides that are fully protected in the free protein remains complete in the bound protein, demonstrating that human Aha1 remains folded in the complex with human Hsp90 M domain, as expected from the published crystal structure of the yeast complex [4].
The major contact site for Hsp90 M domain on Aha1 is shown by the group of red spheres, indicating a large difference in protection between the free and bound proteins, at one end of the molecule. This site corresponds well with part of the contact surface in the yeast complex (Figure 5), and several sites on the remainder of the contact surface in the crystal structure show significant groups of red and orange spheres, indicating the presence of additional amide proton protection in the complex. Since the homology between the yeast and human sequences for Aha1 is quite low, we would expect some difference in detail between the structures, but certainly the topology of this surface appears well represented in the H/D exchange measurements.
However, there also appears to be a significant level of increased protection on the opposite face of the molecule. Although this could be construed as evidence that the observed increase in amide protection in the presence of Hsp90 M domain is non-specific, we believe that it accurately represents the presence of a secondary binding site in solution. The report of the X-ray crystal structure of the yeast Aha1 in complex with the yeast Hsp90 M domain [4] specifically comments on the observation of contacts between Aha1 and two M domain molecules, in different asymmetric units. These crystal contacts cannot be inferred directly from the deposited coordinates (PDB accession 1USU), but an examination of Figure 2A from Meyer et al. [4] shows that the contact surfaces of the central Aha1 with the two flanking Hsp90 M domain molecules correspond very well to the surfaces indicated in Figure 5. Meyer et al [4] speculate that the secondary binding site shown in the crystal structure might be associated with client protein binding to the Hsp90-Aha1 complex. Our results do not address this speculation, but rather confirm that the Hsp90 M domain may contact two different surfaces of Aha1 in solution.
Our observations show that the hydrogen-deuterium exchange method, with the protection patterns of labeled proteins detected in solution in non-aqueous solvents, is a powerful means to probe the contact sites between protein domains in solution. In cases where the complex may be unable to be crystallized, this method potentially provides valuable first-round information on the location of sites, which can then be further probed by other spectroscopic means such as fluorescence resonance energy transfer or spin labeling. In contrast with traditional NMR or X-ray crystallographic methods, complexes can be prepared and H/D exchange can be performed at relatively low protein concentration under conditions more representative of the biological state. Our technique has the added advantage that the interactions between the components of the complex are not perturbed to any significant degree by the experimental conditions, as frequently occurs, for example, by the covalent attachment of fluorescent or spin label probes in the vicinity of binding sites. In addition, we anticipate that the H/D exchange method can readily be used in association with FRET and spin label studies, as a means of validation for these methods.
ACKNOWLEDGMENTS
The full length human HSP90α clone was a kind gift from David Toft. We thank Peter E. Wright, Chiaki Nishimura, Sung-Jean Park and Tohru Yamagaki for valuable discussions. Euvel Manlapaz and Spencer Tung provided excellent technical assistance. This work was supported by grant GM57374 from the National Institutes of Health.
Footnotes
Publisher's Disclaimer: This is a PDF file of an unedited manuscript that has been accepted for publication. As a service to our customers we are providing this early version of the manuscript. The manuscript will undergo copyediting, typesetting, and review of the resulting proof before it is published in its final citable form. Please note that during the production process errors may be discovered which could affect the content, and all legal disclaimers that apply to the journal pertain.
6. REFERENCES
- 1.Paterson Y, Englander SW, Roder H. An antibody binding site on cytochrome c defined by hydrogen exchange and two-dimensional NMR. Science. 1990;249:755–760. doi: 10.1126/science.1697101. [DOI] [PMC free article] [PubMed] [Google Scholar]
- 2.Hoshino M, Katou H, Hagihara Y, Hasegawa K, Naiki H, Goto Y. Mapping the core of the β2-microglobulin amyloid fibril by H/D exchange. Nature Struct. Biol. 2002;9:332–336. doi: 10.1038/nsb792. [DOI] [PubMed] [Google Scholar]
- 3.Nishimura C, Dyson HJ, Wright PE. Enhanced picture of protein-folding intermediates using organic solvents in H/D exchange and quench-flow experiments. Proc. Natl. Acad. Sci. USA. 2005;102:4765–4770. doi: 10.1073/pnas.0409538102. [DOI] [PMC free article] [PubMed] [Google Scholar]
- 4.Meyer P, Prodromou C, Liao C, Hu B, Roe SM, Vaughan CK, Vlasic I, Panaretou B, Piper PW, Pearl LH. Structural basis for recruitment of the ATPase activator Aha1 to the Hsp90 chaperone machinery. EMBO J. 2004;23:1402–1410. doi: 10.1038/sj.emboj.7600141. [DOI] [PMC free article] [PubMed] [Google Scholar]
- 5.Grzesiek S, Bax A. The importance of not saturating H2O in protein NMR. Application to sensitivity enhancement and NOE measurements. J. Am. Chem. Soc. 1993;115:12593–12594. [Google Scholar]
- 6.Grzesiek S, Bax A. Improved 3D triple-resonance NMR techniques applied to a 31 kDa protein. J. Magn. Reson. 1992;96:432–440. [Google Scholar]
- 7.Kay LE, Ikura M, Tschudin R, Bax A. Three-dimensional triple-resonance NMR spectroscopy of isotopically enriched proteins. J. Magn. Reson. 1990;89:496–514. doi: 10.1016/j.jmr.2011.09.004. [DOI] [PubMed] [Google Scholar]
- 8.Grzesiek S, Bax A. An efficient experiment for sequential backbone assignment of medium-sized isotopically enriched proteins. J. Magn. Reson. 1992;99:201–207. [Google Scholar]
- 9.Grzesiek S, Bax A. Correlating backbone amide and side chain resonances in larger proteins by multiple relayed triple resonance NMR. J. Am. Chem. Soc. 1992;114:6291–6293. [Google Scholar]
- 10.Delaglio F, Grzesiek S, Vuister GW, Guang Z, Pfeifer J, Bax A. NMRPipe: a multidimensional spectral processing system based on UNIX pipes. J. Biomol. NMR. 1995;6:277–293. doi: 10.1007/BF00197809. [DOI] [PubMed] [Google Scholar]
- 11.Johnson BA, Blevins RA. NMRView: A computer program for the visualization and analysis of NMR data. J. Biomol. NMR. 1994;4:604–613. doi: 10.1007/BF00404272. [DOI] [PubMed] [Google Scholar]
- 12.Hughson FM, Wright PE, Baldwin RL. Structural characterization of a partly folded apomyoglobin intermediate. Science. 1990;249:1544–1548. doi: 10.1126/science.2218495. [DOI] [PubMed] [Google Scholar]
- 13.Yao J, Dyson HJ, Wright PE. Chemical shift dispersion and secondary structure prediction in unfolded and partly folded proteins. FEBS Lett. 1997;419:285–289. doi: 10.1016/s0014-5793(97)01474-9. [DOI] [PubMed] [Google Scholar]
- 14.Martinez-Yamout MA, Venkitakrishnan RP, Preece NE, Kroon G, Wright PE, Dyson HJ. Localization of sites of interaction between p23 and Hsp90 in solution. J. Biol. Chem. 2006;281:14457–14464. doi: 10.1074/jbc.M601759200. [DOI] [PubMed] [Google Scholar]
- 15.Koradi R, Billeter M, Wüthrich K. MOLMOL: A program for display and analysis of macromolecular structures. J. Mol. Graphics. 1996;14:51–55. doi: 10.1016/0263-7855(96)00009-4. [DOI] [PubMed] [Google Scholar]


