

Abstract
We previously customized a Nipkow spinning disk confocal microscope (SDCM) to acquire 4D data for live, intraerythrocytic malarial parasites (Gligorijevic, B. et al., Biochemistry 45, 12400). We reported that chloroquine (CQ) treatment did not appear to affect progress through the cell cycle, and suggested that toxicity may be manifested post- schizogony. We now use SDCM, synchronized cell culture and continuous vs. bolus drug dosing to investigate stage specific CQ effects in detail. We develop a novel, extremely rapid method for counting schizont nuclei in 3D. We then quantify schizont nuclei and hemozoin (Hz) production for live parasite cultures pulsed with CQ at different stages in the cell cycle and find that bolus treatment of rings affects the multiplicity of nuclear division. We quantify parasitemia and merozoite development in subsequent cycles following bolus CQ exposure and find that a portion of CQ toxicity is manifested post schizogony as “delayed death”. Using these methods and others we compare CQ sensitive (CQS) vs. resistant (CQR) strains as well as transfectants that are CQR via introduction of mutant PfCRT. Surprisingly, we find that PfCRT confers resistance to CQ administered at the very early ring stage of development, wherein a digestive vacuole is not yet formed, as well as at the schizont stage, wherein Hz production is thought to plateau. Taken together, these data force a rethinking of CQ pharmacology and the mechanism of CQR.
Keywords: hemozoin, merozoite production, delayed death
INTRODUCTION
P. falciparum malarial parasites are now largely resistant to several key antimalarial drugs. Until recently chloroquine (CQ) was the drug of choice but globally > 50% of P.falciparum infections are now chloroquine resistant (CQR). Elucidating the molecular mechanism of CQR is essential to ongoing design of second line antimalarial drugs and new therapies [1]. In addition, the mechanism of action of CQ is not fully understood but is obviously also relevant for drug design.
Early on, parasite DNA was postulated to be the CQ target [2, 3]. Cohen and Yielding further proposed that DNA synthesis is inhibited through an effect on DNA and RNA polymerase, due to the binding of CQ to DNA primer [4]. Hahn et al. investigated aminoquinoline action vs. nucleic acids and proposed that CQ stabilizes double stranded DNA [5,6]. Meshnick and colleagues have also proposed that a portion of the CQ mechanism comes from binding to DNA, possibly by preventing formation of Z-DNA [7,8]. However, none of these models easily explained much lower inhibitory concentrations of CQ for P. falciparum vs. mammalian cells ( ~ 1000 – 10,000 fold lower). Thus the nucleic acid hypotheses have been largely discounted, particularly after the discovery that the P. falciparum genome was highly AT rich whereas CQ preferentially interacts with GC- rich DNA [9].
When CQR parasites were found to accumulate substantially less CQ vs. CQ sensitive (CQS) [10], and a lysosomal – like organelle called the digestive vacuole (DV) was found to be the principle site of CQ accumulation [11, 12], focus began to shift towards investigation of DV processes. Importantly, Orjih and Fitch found that mid-stage trophozoites with fully formed DV accumulate more CQ than any other stage [13]. Morever, recently, CQR was shown to segregate with mutations in the pfcrt gene which encodes a protein found in the DV membrane, which is only fully developed during the early trophozoite stage [14]. Also much physical - chemical data supports direct interaction between CQ and various forms of non-crystalline heme released in the DV upon hemoglobin (Hb) digestion (e.g. [15,16]). These interactions inhibit conversion of toxic heme to non-toxic crystalline hemozoin (Hz) and are thus believed to be central to CQ (and related quinoline antimalarial drug) pharmacology [17, 18]. Taken together, this is why it is now widely assumed that CQ acts primarily on the trophozoite stage of intraerythrocytic parasites, and that this is the stage wherein the CQR mechanism must operate. Indeed, mutant PfCRT causes CQR, directly binds CQ [19] and is postulated to be a transporter that either directly or indirectly alters CQ – heme interaction within the DV during the trophozoite stage [19, 20].
Further testing of this model and possibly others would benefit from additional close inspection of the stage specificity of CQ effects, using recently perfected imaging tools. Only a handful of studies report on the stage-specificity of CQ and related aminoquinolines, and many questions remain. Early on Peters demonstrated that CQ is not active against liver stages of infection, but active vs. the erythrocytic stages that actively degrade Hb [21]. While describing gametocytogenesis, Smalley et al. found that early gametocytes are sensitive to CQ along with trophozoites that are actively digesting Hb [22]. Slater later summarized these results and others, noting that “… early rings, late schizonts and late gametocytes are innately resistant to concentrations of CQ that would kill trophozoites and rings on the border of trophozoite stage …” [23].
However, Zhang et al. [24] performed a detailed study on stage-specificity of CQ and reported that ring stages are the most sensitive, a conclusion also consistent with the work of Orjih et al. [25], but in direct contrast to other studies by Yayon and Jensen [26] as well as others summarized in [23]. Interestingly, Zhang et al. also proposed that the effect of CQ on trophozoites and schizonts is not seen until the cycle following exposure to drug (after reinvasion and development of new rings; a phenomenon referred to as “delayed death”), a conclusion also reached by Krishna and colleagues [27]. Perhaps disagreement in the literature regarding stage specific CQ toxicity is due in part to measurement of survival at different endpoints (wherein different degrees of delayed death have occurred). In any case, collectively, these studies typically only report data for one parasite strain, do not quantify precise IC50 values for various dose schedules (i.e. continuous vs. bolus pulse for various time), and were performed well before our current level of molecular understanding of CQR and so do not compare CQS vs. CQR parasites.
In this study we investigate the stage specificity of CQ in detail using recently developed imaging methods [28,29] to measure parameters that are central to various models for toxicity, but that have not previously been measurable for live parasites. Our results are in agreement with previous observations that the effect of CQ is both schedule and dose- dependent, but also clearly show that ring stage parasites are affected by CQ long before the mature DV is formed, and that schizont stage parasites are similarly sensitive to CQ long after Hz formation has plateaued. In addition, quite surprisingly, we find that the CQR mechanism mediated by mutant PfCRT is equally active in all stages of intraerythrocytic growth. Our results are consistent with the Hz crystallization process being an important, but likely not the only, target of CQ. We propose that both CQ toxicity and the CQR mechanism controlled by mutant PfCRT involve multiple stage specific molecular pathways.
MATERIALS & METHODS
Materials
Fresh stocks of P. falciparum strains Dd2, HB3 and GCO3 were obtained from the Malaria Research and Reference Reagent Resource Center (MR4). The allelic exchange lines C4Dd2 and C2GCO3 were kindly provided by Dr. David Fidock (Albert Einstein College of Medicine, Bronx, NY). Custom 5% O2/5% CO2/90% N2 gas blends were purchased from Robert’s Oxygen (Rockville, MD). Off-the-clot, heat-inactivated, pooled O+ human serum and pooled O+ human whole blood were purchased from Biochemed Services (Winchester, VA). Albumax and SYBR Green I were purchased from Invitrogen Corporation (Carsbad, CA). CQ phosphate, Poly-L-lysine, RPMI 1640, hypoxanthine, and Giemsa were from Sigma-Aldrich (St. Louis, MO). No. 1.5 coverslips were from Fisher Scientific (Pittsburgh, PA). 3H-CQ was obtained from American Radiolabelled Chemicals, Inc. (St. Louis, MO). All other chemicals were reagent grade or better and purchased from commercial sources.
Methods
Cell culture
All P. falciparum lines were maintained using the method of Trager and Jensen [30] with minor modifications. Vials containing glycerolyte and seeding culture at 4 % parasitemia were kept in L N2. Once thawed, they were maintained in the presence of custom 5% CO2/ 5% O2/ 90% N2 gas blends and at 37C° in flasks (Corning T25, plug seal). Culture medium was 2 % hematocrit in RPMI 1640 supplemented with 10% O+ human serum, 2 g/l NaHCO3, 1 g/l glucose, 50 µg/l gentamycin, 25 mM HEPES pH 7.4, 0.75 mM hypoxanthine. Parasitemia was monitored daily by Giemsa staining and set to 2 % every 48 h.
Synchronization
For this work, all cultures were routinely synchronized three times per cycle by 5 % D-sorbitol treatment [31] which lyses mid-stage and late trophozoites as well as schizonts but leaves uninfected RBC, rings and some early trophozoites unscathed. Multiple synchronization treatments successively improve the ring: early trophozoite ratio. The first two treatments were in cell cycle “n-1” at 4 h and 14 h after the first visually observed RBC invasion event (most of the culture consists of schizonts at this stage). In this way 0–4 h old rings are primarily left after the first synchronization, and lingering other stages are further eliminated at 14 h. The third treatment is 4 h after the first observed invasion in the following cell cycle. For data presented in Results the time of the last synchronization step in cycle “n” is marked as time = 0 h.
CQ treatments and continuous vs. bolus IC50
Typically, sensitivity to a given drug for a given strain of P. falciparum is calculated from a continuous exposure (CE) experiment in which a fresh culture is continuously exposed to drug for at least one full cell cycle (≥ 48 h), and resulting survival is given as the ratio of parasitemia for drug-treated vs. control. In order to design experiments that precisely measure the stage specificity of CQ action for CQS vs. CQR parasites, we required conventional CE IC50 values for each cell line, but also IC50 calculated after bolus exposure at different stages of parasite development. These were calculated visually by two independent operators using Giemsa-based microscopy assays, since this method, although tedious, also allowed for definition of stage populations (see Results). The beginning of bolus drug treatment for ring stage parasites (BR) was at 5 h (5 h after the last synchronization wash, see above), while bolus drug treatment of trophozoite stages (BT) was started at 15 h. The length of the bolus treatment is marked with a superscript, while the subscript denotes the CQ concentration relative to a standard continuous exposure (CE) IC50. For example, 2hBR25x denotes a 2h- long bolus ring treatment beginning at 5h with [CQ] = 25 × CE IC50 for that cell line, whereas 4hBT12x would denote a 4h – long bolus trophozoite treatment using [CQ] = 12 × CE IC50 for that line (see Results). All bolus treatments were followed by a triple wash with complete medium at 37°C to remove drug. As described in results, control experiments using tracer 3H CQ show the washing steps effectively remove drug, to levels very far below those measured for parasites cultured in the continuous presence of sub IC50 CQ. To wash, cultures were transferred to a conical vial and centrifuged at 700 × g for 3 min. Supernatant was removed, 100 volumes of CM were added, the pellet was carefully resuspended in CM and spun again at 700 × g for 3 min. This was repeated three times before putting the cell pellet back into fresh culture medium.
Spinning Disk Confocal Microscopy (SDCM) and data acquisition
We have previously described our customized SDCM apparatus in detail [1,28]. We used a Merzhauser motorized MS-2000 XY translation stage and an additional piezo table for Z – movement. The table moves via four piezo elements at a maximum speed of 5 mm/s and over a range of 100 µm. Oil was DF-type (n=1.515, low background fluorescence), and the camera was a Hamamatsu ORCA ER cooled CCD with 1. 3 Mpixel full frame and 8.9 fps full rate. For fluorescence SDCM, excitation was with a Coherent Innova 300 I Ar/Kr laser (300 mW at 488 nm), and a NEOS acousto optic tunable filter was used for fast illumination control. Exposure time was typically 100 ms with laser power 100 mW and z- spacing was 200 nm (appropriate for iterative deconvolution as in [28]). Additional details of the system and data acquisition are described elsewhere [1, 28]. After iterative deconvolution using experimentally derived point spread functions, the x, y resolution of fluorescence SDCM data is only slightly lower than that of classical LSCM confocal data (measured on our instrument to be 213 nm using 520 nm light [28]).
To measure hemozoin volumes by differential interference contrast (DIC), our SDCM system is also fitted with customized Nikon optics consisting of a linear polarizer, analyzer, 1.4 NA oil condenser and 100x objective Nomarski prisms. Shear angle was 45°. The degree of contrast enhancement depends on the relative differences in refractive indices (η) between the sample and the surrounding medium, which we note are very large in the case of Hz versus the red cells we image in this work (see [1] for a detailed analysis).
Preparation of samples for optical microscopy
500 µl aliquots of culture were pelleted by centrifugation and resuspended in 100 µl of phosphate buffered system (PBS). For either Hz measurements or for counting nuclei in schizonts cells were first placed on glass coverslips coated with poly-L-lysine (Sigma-Aldrich, P 8920) and incubated for 5 min under standard cell culture atmosphere (5% O2/ 5% CO2/ 90% N2). Non-adherent cells were then gently washed off, and in some cases coverslips were sandwiched with a second microscope slide and sealed with nail polish (see Results). In other cases imaging was done under perfusion as described [1,28]. Typically, data acquisition for a given sample required approximately 25 min from initial removal of the cells from T25 culture flask.
Data processing
Data were transferred to a Dell mini tower customized with three 750 Gb RAID array hard drives, 8 Gb RAM and a 512 Mb NVidia graphics acceleration video card [1, 28]. Restoration was done using an Imaris 5.0.1/ AutoQuant X software package from Bitplane Inc. (Saint Paul, MN) as described [1,28]. Z-series of optical sections obtained in fluorescence mode (‘z -stacks’) for infected cells were deconvolved using the MLE method and a fixed PSF routine with 15 iterations as described [28]. PSF were obtained by mixing subresolution (d= 0.17 µm) fluorescent beads in cell culture as described [28]. Restored images were transferred to Imaris and sorted into freely rotating three-dimensional objects in the ‘Surpass’ mode [28]. Nuclei counts were done with the aid of the “Spots” routine which locates fluorescence peaks in 3D space at operator defined contrast half- width and intensity. We eliminated noise (mostly camera dark current) through background fluorescence subtraction. Assignment of 3D peaks as due to nuclei was confirmed by eye and then done in a semi- automated fashion to average across > 30 schizonts in each case. Counts were exported to Excel or SigmaPlot software 9.0 for further statistical analysis.
Volume measurements were done as previously described in detail [1,28]. Briefly, for Hz, the practical range of grayscale intensity was calculated, and the lower 15% of the transmittance signal was used as a segmentation cutoff value. To process DIC data, we used a Weiner linear deblurring algorithm, followed by empirical bead calibration of z axis resolution (axial smearing) as described [1]. To measure nuclei volume, isosurfaces of restored data sets were built and their characteristics were then exported into Excel as previously described for our quantification of DV volume [28].
Immuno-electron microscopy
Parasitized erythrocyte cultures were pelleted at 1,000 × g and resuspended in fixative containing 4% paraformaldehyde, 0.1% glutaraldehyde and 0.25M HEPES pH 7.4 for 1 h at 25°C. Samples were washed and resuspended in 500 µl of melted 10% bovine gelatin pre-cooled to 25°C. They were then pelleted at 1,000 × g for 6 min, placed on ice for 1 h and cut out of the tubes. Samples were dehydrated 3 × 5 min with 70% EtOH, embedded in LR White (Electron Microscopy Sciences Inc.), placed in gelatin capsules and polymerized O/N at 50°C. Embedded samples were serial sectioned as described [32]. Samples were pre-blocked in PBS containing 5% BSA and stained with rabbit anti-Hemoglobin (Sigma, 1:50 dilution), washed x 3 and stained with 5 nm gold goat anti-rabbit IgG (Electron Microscopy Sciences Inc.). Digital images were acquired for all serial sections. Images were aligned with AutoAligner 2.0.0 (Bitplane AG) and Photoshop 8.0 (Adobe) was used to identify and color structures as appropriate.
Electron microscopy
Samples were transferred to 1.5 ml eppendorf tubes, washed and fixed for 1h in 0.2 M cacodylate buffer, pH 7.2 + 2% glutaraldehyde, 50 mM KCl, and 5 mM MgCl2 . Cells were washed and resuspended in 500 µl 0.2 M cacodylate containing 8% BSA and allowed to settle into a pellet. 4 drops of 25% glutaraldehyde were added, without mixing, and samples set to gel in the BSA for 1 h before pellets were cut out of the tubes and washed three times in 0.2 M cacodylate. Samples were prepared as described [32] and digital images were acquired of all serial sections that contained a parasite. Images were aligned with AutoAligner 2.0.0 (Bitplane AG) and movies for visualization purposes were made in QuickTime Pro (Apple Inc.).
[3H]-Chloroquine accumulation assays
Each experiment was done in triplicate, using [3H]-CQ with 0.5 µCi/mM specific activity. To model continuous exposure of CQ, CQS clone HB3 and CQR clone Dd2 were exposed over 48 h to CQ at their relative IC50, starting at 15 h in cell cycle “n”. 1 ml of each of the cultures at ~1% hematocrit was transferred to a new flask and [3H]-CQ was added. Flasks were gassed and placed back into culture conditions. One 400 µl aliquot was removed at 35 h (schizont stage in n cycle), the flask was gassed again and put back to the culture conditions. A second 400 µl aliquot was removed at 75 h (troph stage in n+1 cycle). Each aliquot was washed three times with 400 µl incomplete media, wash aliquots and final cell pellet were transferred in scintillation vials. To model bolus exposures to CQ, similar experiments were done except HB3 and Dd2 were exposed to their relative 2hBR25x and 2hBT12x at 5 h and 15 h, respectively. After scintillation counting, cpm were converted to [CQ] using known counting efficiency, hematocrit, parasitemia, and parasite volume [28].
Experimental Timeline
As is customary we divide the parasite intraerythrocytic cell cycle into three stages: rings (R) = 0 – 15 h; trophozoite, (T) = 15 – 28 h, schizont, (S) = 28 – 45 h (pre segmented schizont, 28 – 38 h) using well established visual criteria [11, 31, 33]. Each stage can be further divided into “early”, “mid” and “late” (evenly partitioned first, second and third portions). In general, bolus CQ treatments were done at 5 h (early R) 15 h (early T; when the first Hz crystals are easily observable by optical microscopy), and 32 h (early S) when non-segmented schizonts are clearly distinguishable from late trophozoites. Hz volumes were in general measured at 28 – 29 h, which as described [1] is the time at which Hz formation has clearly plateaued and Hz volume remains constant. Unless otherwise noted, CQS refers to both HB3 (laboratory CQS line) and C2GC03 (CQS strain GC03 [progeny of a HB3 × Dd2 cross] control transfectant), and CQR refers to both Dd2 (laboratory CQR line) and C4Dd2 (CQR created from strain GCO3 by allelic exchange with mutant pfcrt; see [33,34]). We routinely compare HB3 to Dd2 and C2 to C4 in order to isolate aspects of the CQR mechanism explicitly due to mutation of pfcrt [e.g. 1, 28].
Images of new clearly separated merozoite nuclei within segmented schizonts were collected at 40 – 41 h. This lies within the post-segmentation “reinvasion period” (which lasts ~ 5 h). At this stage of the cycle all new nuclei are formed and > 50 % of schizonts have burst. To quantify invasion efficiencies, Giemsa smears were taken at 55 h after the last synchronization (R stage of cycle n+1) and 63 h (early T stage of cycle n+1, one full cycle after the first observed Hz formation). Each smear was counted in triplicate, by two different operators and for a total of 900 – 1000 RBCs.
RESULTS
As described above, relatively few studies have probed the stage specificity of CQ toxicity. These report contrasting results, do not compute bolus dose IC50 and do not quantitatively compare CQS vs. CQR parasites. Data below are obtained using improved synchronization techniques, well characterized CQS vs. CQR parasites, and novel imaging methods for quantifying cellular effects of CQ.
Figure 1 presents survival (parasitemia for drug treated / vehicle treated cultures) at 63 h vs. absolute dose of CQ given either continuously throughout one full cell cycle (CE, closed circles, left curve in each panel) or as bolus dose for 2 h at either the early ring (BR; open diamonds), early trophozoite (BT; open triangles) or early schizont (BS; open squares) stage of intraerythocytic development (5 – 7 h, 15 –17 h, or 32 – 34 h respectively, see methods). Data for four strains are shown; HB3 (panel A, laboratory CQS strain), Dd2 (B, laboratory CQR), CQS C2GC03 a GC03 transfection control (C, GC03 is a CQS line derived from a HB3 × Dd2 cross [34]) and CQR C4Dd2 (D, GC03 stably transfected with the CQR – conferring Dd2 PfCRT allele but not previously exposed to CQ [34]). Consistent with two previous reports [26, 27] we find that for all strains the T stage is more sensitive to CQ relative to R. However, surprisingly, when this is precisely quantified by taking the ratio of the computed BR vs. BT IC50 values, we find T is only approximately two fold more sensitive (see Table 1 for calculated IC50 values). In constrast to some previous reports (summarized in [23]) we find the S stage is approximately as sensitive to CQ as is the R stage (c.f. Table 1). Remarkably, when relative resistance factors (Rf; meaning CQR IC50 divided by CQS IC50) are computed for the different doseage schedules, Rf remains constant regardless the schedule (e.g. CE vs. BR) or stage at which CQ is administered. This is the case not only when comparing HB3 vs. Dd2 but also when comparing the CQS vs. CQR pfcrt transfectants created within the same genetic background. That is, remarkably, CQR conferring PfCRT mutations confer equal resistance to CQ regardless a CE vs. bolus schedule, and regardless the stage at which a bolus dose is administered.
Figure 1.

Determination of IC50 values for HB3 (A), Dd2 (B), C2GCO3 (C), and C4Dd2 (D) following either continuous exposure to CQ (CE, filled circles each panel) or 2 h bolus doses (diamonds and dashed line for 2hBR, triangles and dashed line for 2hBT, squares and dotted line for 2hBS). Percent survival (y axis) is parasitemia at (63 h + treatment) / (63 h for control). Error bars are omitted for clarity but are presented in Table 1. The data were fit to sigmoidal functions in ≤10 iterations of nonlinear regression analysis using SigmaPlot, R2 > 0.95 in each case.
Table 1. Summary of IC50 and Rf vs. Schedule.
Table of IC50 values calculated from data as in Figure 1 and resistance factors (Rf) computed vs. different dose schedules. For Rf calculations Dd2 is compared to HB3 and the control C2GCO3 transfectant is compared to the C4Dd2 transfectant created in the same genetic background. Each point on the curves shown in Figure 1 is the average of 3 separate experiments (e.g. 3 independent cultures) with 3 replicate counts (2 independent operators) done in each experiment, for a total of 9 determinations (+/− S.D.).
| IC50 | 48hCE | 2hBR | 2hBT | 2hBS |
|---|---|---|---|---|
| HB3 | 19.2 ± 0.78 | 543 ± 39 | 244 ± 19 | 605 ± 51 |
| Dd2 | 187 ± 9.5 | 5470 ± 488 | 2463 ± 308 | 6042 ± 380 |
| C2GCO3 | 20.0 ± 2.8 | 527 ± 46 | 257 ± 37 | 516 ± 45 |
| C4Dd2 | 149 ± 94 | 4266 ± 280 | 1779 ± 203 | 4309 ± 312 |
| Rf | 48hCE | 2hBR | 2hBT | 2hBS |
| Dd2/HB3 | 9.8 ± 0.49 | 10 ± 0.9 | 10 ± 1.3 | 10 ± .51 |
| C4Dd2/C2GCO3 | 7 ± 7.47 | 8.1 ± 0.53 | 6.9 ± 0.79 | 8.4 ± 0.60 |
Since CQR is conferred by PfCRT that resides in the mature DV membrane [36], and since a mature DV is not formed until early T [28] this result immediately led us to wonder about relative levels of PfCRT protein expression at R and S. As shown in Fig. 2, appreciable PfCRT is found in both R and S, thus PfCRT mediated CQR at R and S is indeed possible (see Discussion).
Figure 2.

Western blot analysis of PfCRT stage dependent expression, using a previously described specific polyclonal antibody [14]. Parasites were synchronized as described, and harvested at 0 hr (early rings) or hr 13 (late R / early T cycle n), 25 (late T), 31 (early S), 37 (segmented S), 48 (early R cycle n+1), 55 (mid - late R cycle n+1); Lanes 1 – 7, respectively, in the representative Western blot at the top. 10 µg parasite protein was added to each lane, and Western analysis for PfCRT was performed as described previously [14]. Five such analyses were done, the bands quantified by densitometry, and the averages are plotted for both Dd2 (open symbols) and HB3 (closed) parasites.
We next investigated the effect of increasing the length of bolus exposure times for R vs. T. Figure 3 compares CQ effects on R (panels A,B) and T (panels C,D) stages for HB3 (solid symbols A,C) and Dd2 (open symbols B,D) parasites vs. length of bolus exposure time. Time of exposure was (from the top) 5 – 7, 5 – 9, and 5 – 11 h for R (A,B), or 15 – 17, 15 – 19, and 15 – 23 h for T (C,D). Since the pre-segmentation phase of S is relatively short, an extended dose time comparison was not feasible for this stage. In Fig. 3, note [CQ] on the x-axes reflect similar relative bolus dose for HB3 (A,C) and Dd2 (B,D) (that is, similar fractions or multiples of relative bolus IC50 values, see Table 1). Interestingly, the CQ effect on R appears largely time-independent, whereas CQ effects on T are similarly time-dependent throughout the stage for both CQR and CQS parasites. However we note that HB3 parasitemia decreases more substantially vs. duration of T exposure than does Dd2 at similar dose (compare C vs. D) indicating that the T stage CQR mechanism is mildly time dependent.
Figure 3.

Relationship between different duration of exposure at variable bolus CQ dose vs. survival in the following cycle. Parasites were exposed to CQ starting at 5 h (beginning of R stage, panels A, B) or 15 h (beginning of T stage, panels C, D) after the last synchronization. Lengths of bolus exposures were 2 h (circles), 4 h (triangles) and 8 h (squares). Experiments were done using CQS parasites (HB3, panels A and C, filled symbols) and CQR parasites (Dd2, panels B and D, open symbols). The best fits were achieved through ≤ 10 iterations using logistic functions y= y0+a/(1+ (x/x0)b) in SigmaPlot. Each point is the average of two experiments (two independent cultures) done in duplicate by two different operators (4 determinations in total, +/− S.D.) We calculate that the trophozoite resistance factors (CQR IC50 / CQS IC50) are approximately 10 (see Table 1), 13, and 12 for parasites bolus treated for 2, 4 and 8 hrs, respectively.
One possible source of error in our quantification of survival induced by bolus CQ exposures could be cytostatic effects of CQ at these higher dosages relative to those typically used in CE. Thus we used Giemsa-stained smears to quantify stage populations for cultures treated with vehicle vs. CE IC50 or vs. BR, BT, BS IC50 doses (Fig. 4, Table 2). Representative analysis and curve fitting for control cultures in shown in Fig. 4, and results for drug-treated cultures are tabulated for HB3 and Dd2 vs. schedule in Table 2. Smears were taken every 3 h for 100 h and the percentages of the three stages within the population were fit by a sinusoidal equation (Fig. 4 caption). We find only minor changes in cell cycle kinetics upon BR, BT, BS and CE treatments (Table 2). Drug- treated parasites show minor phase delays in the stages following the treatment (that is, minor shifts in the times at which peak stage counts are calculated). No significant changes in the halfwidths of the stage peaks were observed for any of the drug treatments. All of the cultures fully developed into new R in cycle n+1 at approximately similar rate. Thus no significant cytostatic effects that arrest development at a particular stage were observed for these dosages and schedules. However, at doseages ≥ 3xIC50 (either CE, BR, BT or BS schedules) CQ is cytostatic and the cell cycle is halted for many parasites (data not shown). That is, 3xIC50 CE, BR or BT dose results in < 20 % of normal Hz production and arrest at the T stage, whereas 3xIC50 BS dose results in many unsegmented schizonts (no separation of new nuclei; BCG and PDR unpublished).
Figure 4.

Kinetics of the Dd2 cell cycle in the absence of CQ. Graphs show the number of rings (upper), trophozoites (middle) and schizonts (lower graph) counted in a population of 100 parasites. Data points were obtained ~ every 3 h and the best line fits were achieved in ≤ 12 iterations using sine wave functions: y = y0 +a sin(2πt/(f+φ)), where y0 is the offset, a the amplitude, f the halfwidth and φ the phase of the wave. Similar plots were obtained after bolus exposure of R, T, and S to CQ, as well as after CE to CQ (not shown; data summarized in Table 2). Each point is the average of two separate smears from two independent experiments counted by two independent operators, each smear counted in triplicate (6 determinations in total for each point, +/− S.D.).
Table 2. Summary of Calculated Cell Cycle Times vs. CQ Schedule.
Summary of minor differences in cell cycle time for Dd2 and HB3 in the absence of CQ (no drug) vs. after relative IC50 doses for 2 h in R, T, S stages or as an IC50 CE dose: (2hBR25x, 2hBT12x, 2hBS30x and 48hCE1x, respectively). Peak stage times (in hr) were calculated from the sinusoidal fits as shown in Fig. 4, and times between peaks for all 3 stages (i.e. [ring peak cycle n] - [ring peak cycle (n+1)]) were averaged to compute cell cycle time (+/− S.D.) for a given CQ schedule.
| cycle time (h) | HB3 | Dd2 |
|---|---|---|
| no drug | 44 +/− 1.2 | 42 +/− 1.6 |
| 2hBR25x | 44 +/− 1.0 | 43 +/− 1.1 |
| 2hBT12x | 47 +/− 1.8 | 46 +/− 2.0 |
| 2hBS30x | 43 +/− 1.2 | 41 +/− 1.4 |
| 48hCE1x | 48 +/− 1.7 | 46 +/− 1.3 |
In order to test whether bolus CQ treatments followed by triple washes have inadvertently left toxic amounts of accumulated or bound CQ within parasites we measured accumulation and possible retention upon these bolus treatments using [3H]- CQ. As shown in Table 3 the concentrations remaining for resuspended cells after three washes (see Methods) were several orders of magnitude lower than effective CE doses (e.g. 14 pM for BR treated HB3, whereas CQ CE IC50 for HB3 is 10 – 20 nM).
Table 3. Residual 3H CQ remaining in cell pellet and wash fractions.
Calculated [CQ] remaining in supernatant (sup 1) or successive washes (sup 2 – 4) after treating either CQS or CQR parasites with BR or BT doseages as described in Methods. CQR Dd2 was analyzed both at CQS and CQR IC50. After cells are washed and resuspended in fresh media as described in methods, residual CQ remaining after bolus dose and washing is orders of magnitude below toxic (bottom). Each value is the avg. of three experiments +/− S.D.
| strain | HB3 | HB3 | Dd2 | Dd2 | Dd2 | Dd2 |
|---|---|---|---|---|---|---|
| treatment | 2hBR | 2hBT | 2hBR | 2hBT | 2hBR | 2hBT |
| added CQ(nM) | 500 | 250 | 500 | 250 | 5000 | 2500 |
| sup 1 (nM) | 427+/−16 | 199+/−7 | 430+/−22 | 204+/−9 | 4589+/−99 | 2359+/−31 |
| sup 2 (nM) | 39+/−4 | 18+/−8 | 34+/−12 | 18+/−4 | 276+/−33 | 191+/−36 |
| sup 3 (nM) | 6.1+/−0.4 | 5.6+/−1.1 | 6+/−1.0 | 7+/−1.7 | 29+/−4.5 | 27+/−5.3 |
| sup 4 (nM) | 3.4+/−0.3 | 2.5+/−0.6 | 3.1+/−0.4 | 4.5+/−0.8 | 5.7+/−0.2 | 9.7+/−1.1 |
| resuspended pellet (pM) | 14+/−8 | 18+/−7 | 7+/−3 | 9+/−3 | 71+/−8 | 86+/−5 |
Currently favored models for the mechanism of CQ action all include interaction with FPIX monomers or dimers released upon Hb catabolism, or capping of the Hz crystal formed from FPIX [17,18]. In order to compare how Hz formation might be inhibited by bolus vs. CE CQ treatments, we used in situ 3D Hz imaging methodology developed previously [1]. Previously, increases in Hz volume for live parasites were measured vs. relative CQ CE IC50 and 2 × CE IC50 values ([1], Figure 5). We now find that inhibition of Hz growth is clearly more significant for 2hBT treated cultures (Fig. 5 panels C,D) vs. 2hBR (panels A,B), with inhibition for CE treated cultures (solid squares, each panel) exposed to similar relative IC50 being in between these two levels [1]. Similar trends are seen for both CQS (Fig. 5 panels A,C) and CQR (B,D) parasites treated at similar multiples of either relative bolus or relative CE IC50 (Table 1).
Figure 5.

Hz growth curves (Hz volume vs. time, see [1]) for HB3 (A, C) or Dd2 (B, D) parasites in the absence of CQ (filled circles, solid lines A, B, C, D), during continuous exposure to CQ (filled squares, dotted lines, A, B, C, D) or after bolus doses of CQ (empty symbols, dashed lines). Empty symbols represent similar relative bolus 1×IC50 doses (triangles) or 2×IC50 doses (diamonds) for 2hBR (A, B) and 2hBT (C, D). Data were well fit to sigmoidal functions after ≤ 10 iterations. Each point is the average of three experiments, with > 20 independent parasite Hz volumes calculated in each experiment (> 60 determinations in each case). Standard deviation for steady state (plateau) Hz volumes calculated from these data are not shown here (for clarity), but are summarized in Fig. 9.
This result is in apparent disagreement with the proposal by us and others that the extent of Hz growth inhibition is correlated with survival in cycle n+1 (see [1] and references within). That is, since doses based on relative IC50 values are used in these different treatments (e.g. the same net reduction in parasitemia at the beginning of cycle n +1 is conferred) then we expect the same degree of Hz growth inhibition (e.g. for 1 × IC50 BR vs. 1 × IC50 BT) . Since this is not observed, we conclude there must either be additional molecular pathways for CQ toxicity, or that Hz inhibition produces toxic by products that have stage-specific effects.
To further investigate these possibilities, and because of previous suggestions that CQ pharmacology might involve interaction with nucleic acid, we developed a novel rapid approach for quantifying the number of new nuclei inside live, segmented, intraerythrocytic schizonts (Fig.6). Essentially, we use iteratively deconvolved SDCM 3D reconstructions of SYBR Green I labeled parasites [29] to rapidly image new nuclei for live cells (see Methods and Fig. 6 caption). To our knowledge, this is the first attempt to systematically quantify nuclei counts inside large numbers of living schizonts after antimalarial drug exposure.
Figure 6.

(A, B) DIC and overlay of DIC and fluorescence images of a single optical z-section of a SYBR Green stained, live schizont obtained by SDCM; (C–F) Illustration of image rendering: 3D reconstruction of 25 z-sections can be rotated in space and viewed from any angle (movies available from the authors). Blue spheres (D,E,F) are assigned to each of the nuclei using mean nuclei volumes as cutoff values, as described in the text.
Figure 6 is an illustration of our data reconstruction and processing approach. We locate (A) and verify (B) the segmented schizont using DIC and fluorescence capabilities of SDCM as described [1,28]. Via DIC we clearly observe merozoites which surround optically dense plateau Hz situated in the center of the cell (Fig. 6A). Although of good resolution, these 2D images do not reliably resolve the total number of merozoite nuclei positioned in different focal planes. After switching to fluorescence mode and collection of a full stack of 0.20 µm “z slices” in 2D, followed by assembly and iterative deconvolution [28], the 3D image showing Sybr Green stained nuclei is restored (C). After calibrating background, contrast and peak maxima of fluorescence intensity in the 3D restoration (see Methods), we assign nuclei inside a living schizont using the “spots” routine (panel D,E,F see Methods) and known nuclear volume (see below). Proper assignment is confirmed visually through inspection of the 3D image rotated in space (D–F). Importantly, in contrast to a serial electron microscopy approach, acquisition of the entire reconstructed SDCM z stack is done in seconds and quantification of nuclei for an individual parasite is done in minutes. This allows for practical, statistically reliable, analysis of drug effects on parasite DNA replication.
By quantifying nuclei for hundreds of schizonts, we find that CQ exposure has important effects on the average number of nuclei (N; Fig. 7A,B) as well as the distribution of N within a population (Fig. 7C – H). Note that N on the x-axes for panels C – H is the result of binning of the data (see Discussion), but that we did observe schizonts that contain N ≠ 4x ; where x is an integer ≥ 2, ≤ 9 (described in Discussion). Fig. 7A,B compares avg N values for HB3 and Dd2 cultures not exposed to CQ (black bars) and exposed to CQ at different stages (2hBR, open bars; 2hBT, hashed bars; see also Table 4). The data show a decrease in Navg for the CQ- treated parasites (Fig. 7A,B) of about 25 % for both CQS (A) and CQR (B) parasites treated with similar effective dose (similar IC50). Data shown are for HB3 (CQS) and Dd2 (CQR) parasites, similar data were obtained for CQS and CQR transfectants (C2GC03 and C4Dd2 ; data not shown). Interestingly, in contrast to Hz inhibition, the relative decrease is approximately the same for both BR and BT treated cultures. A similar ~ 25% decrease in Navg for both CQS and CQR parasites is also seen upon IC50 CE treatment (not shown). We also find a previously unreported difference between Navg for control HB3 vs. Dd2 cultures. While the control HB3 culture has ~18 nuclei per schizont, Dd2 has ~22. Panels C and D show that the CQS and CQR parasites, along with having different Navg, also have different Nmax and Nmin. The range of N (Nmax-Nmin) is shifted towards higher values for the CQR parasites. Additional analyses with many more CQS vs. CQR parasites will be needed to test whether these features are generally characteristic of a CQR phenotype.
Figure 7.
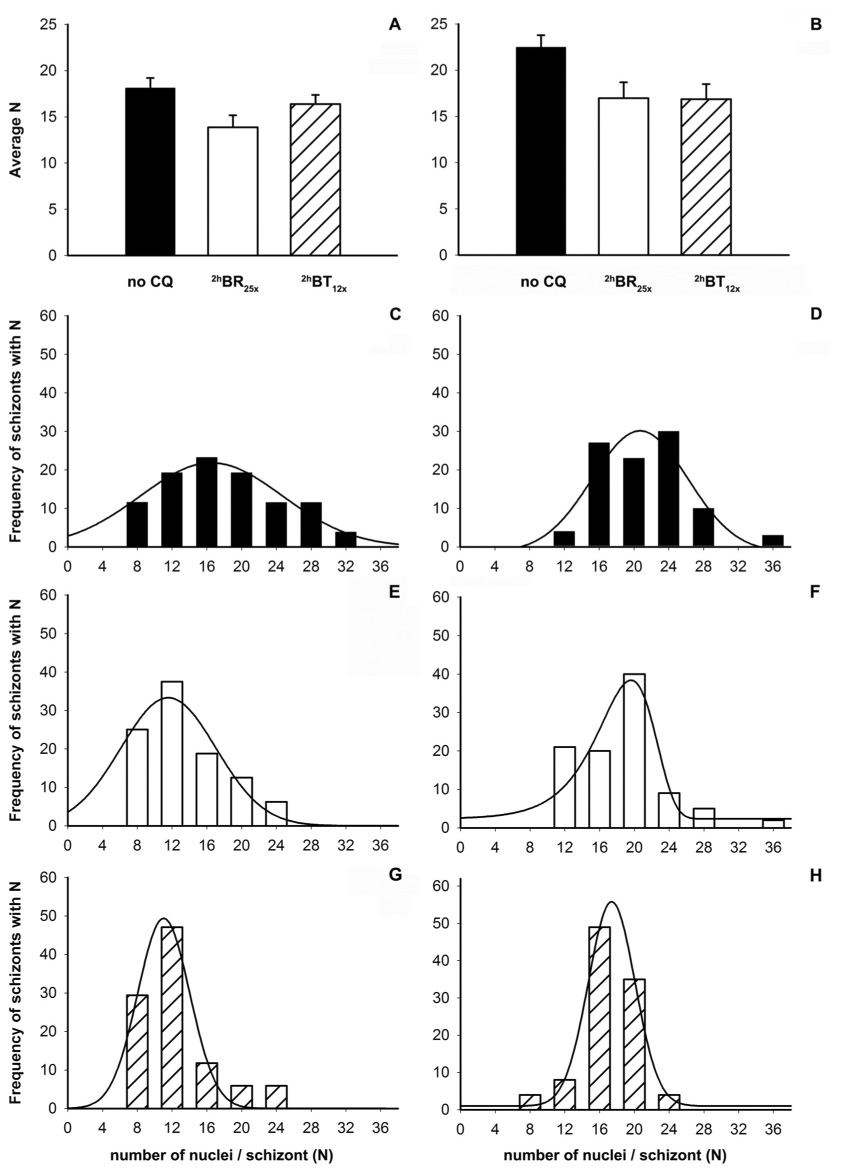
CQ treatment induces a change in the numbers of nuclei per schizont (N). Data is shown for HB3 (left; A,C,E,G) and Dd2 (right; B,D,F,H). (A, B) Comparison of average N in the absence of CQ (solid black bars) or after treatment with bolus IC50 doses, 2hBR25x (open bars) and 2hBT12x (hatched bars). (C – H) Distribution of N in the absence of CQ (black bars, panels C and D) or after bolus treatments with CQ (2hBR25x: white bars and panels E, F; 2hBT12x: shaded bars and panels G, H). IC50 CE exposure for both HB3 and Dd2 reduces Navg similar to either bolus treatment (not shown). In panels C – H binning was done by rounding odd N to the nearest multiple of 4 and adding rare N = 2 x counts to the larger of neighboring N = 4 x. Data from 3 experiments (3 independent cultures) were combined to yield nuclei counts for 100 parasites in each case. With the exception of panel F, distributions in C – H were fit to a simple Gaussian function y = a e(−0.5((x-x0)/b)2) after < 10 iterations. Data in F were well fit to a Weibull function after 12 iterations.
Table 4. Schizont Nuclei Counts and Distributions.
Summary of CQ effects on N distribution in HB3 and Dd2 (see text). Fmax is the calculated value of N at the distribution peak maximum (calculated from the mathematical fits described in the caption to Fig. 7) and (Nmax-Nmin) is the width of the distribution.
| strain | treatment | Navg | Fmax | Nmax | Nmin | Nmax-Nmin |
|---|---|---|---|---|---|---|
| HB3 | no drug | 18.1 +/− 1.1 | 16.5 | 32 | 8 | 24 |
| HB3 | 2hBR25x | 13.9 +/− 1.3 | 11.6 | 24 | 8 | 16 |
| HB3 | 2hBT12x | 16.3 +/− 1.0 | 11.1 | 24 | 8 | 16 |
| Dd2 | no drug | 22.5 +/− 1.3 | 20.7 | 36 | 12 | 24 |
| Dd2 | 2hBR25x | 17.0 +/− 1.7 | 19.7 | 36 | 12 | 24 |
| Dd2 | 2hBT12x | 16.9 +/− 1.6 | 17.5 | 24 | 8 | 16 |
Fig. 7 panels C – H also reveal different changes in N distribution for 2hBR vs. 2hBT treated parasites. For 2hBT12x cultures (hashed bars), the distributions are shifted to a slightly lower range relative to 2hBR25x (open bars). Much lower Nmax is observed in both CQS and CQR 2hBT12x cultures (compare panels G,H to C,D) but only in CQS after 2hBR25x (panels C,E vs. D,F). Upon fitting these histograms, calculated peak maxima (Fmax) for CQS go from 16.5 in control to 11.1 – 11.6 in treated cultures, and from 20.7 in control and 19.7 in 2hBR25x to 17.5 in the 2hBT12x culture for Dd2 (Table 4). There was no change in Fmax, Navg or N distribution for either cycle n or n+1 following 2hBS30x (Data not shown). Figure 8 plots calculated nuclei volume vs. N for many schizonts and illustrates that the mean size of the nuclei is independent of total N measured for either CQS or CQR.
Figure 8.

Plot of nuclear volume (µm3) vs. number of nuclei with a given specific volume (frequency) for schizonts that either have N ≤ 20 (A) or N > 20 (B) . The mean volume of nuclei does not vary as N changes. Volume measurements were done using 100 Dd2 schizonts from 3 separate cultures. Distributions were plotted using simple Gaussian function y = ae (− 0.5((x-x0)/b)2) in SigmaPlot; fits were achieved after < 10 iterations.
Figure 9 summarizes these and two additional CQ effects measured for CQS (left hand side panels) vs. CQR (right hand side) parasites. Decreased parasitemia at 63 h (A, B) reemphasizes that the doses we use are similar effective doses regardless the schedule of administration (plots for CE, BR and BT overlap). The Hz formation process is, as mentioned, less inhibited via lower dose BR vs. BT treatment (Figure 9 C,D) and Navg is similarly decreased via the different treatments (E,F). Also, by counting parasitemia at 55 h as well as at 63 h, we report two additional effects of CQ that are apparently dose- and schedule-dependent; namely, the partial loss of infectivity of merozoites in the CQ- treated cultures (Figure 9 G,H) and a “decay” in successful parasite development during intraerythrocytic cycle n+1 (Figure 9 I,J). Infectivity rates for newly released merozoites depend on multiple factors including temperature, hematocrit, starting parasitemia and freshness of RBCs. After eliminating these as variables (see Methods), we calculated precise infectivity using known Navg (Fig. 7 panels E,F). Under the controlled culture conditions used in this work we measure infectivity in control (drug-free) cultures to be ~ 0.16 for CQS and CQR strains and note that this decreases vs. [CQ] in a schedule independent fashion for Dd2 (Fig. 9, H). A slightly more significant effect on infectivity vs. CE dose is seen for HB3 parasites (Fig. 9, G, compare circles to diamonds, triangles).
Figure 9.

Summary of CQ effects for HB3 (open symbols, left column) and Dd2 (filled symbols, right column) parasites treated at multiples of relative 2h bolus R (diamonds) or 2h bolus T (triangles) IC50, or multiples of relative CE IC50 (circles). Meaning, the x axes in each panel are presented in relative IC50 units, which vary in an absolute sense for bolus ring vs. bolus troph vs. CE treatments (c.f. Table 1). Effects summarized are: survival at 63h (A, B), Hz volume at steady state (C,D), Navg (E,F), infectivity of merozoites (G,H) and decay in parasitemia in cycle n+1 (I,J). Infectivity was calculated using the formula: I= (P55h –P0h)/NP0h, where P is parasitemia and N = avg number of nuclei; for control cultures I was measured to be 0.16 +/− 0.02 for both CQR and CQS strains. Survival at 63h +/− S.D. (A,B) and decay in parasitemia +/− S.D. (I,J) present data combined from Fig.1, 2. Hz volumes, Navg, and infectivity (+/− S.D.) represent data from either 3 (for 1 or 2×IC50) or 2 (for 0.5 or 3×IC50) separate experiments (see captions to Fig. 5, 7, 1 and 3 respectively).
Interestingly, for drug-treated cultures we find that the ratio of parasitemia at 63 h (T) vs 55 h (R) in cycle n+1 is conspicuously < 1 regardless the CQ schedule. That is, bolus and CE drug exposures both appear to degrade parasites at the R:T transition in cycle n+1. This phenomenon of “delayed death” has been reported previously [27, 37] and is hypothesized to be a result of improper apicoplast replication and assignment.
Taken together, the above results are quite surprising. One explanation for some of the results is that Hb metabolism and Hz formation for the intraerythrocytic parasite might begin earlier and continue later than is generally believed. To inspect this possibility, transmission electron microscopy (TEM) and immuno TEM using an anti – Hb antibody were pursued using well synchronized ring and schizont samples (Figure 10A,B). For the ring stage a bi-lobed nucleus is regularly seen in the light microscope as a ring with two dots. This is also seen by TEM (Figure 10A). Also in this image, the ring clearly contains several small vacuoles harboring Hz (inset panels upper left hand side) demonstrating that ring-stage parasites are actively taking up and digesting Hb. The Hz crystals seen in this ring are too small to be resolved by a light microscope. Not coincidentally then, many much earlier definitions of the ring stage as an intraerythrocytic parasite that does not contain Hz were made when stage of development was typically defined by light microscopy, and before highly synchronized culture conditions were perfected.
Figure 10.

Panel A shows a TEM section of a ring stage parasite. The bi-lobed nucleus is labeled N, the hemozoin containing vacuoles are labeled Hz and the Red Blood Cell is labeled RBC. The inset panels in the upper left are images from other sections of this parasite all showing electron dense hemozoin. Panel B shows an anti-hemoglobin immuno-TEM section of a segmenting schizont stage parasite. A cytostome (Cyt), the digestive vacuole (DV), nucleus (N), Red Blood Cell cytosol (RBC) and two rhoptries (R) are labeled. The inset panel (center right) shows a hemoglobin containing vacuole from other sections of this parasite. In A and B scale bars are 0.5 µm. The serial stacks from which these two images were taken can be found at http://www.doctorelliott.us/paper_figs/roepe.html.
The schizont immuno TEM image obtained using gold labelled anti – Hb antibody (Figure 10 B) shows a parasite undergoing segmentation, as confirmed by the developing conoide in the lower left of the image as well as well as the two rhoptries (other serial sections show additional conoides [data not shown]). The clearly visible cytostome (upper left) is one of two found in this parasite. The inset panel shows a Hb containing vacuole. The presence of Hb is confirmed by the gold particles, which are of similar density as those labeling the RBC cytosol outside of the parasite. Taken together, these observations indicate that Hb is likely being actively taken up by parasites at R and S, and that micro crystalline Hz is formed early on in the intra erythrocytic cycle.
DISCUSSION
Relatively few studies have quantified the stage specificity of CQ action, and none have directly compared CQS vs. CQR parasites to test whether drug resistance is stage specific. In this study, for the first time to our knowledge, precise CQ IC50 vs. consistent stage specific dosing schedules were quantified for both laboratory and transfectant model CQR vs. CQS malarial parasites. This is necessary if effects dependent on the dosing schedule are to be compared for multiple strains with different intrinsic CQ sensitivities (i.e. comparative investigations require relative IC50 doses). We note that the bolus dosing concentrations of CQ used in this work (typically 250 – 500 nM for HB3, and 2.5 – 5.0 µM for Dd2) are not far from peak plasma [CQ], which during treatment with CQ can exceed 1 µM [38,39]. We calculate that for both CQS and CQR parasites CQ IC50 for T is only ~2 fold lower compared to R or S exposed to CQ for a similar 2 h period. Controls showed that changes in the kinetics of the cell cycle due to bolus drug exposure are minor and that drug remaining in the parasites after bolus treatments is orders of magnitude lower than toxic concentrations. We therefore conclude that CQ is similarly toxic to R, T, and S. By calculating explicit IC50 for CQS vs. CQR parasites we also conclude that the CQR mechanism mediated by mutated PfCRT is equally active at R, T and S. Calculated resistance factors (CQR IC50 / CQS IC50) are all approximately 10 at R,T and S, and are independent of bolus dose duration for T. The data in this paper suggest that CQR parasites are resistant to 4 distinct effects of CQ, at least 2 of which we now describe for the first time: 1) previously well described inhibition of Hz formation; 2) decrease in N for segmented schizonts; 3) decrease in absolute infectivity; 4) “delayed death” expressed as 63h / 55h parasitemia.
These are surprising results with a number of important implications. Until now, CQR in P. falciparum has only been measured by CE experiments, which obviously do not distinguish between stage dependent effects of the drug. Yet, PfCRT mutations cause CQR, PfCRT is localized primarily to the DV membrane, a fully formed DV is not present in the R stage, and the DV is the principal site of CQ accumulation and Hb digestion. These observations, along with in vitro data showing that CQ binds to heme released during Hb digestion and recognition that Hb digestion and heme release is completed prior to schizogony, has led most malarial pharmacologists (including ourselves) to conclude that CQ action and CQR must be fairly trophozoite specific. Some earlier studies support that notion but others do not. Although when controlled for similar time of exposure T is indeed 2 fold more sensitive, the relatively small difference between T, R and S is remarkable and indicates very important CQ “targets” or CQ – inhibitable pathways manifested specifically at the R and S stage have gone largely unexplored.
Therefore these findings also force a rethinking of the CQR mechanism, and the role of PfCRT in conferring CQR. It remains reasonable to propose that a large contribution to CQR is due to disruption of toxic CQ – heme interactions within the DV during T. The disruption of CQ – heme interactions in T is thought to be due to either CQ transport from the DV [19, 40], disrupted heme – Hz chemistry and heme – CQ binding due to altered DV volume and pH [28], or perhaps some combination [19,28]. Not coincidentally, current models for PfCRT include drug transport, ion transport, or both [19, 20, 28, 40, 41]. However, can these models for PfCRT explain the nearly equal levels of CQR for R and S now quantified by these bolus dose experiments ?
Since Western blot data show the presence of considerable PfCRT at R and S, we believe that, in general, solute – ion transport model(s) could explain R and S CQR, assuming specific interpretations of two as yet unresolved aspects of intraerythrocytic P. falciparum cell biology. The first is that Hb digestion and Hz formation begins earlier than is typically cited (as early as 5 h post invasion) and the second is that the DV remains intact, with some degree of active pH regulation, for pre-segmented schizonts. The former has been controversial, and the latter has (to our knowledge) not been examined. However, with regard to the former, some e.m. data (e.g. Fig. 10) suggest Hz is formed early on during the ring stage (see also [11]). With regard to the latter, we note that control experiments in our earlier work [28] indicated that Oregon green – dextran labeling of the DV remains intact well into schizogony (35 – 37 h). Thus, although we have not yet measured precise pH gradients for the DV at this stage of development, the DV membrane is indeed intact for pre-segmented schizonts. Therefore, CQ likely still accumulates in schizont DV and if this is the case then mutant PfCRT clearly present at S (Fig. 2) may still lower that accumulation. This could then provide a simple explanation for CQR at S. However, the basis of CQ toxicity at S is unclear since Hz formation has plateaued and appreciable pre-crystalline heme is therefore not available to interact with CQ. We could propose that CQ disrupts preformed Hz present at S, releasing toxic heme or heme drug conjugates, but earlier inspection of this possibility for trophozoites [1] indicates that preformed Hz is not destabilized by even very high levels of CQ. That is, the heme-based toxicity of CQ can only be observed while Hz is being synthesized. Since glutathione levels have been suggested to contribute to CQR and since Dd2 parasites apparently contain elevated total glutathione [42] perhaps other reactive species generated by CQ in the S DV are the basis of CQ toxicity at S. Alternatively, although much work remains to be done, our data (Fig. 10) also support minor, but continued, Hb metabolism in S. Hz microcrystals made in S that are unresolvable by optical microscopy (Fig. 5) might provide part of the explanation for stage independent CQR.
R toxicity and R CQR can be explained via the same features typically invoked to explain T CQR if we envision that pre-DV vesicle structures whose membranes contain PfCRT and within which Hb catabolism begins, are indeed present early in the cell cycle as previously hypothesized [33,43,44]. The precise timing of the first appearance of these vesicles remains obscure, but several electron microscopy-based studies have pointed to either pinocytotic “pre DV” vesicles and / or vesicles pinched off of the tubular cytostome as harboring electron dense material suggestive of heme aggregates or small Hz microcrystals [11,44]. E.M. data in this paper supports this as well. These pre DV Hb – digesting vesicles obviously merit additional close study.
Regardless the attractiveness of these ad hoc general explanations, there remain some unique and important facets to R toxicity and R CQR vs. T CQR that cannot necessarily be explained with current data or theory. For example, R toxicity does not appear to be time-dependent and in contrast to T CQR, we find that R CQR is also not time-dependent (Figure 3). This either indicates that the concentration of CQ at the site of action drops precipitously as R continues to develop, or that there is a very high affinity for a low, fixed abundance CQ target in R. If we assume the target is low amounts of heme or microcrystalline Hz in pre DV vesicles, the later possibility is perhaps reasonable, but to explain R toxicity that is only 2 fold lower than T (during which massive free heme is released [1]), we would need to conclude that CQ – heme complexes formed for R are proportionally more toxic (or promote more cellular damage over a longer period of time) relative to CQ – heme complexes formed for T.
It is striking that a reduction in schizont nuclei is now also defined to be a result of CQ toxicity, and that this occurs regardless whether CQ is administered at R, T or S. As CQ disturbs Hz formation primarily by acting on heme and heme-related compounds, reactive oxygen species created as a result of this chemistry might be damaging DNA or DNA replication machinery, and therefore indirectly decrease the amount of the DNA formed during S. This explanation also requires early Hb catabolism in R. Alternatively the explanation could be more complicated, and involve yet undescribed interactions between CQ (or CQ – heme conjugates) and cyclins or other molecules that regulate the poorly understood nuclear division during S, or perhaps even direct interaction between DNA and CQ or CQ – heme adducts [2–9].
Regardless, the live cell nuclear imaging methodology we develop in this study will be useful. To date, there have been no published reports that quantify the number of nuclei for large numbers of live P. falciparum schizonts or that link growth conditions or drug exposure to the physiology of their DNA replication. Several papers report a wide range of different N per schizont, but some of these merely repeat previous literature statements without significant additional data (eg. N= 6–32 [45], N= 16–32 [46,47], N= 8–32 [48,49], N= 8–24 [50,51], N= 3–24 [52]. With regard to these previous data, the methods used most often have been light microscopy on Giemsa labeled smears of dehydrated, fixed and flattened cells. Another approach would be similar to a study by Fritsch et al. using electron and light microscopy to observe differences in Theileria annulata merozoite numbers after drug exposure [53]. However, two-dimensional counting is an imprecise and certainly very tedious method. Based on thickness estimates of slightly bloated iRBC (~4.5 µm) and the average diameter of a merozoite (1.5 µm) calculated based on our 3D reconstructions, we conclude that schizonts can contain up to three superimposed merozoite nuclei along the vertical z-axis. The nuclei positioned in the lower focal planes are either completely hidden by the upper planes or may appear as one larger nucleus.
In our nuclei counts, approximately 1 in 12 values of N were not multiples of 4, and ~ 1/2 of those were = 4x + 2 (2 ≤×≤ 8). For those that are a multiple of 4 +/− 1, some of these counts could in theory be due to some imprecision in our new method. That is, “bi lobed” nuclei that based on calculated volume are assigned to be 2 nuclei might in fact be only 1 that is arrested or malformed during segmentation. Alternatively, our resolution is indeed quite high (~200 nm in x,y and ~ 240 nm in z [28]), but when the nuclei are tightly packed in 2–3 layers along the z- axis, nuclei in the layer farthest from the coverslip could appear dimmer and in very rare cases perhaps go unassigned. However, we note that more than 1/3 of our nuclei counts that are not multiples of 4 (among many hundreds of fully segmented schizonts and using multiple strains) are multiples of 4 plus 2. The point being that, even assuming the rare inaccurate count due to missing 1 nucleus as described above, these 4x + 2 counts would still result in N ≠ 4x.
Other studies have previously reported N ≠ 4x in P. falciparum, but for whatever reasons (presumably the difficulty inherent to 3D reconstructions on this scale) further inspection of this important concept for hundreds of schizonts appears to have been somewhat overlooked. Oddly then, it is often assumed that all N are multiples of 4, ≥8 and ≤ 36, perhaps because of vague similarities between nuclear division in schizogony vs. meiosis. Alternatively, schizogony might be more similar to endo reduplication (e.g. for trophoblastic “giant” cells) wherein the haploid genome is asynchronously duplicated multiple times, with some nuclei dividing and others not. Aspects of both could be relevant such that only a partial bias to N = 4x is realized. On the other hand, Read et al. reported similar frequencies for any integer in the range 8–18 [52], but as mentioned these counting methods were likely imprecise. More recently, Van Dooren et al. studied endoplasmic reticulum, apicoplast and mitochondrion development during the blood cycle in P. falciparum, and via scanning confocal microscopy of Hoechst 33258 labeled segmenters postulated three substages in 3D reconstructions of schizonts: 2– 5 nuclei (early), 5–10 (middle) and > 10 (late) phase of schizogony [37]. Because of lack of 3D resolution these counts were only estimates, but together with the present data they support the possibility of nuclear division resulting in N ≠ 4 x. Precise and accurate histograms of N for many strains under many conditions are now possible via these SDCM methods, and so the statistics of nuclear division during schizogony can eventually be clearly defined. This will help elucidate the curious DNA replication process for intraerythrocytic P. falciparum.
We observed no cytostatic effect on any of the treated cultures up to 3 times IC50. Starting at 48–52 h, regardless the schedule or dose, all parasites enter a new cycle and are thus in R stage. This result has essentially been observed previously by Krishna and colleagues [27] and recently also noted by Maerki et al. [54]. We suspect that due to signals that terminate the cell cycle, schizonts of the cultures treated at high CQ concentrations cannot complete the S phase of the cell cycle. This last point clearly merits additional study with complementary approaches, including analysis of mutants or knockouts of genes encoding signaling proteins suspected to influence schizogony vs. invasion.
We note CQ causes a previously unrecognized “delayed death” effect reminiscent of antibacterial drugs that target the apicoplast ribosome as well as apicoplast fatty acid synthesis inhibitors. There are reports that suggest decay of parasitemia in cycle n+1 during the R:T transition can be caused by improper apicoplast segmentation during early schizogony [37, 55]. Normally, one new nucleus pairs with each new apicoplast during schizont segmentation. Defective daughters lacking an apicoplast might invade normally and initially appear viable, but delayed death is realized when further development requires fatty acids or heme synthesized via apicoplast enzymes. It should prove useful then to assess apicoplast functions for parasites treated as described in this paper. Importantly, CQR parasites are resistant to “delayed death”, just as they are resistant to decreased Navg (at similar absolute dose of CQ). A key issue for further study is determining whether these facets of CQR parasite cell biology are indirect consequences of reduced Hz inhibition at both R and T, or whether they represent new molecular pathways to which mutant PfCRT contributes in unknown ways.
In sum, using the fast, semi-automatic nuclei counting method presented, future studies will be better able to rapidly probe differences in drug resistance phenotypes and nuclear replication mechanisms for intracellular parasites. The new nuclei counting method we describe above cannot in and of itself define the mechanism of CQ inhibition of nuclei formation, but it is arguably the easiest and most precise way to currently quantify this parameter for living parasites following drug treatments, gene knockouts, etc. Also, clearly, neither CQR nor CQ action can be fully explained using a simple trophozoite or mature DV localized target model. It is reasonable to suspect the same for other quinoline – based antimalarial drugs. Exploration of stage specificity of other putative heme-targeted antimalarials will be another critical tool in the elucidation of multidrug resistance mechanisms.
Acknowledgements
We thank Drs. Jeff Urbach and Ryan McAllister (Georgetown University) for helpful conversations and help with SDCM measurements, and Dr. David Fidock (Columbia University) for transfectants. This paper is dedicated to the memory of Dr. J. Dvorak.
Footnotes
Publisher's Disclaimer: This is a PDF file of an unedited manuscript that has been accepted for publication. As a service to our customers we are providing this early version of the manuscript. The manuscript will undergo copyediting, typesetting, and review of the resulting proof before it is published in its final citable form. Please note that during the production process errors may be discovered which could affect the content, and all legal disclaimers that apply to the journal pertain.
Supported by NIH grants AI045957 & AI052312 to P.D.R.
Abbreviations: BR, (short) bolus exposure during ring stage; BS, (short) bolus exposure during schizont stage; BT, (short) bolus exposure during trophozoite stage; CE, continuous exposure; CQ, chloroquine; CQR, chloroquine resistance (resistant); CQS, chloroquine sensitive; DIC, differential interference contrast; DV, digestive vacuole; FPIX, ferriprotoporphyrin IX; Hb, hemoglobin; SDCM, Spinning Disk Confocal Microscopy; 4D, four dimensional (3D vs. time); Hz, hemozoin; IM, incomplete media; iRBC, infected red blood cell; LSCM, laser scanning confocal microscopy; n, cell cycle in which parasites were exposed to drug; N, number of nuclei inside one schizont; PBS, phosphate buffered saline; PfCRT, Plasmodium falciparum chloroquine resistance transporter; R, ring stage; RBC, red blood cell; Rf, resistance factor; S, schizont stage; SCP, single cell photometry; T, trophozoite stage.
Quicktime movies that rotate 3D data sets of the SYBR Green I labeled schizonts on the x, y, and z axes are available as supplemental data from the authors.
BIBLIOGRAPHY
- 1.Gligorijevic B, McAllister R, Urbach JS, Roepe PD. Spinning disk confocal microscopy of live, intraerythrocytic malarial parasites. 1. Quantification of hemozoin development for drug sensitive versus resistant malaria. Biochemistry. 2006;45:12400–12410. doi: 10.1021/bi061033f. [DOI] [PubMed] [Google Scholar]
- 2.Irvin JL, Irvin EM, Parker FS. The interaction of antimalarials with nucleic acids. Science. 1949;110:3. doi: 10.1126/science.110.2860.426. [DOI] [PubMed] [Google Scholar]
- 3.Parker FS, Irvin JL. The interaction of chloroquine with nucleic acids and nucleoproteins. The Journal of Biological Chemistry. 1952;199:897–909. [PubMed] [Google Scholar]
- 4.Cohen SN, Yielding KL. Inhibition of DNA and RNA polymerase reactions by chloroquine. Proceedings of the National Academy of Sciences of the United States of America. 1965;54:521–527. doi: 10.1073/pnas.54.2.521. [DOI] [PMC free article] [PubMed] [Google Scholar]
- 5.Ciak J, Hahn FE. Chloroquine: mode of action. Science. 1966;151:347–349. doi: 10.1126/science.151.3708.347. [DOI] [PubMed] [Google Scholar]
- 6.O'Brien RL, Olenick JG, Hahn FE. Reactions of quinine, chloroquine, and quinacrine with DNA and their effects on the DNA and RNA polymerase reactions. Proceedings of the National Academy of Sciences of the United States of America. 1966;55:1511–1517. doi: 10.1073/pnas.55.6.1511. [DOI] [PMC free article] [PubMed] [Google Scholar]
- 7.Kwakye-Berko F, Meshnick S. Sequence preference of chloroquine binding to DNA and prevention of Z-DNA formation. Molecular and Biochemical Parasitology. 1990;39:275–278. doi: 10.1016/0166-6851(90)90066-u. [DOI] [PubMed] [Google Scholar]
- 8.Meshnick SR. Chloroquine as intercalator: a hypothesis revived. Parasitology Today. 1990;6:77–79. doi: 10.1016/0169-4758(90)90215-p. [DOI] [PubMed] [Google Scholar]
- 9.Allison JL, O'Brien RL, Hahn FE. DNA: reaction with chloroquine. Science. 1965;149:1111–1113. doi: 10.1126/science.149.3688.1111. [DOI] [PubMed] [Google Scholar]
- 10.Fitch CD. Chloroquine resistance in malaria: a deficiency of chloroquine binding. Proceedings of the National Academy of Sciences of the United States of America. 1969;64:1181–1187. doi: 10.1073/pnas.64.4.1181. [DOI] [PMC free article] [PubMed] [Google Scholar]
- 11.Aikawa M. High-resolution autoradiography of malarial parasites treated with 3 H-chloroquine. The American Journal of Pathology. 1972;67:277–284. [PMC free article] [PubMed] [Google Scholar]
- 12.Yayon A, Cabantchik ZI, Ginsburg H. Identification of the acidic compartment of Plasmodium falciparum-infected human erythrocytes as the target of the antimalarial drug chloroquine. The EMBO Journal. 1984;3:2695–2700. doi: 10.1002/j.1460-2075.1984.tb02195.x. [DOI] [PMC free article] [PubMed] [Google Scholar]
- 13.Orjih AU, Fitch CD. Hemozoin production by Plasmodium falciparum: variation with strain and exposure to chloroquine. Biochimica et Biophysica Acta. 1993;1157:270–274. doi: 10.1016/0304-4165(93)90109-l. [DOI] [PubMed] [Google Scholar]
- 14.Fidock DA, Nomura T, Talley AK, Cooper RA, Dzekunov SM, Ferdig MT, Ursos LM, Sidhu AB, Naude B, Deitsch KW, Su XZ, Wootton JC, Roepe PD, Wellems TE. Mutations in the P. falciparum digestive vacuole transmembrane protein PfCRT and evidence for their role in chloroquine resistance. Molecular Cell. 2000;4:861–871. doi: 10.1016/s1097-2765(05)00077-8. [DOI] [PMC free article] [PubMed] [Google Scholar]
- 15.Leed A, DuBay K, Ursos LM, Sears D, De Dios AC, Roepe PD. Solution structures of antimalarial drug-heme complexes. Biochemistry. 2002;41(32):10245–10255. doi: 10.1021/bi020195i. [DOI] [PubMed] [Google Scholar]
- 16.de Dios AC, Casabianca LB, Kosar A, Roepe PD. Structure of the amodiaquine-FPIX mu oxo dimer solution complex at atomic resolution. Inorganic Chemistry. 2004;43(25):8078–8084. doi: 10.1021/ic0489948. [DOI] [PubMed] [Google Scholar]
- 17.Sullivan DJ, Jr, Gluzman IY, Russell DG, Goldberg DE. On the molecular mechanism of chloroquine's antimalarial action. Proceedings of the National Academy of Sciences of the United States of America. 1996;93:11865–11870. doi: 10.1073/pnas.93.21.11865. [DOI] [PMC free article] [PubMed] [Google Scholar]
- 18.Goldberg DE. Hemoglobin degradation. Current Topics Microbiology & Immunology. 2005;295:275–291. doi: 10.1007/3-540-29088-5_11. [DOI] [PubMed] [Google Scholar]
- 19.Zhang H, Paguio M, Roepe PD. The antimalarial drug resistance protein Plasmodium falciparum chloroquine resistance transporter binds chloroquine. Biochemistry. 2004;43:8290–8296. doi: 10.1021/bi049137i. [DOI] [PubMed] [Google Scholar]
- 20.Bray PG, Mungthin M, Hastings IM, Biagini GA, Saidu DK, Lakshmanan V, Johnson DJ, Hughes RH, Stocks PA, O'Neill PM, Fidock DA, Warhurst DC, Ward SA. PfCRT and the trans-vacuolar proton electrochemical gradient: regulating the access of chloroquine to ferriprotoporphyrin IX. Molecular Microbiology. 2006;62(1):238–251. doi: 10.1111/j.1365-2958.2006.05368.x. [DOI] [PMC free article] [PubMed] [Google Scholar]
- 21.Peters W. The chemotherapy of rodent malaria. X. Dynamics of drug resistance. II. Acquisition and loss of chloroquine resistance in Plasmodium berghei observed by continuous bioassay. Annals of Tropical Medicine & Parasitology. 1970;64:25–40. [PubMed] [Google Scholar]
- 22.Smalley ME. Plasmodium falciparum gametocytes: The effect of chloroquine on their development. Transactions of the Royal Society of Tropical Medicine and Hygiene. 1977;71:526–529. doi: 10.1016/0035-9203(77)90149-3. [DOI] [PubMed] [Google Scholar]
- 23.Slater AF. Chloroquine: mechanism of drug action and resistance in Plasmodium falciparum. Pharmacology & Therapeutics. 1993;57:203–235. doi: 10.1016/0163-7258(93)90056-j. [DOI] [PubMed] [Google Scholar]
- 24.Zhang Y, Asante KS, Jung A. Stage-dependent inhibition of chloroquine on Plasmodium falciparum in vitro. The Journal of Parasitology. 1986;72:830–836. [PubMed] [Google Scholar]
- 25.Orjih AU. Heme polymerase activity and the stage specificity of antimalarial action of chloroquine. The Journal of Pharmacology and Experimental Therapeutics. 1997;282:108–112. [PubMed] [Google Scholar]
- 26.Yayon A, Vande Waa JA, Yayon M, Geary TG, Jensen JB. Stage-dependent effects of chloroquine on Plasmodium falciparum in vitro. The Journal of Protozoology. 1983;30:642–647. doi: 10.1111/j.1550-7408.1983.tb05336.x. [DOI] [PubMed] [Google Scholar]
- 27.ter Kuile F, White NJ, Holloway P, Pasvol G, Krishna S. Plasmodium falciparum: in vitro studies of the pharmacodynamic properties of drugs used for the treatment of severe malaria. Experimental Parasitology. 1993;76(1):85–95. doi: 10.1006/expr.1993.1010. [DOI] [PubMed] [Google Scholar]
- 28.Gligorijevic B, Bennett T, McAllister R, Urbach JS, Roepe PD. Spinning disk confocal microscopy of live, intraerythrocytic malarial parasites. 2. Altered vacuolar volume regulation in drug resistant malaria. Biochemistry. 2006;45:12411–12423. doi: 10.1021/bi0610348. [DOI] [PubMed] [Google Scholar]
- 29.Bennett TN, Paguio M, Gligorijevic B, Seudieu C, Kosar AD, Davidson E, Roepe PD. Novel, rapid, and inexpensive cell-based quantification of antimalarial drug efficacy. Antimicrobial Agents and Chemotherapy. 2004;48:1807–1810. doi: 10.1128/AAC.48.5.1807-1810.2004. [DOI] [PMC free article] [PubMed] [Google Scholar]
- 30.Trager W, Jensen JB. Human malaria parasites in continuous culture. Science. 1976;193:673–675. doi: 10.1126/science.781840. [DOI] [PubMed] [Google Scholar]
- 31.Lambros C, Vanderberg JP. Synchronization of Plasmodium falciparum erythrocytic stages in culture. The Journal of Parasitology. 1979;65:418–420. [PubMed] [Google Scholar]
- 32.Elliott DA. Serial Sectioning via Microtomy (or, How To Get Over 100 Consecutive Serial Sections On One TEM Gird) Microscopy Today. 2007;15:30–33. [Google Scholar]
- 33.Langreth SG, Jensen JB, Reese RT, Trager W. Fine structure of human malaria in vitro. The Journal of Protozoology. 1978;25:443–452. doi: 10.1111/j.1550-7408.1978.tb04167.x. [DOI] [PubMed] [Google Scholar]
- 34.Wellems TE, Walker-Jonah A, Panton LJ. Genetic mapping of the chloroquine-resistance locus on Plasmodium falciparum chromosome 7. Proceeding of the National Academy of Sciences of the United States of America. 1991;88(8):3382–3386. doi: 10.1073/pnas.88.8.3382. [DOI] [PMC free article] [PubMed] [Google Scholar]
- 35.Sidhu AB, Verdier-Pinard D, Fidock DA. Chloroquine resistance in Plasmodium falciparum malaria parasites conferred by pfcrt mutations. Science. 2002;298(5591):210–213. doi: 10.1126/science.1074045. [DOI] [PMC free article] [PubMed] [Google Scholar]
- 36.Cooper RA, Ferdig MT, Su XZ, Ursos LM, Mu J, Nomura T, Fujioka H, Fidock DA, Roepe PD, Wellems TE. Alternative mutations at position 76 of the vacuolar transmembrane protein PfCRT are associated with chloroquine resistance and unique stereospecific quinine and quinidine responses in Plasmodium falciparum. Molecular Pharmacology. 2002;61(1):35–42. doi: 10.1124/mol.61.1.35. [DOI] [PubMed] [Google Scholar]
- 37.van Dooren GG, Marti M, Tonkin CJ, Stimmler LM, Cowman AF, McFadden GI. Development of the endoplasmic reticulum, mitochondrion and apicoplast during the asexual life cycle of Plasmodium falciparum. Molecular Microbiology. 2005;57:405–419. doi: 10.1111/j.1365-2958.2005.04699.x. [DOI] [PubMed] [Google Scholar]
- 38.Gustafsson LL, Walker O, Alvan G, Beermann B, Estevez F, Gleisner L, Lindstrom B, Sjoqvist F. Disposition of Chloroquine in man after single intravenous and oral doses. British Journal of Clinical Pharmacology. 1983;15:471–479. doi: 10.1111/j.1365-2125.1983.tb01532.x. [DOI] [PMC free article] [PubMed] [Google Scholar]
- 39.De Vries PJ, Oosterhuis B, Van Boxtel CJ. Single-dose pharmacokinetics of chloroquine and its main metabolite in healthy volunteers. Drug Investigation. 1994;8:143–149. [Google Scholar]
- 40.Sanchez CP, McLean JE, Rohrbach P, Fidock DA, Stein WD, Lanzer M. Evidence for a pfcrt-associated chloroquine efflux system in the human malarial parasite Plasmodium falciparum. Biochemistry. 2005;44(29):9862–9870. doi: 10.1021/bi050061f. [DOI] [PubMed] [Google Scholar]
- 41.Bennett TN, Kosar AD, Ursos LM, Dzekunov S, Singh Sidhu AB, Fidock DA, Roepe PD. Drug resistance-associated pfCRT mutations confer decreased Plasmodium falciparum digestive vacuolar pH. Molecular & Biochemical Parasitology. 2004;133(1):99–114. doi: 10.1016/j.molbiopara.2003.09.008. [DOI] [PubMed] [Google Scholar]
- 42.Meierjohann S, Walter RD, Muller S. Regulation of intracellular glutathione levels in erythrocytes infected with chloroquine-sensitive and chloroquine-resistant Plasmodium falciparum. Biochemical Journal. 2002;368(Pt 3):761–768. doi: 10.1042/BJ20020962. [DOI] [PMC free article] [PubMed] [Google Scholar]
- 43.Atkinson CT, Aikawa M. Ultrastructure of malaria-infected erythrocytes. Blood Cells. 1990;16(2–3):351–368. [PubMed] [Google Scholar]
- 44.Bannister LH, Hopkins JM, Margo G, Dluzewski AR, Mitchell GH. Three Dimensional Ultrastructure of the Ring Stage of Plasmodium falciparum: Evidence for Export Pathways. Microscopy Microanalysis. 2004;10:551–562. doi: 10.1017/S1431927604040917. [DOI] [PubMed] [Google Scholar]
- 45.Barnwell JW. Malaria. A new escape and evasion tactic. Nature. 1999;398:562–563. doi: 10.1038/19198. [DOI] [PubMed] [Google Scholar]
- 46.Silvestrini F, Bozdech Z, Lanfrancotti A, Di Giulio E, Bultrini E, Picci L, Derisi JL, Pizzi E, Alano P. Genome-wide identification of genes upregulated at the onset of gametocytogenesis in Plasmodium falciparum. Molecular and Biochemical Parasitology. 2005;143:100–110. doi: 10.1016/j.molbiopara.2005.04.015. [DOI] [PubMed] [Google Scholar]
- 47.Willis RC. Bloodsucker rising. Modern Drug Discovery. 2001;4:40–42. [Google Scholar]
- 48.Ferreira MU, da Silva Nunes M, Wunderlich G. Antigenic diversity and immune evasion by malaria parasites. Clinical and Diagnostic Laboratory Immunology. 2004;11:987–995. doi: 10.1128/CDLI.11.6.987-995.2004. [DOI] [PMC free article] [PubMed] [Google Scholar]
- 49.Alano P, Carter R. Sexual differentiation in malaria parasites. Annual Review of Microbiology. 1990;44:429–449. doi: 10.1146/annurev.mi.44.100190.002241. [DOI] [PubMed] [Google Scholar]
- 50.Janse CJ, van der Klooster PF, van der Kaay HJ, van der Ploeg M, Overdulve JP. DNA synthesis in Plasmodium berghei during asexual and sexual development. Molecular and Biochemical Parasitology. 1986;20:173–182. doi: 10.1016/0166-6851(86)90029-0. [DOI] [PubMed] [Google Scholar]
- 51.Kudo R. Protozoology. Springfield, IL: 1971. [Google Scholar]
- 52.Read M, Sherwin T, Holloway SP, Gull K, Hyde JE. Microtubular organization visualized by immunofluorescence microscopy during erythrocytic schizogony in Plasmodium falciparum and investigation of post-translational modifications of parasite tubulin. Parasitology. 1993;106(Pt 3):223–232. doi: 10.1017/s0031182000075041. [DOI] [PubMed] [Google Scholar]
- 53.Fritsch FM, Mehlhorn H, Schein E, Hauser M. The effects of drugs on the formation of Theileria annulata merozoites in vitro. Parasitology Research. 1988;74:340–343. doi: 10.1007/BF00539455. [DOI] [PubMed] [Google Scholar]
- 54.Maerki S, Brun R, Charman SA, Dorn A, Matile H, Wittlin S. In vitro assessment of the pharmacodynamic properties and the partitioning of OZ277 / RBx-11160 in cultures of Plasmodium falciparum. Journal of Antimicrobial Chemotherapy. 2006;58(1):52–58. doi: 10.1093/jac/dkl209. [DOI] [PubMed] [Google Scholar]
- 55.Ralph SA, van Dooren GG, Waller RF, Crawford MJ, Fraunholz MJ, Foth BJ, Tonkin CJ, Roos DS, McFadden GI. Tropical infectious diseases: metabolic maps and functions of the Plasmodium falciparum apicoplast. Nature Reviews. 2004;2:203–216. doi: 10.1038/nrmicro843. [DOI] [PubMed] [Google Scholar]