

Abstract
This study examines the life course of 2 independent components of adult affective development, 1 aimed at differentiation and complexity, the other aimed at optimization and positive emotional balance. These 2 components are predicted to have different developmental trajectories over the adult life span and to become related in a compensatory fashion under conditions of resource restrictions, such as those related to late life. Using individual growth curve estimation, we modeled 6-year longitudinal changes in the 2 components in a total sample of 388 individuals ranging in age from 15 to 88 years. As predicted, initial level of affect optimization was positively associated with age up to late middle age with a subsequent leveling off; individual rates of change were found to decelerate with age up to age 60 years and accelerate again around age 80 years. For affect complexity, initial level of affect complexity was positively associated with age up to age 45 years and negatively associated with age from then on, whereas individual rates of change were negatively associated with age, and this association tended to get stronger with age.
Keywords: adult development/aging, emotion regulation, affective development, affect complexity
Research on emotional development in adulthood and later life has revealed two seemingly contradictory patterns (Labouvie-Vief & Márquez, 2004). On one hand, a body of research shows that positive hedonic tone tends to increase linearly or monotonically well into old age (e.g., Charles, Reynolds, & Gatz, 2001; Mroczek & Kolarz, 1998). On the other hand, another body of research suggests that later-life declines in cognitive resources can bring impairment of the reflective and executive capacities that are related to affect monitoring (Hashtroudi, Johnson, & Chrosniak, 1989; Johnson, Mitchell, Raye, & Greene, 2004; Labouvie-Vief, 2003, 2005; Labouvie-Vief & Márquez, 2004). These impairments may cause many older adults to display more simplified, black-and-white thinking about self and others (e.g., Blanchard-Fields, 1999; Labouvie-Vief, Chiodo, Goguen, Diehl, & Orwoll, 1995), along with an increased inclination to rely on stereotypical thinking (Mather & Johnson, 2000; von Hippel, Silver, & Lynch, 2000). Thus, whereas one set of studies suggests improved emotion regulation in later life, another body suggests that emotion regulation may be compromised in situations that make demands on executive control processes.
How can these two views of emotion regulation be reconciled? We suggest that these bodies of research reflect different traditions with different conceptualizations of what is “good” regulation. One of these conceptualizations emphasizes the optimization of individual well-being. The other, instead, emphasizes differentiation and complexity as individuals coordinate feelings in the here-and-now with past and future ones and synchronize them with those of others. In that process, positive feelings often must be delayed and negative affect endured, at least temporarily. Optimal functioning, then, involves an integration and flexible coordination of two core modes of emotion regulation.
In the current research, we follow up on our earlier work (Labouvie-Vief, 2003, 2005; Labouvie-Vief & Márquez, 2004; Labouvie-Vief & Medler, 2002) that has suggested that self-and emotional development in adulthood is best conceptualized along these dual routes, each of them involving a distinct mode of processing affective information (Labouvie-Vief, 2003, 2005; Labouvie-Vief & Márquez, 2004; Labouvie-Vief & Medler, 2002; Metcalfe & Mischel, 1999). We refer to these two modes as affect optimization and affect complexity. Affect optimization reflects an emphasis on maintaining hedonic tone by maximizing positive affect and minimizing negative affect in regulating emotions. In contrast, affect complexity focuses on objectivity, personal growth, individuation, and emotional and conceptual complexity. Our theoretical framework, dynamic integration theory (DIT), suggests that these two modes are dynamically coordinated with each other in such a way that momentary decreases in complexity can result in compensatory increases in optimization, whereas momentary increases in complexity may reduce the tendency to optimize. DIT states that this dynamic system functions with reduced flexibility, however, if individuals adopt a habitual, trait-like bias for one or the other mode. Such biases can result, either from normative age-related changes in cognitive executive resources, such as those related to early growth or late life declines in executive functioning. Alternatively, they can be the consequence of having acquired poor regulation styles that may make the individual more susceptible to overactivation.
In the present article, we extend our previous work in one substantial way. Specifically, using data from a 6-year longitudinal sequential study, we examine hypotheses about the general developmental trajectories of affect optimization and affect complexity across the adult life span.
Dynamic Integration of Affect Optimization and Affect Complexity
Dynamic integration theory (DIT) integrates two core propositions. One set of propositions is derived from a cognitive-developmental view of affect as elaborated by Piaget (1954/1981). That view suggests that affective structures and schemas can be ordered in terms of levels of complexity and integration that imply increasingly stable regulation. A second set of propositions suggests that the resulting stability is not static but involves a dynamic, flexible trade-off between emotional activation and the complexity and integration by which emotions are represented and regulated. Both of these propositions are explicated below.
As is true of his discussion of well-integrated schemas and cognitive structures in general, Piaget’s (1954/1981) view of affect suggests that affective integration involves a coordination of aspects of experience that were in a state of contradiction and mutual opposition and negation (for discussion, see Labouvie-Vief & Marquez, 2004). A particularly crucial opposition is that between positive and negative affective valence—an opposition whose resolution and integration is an advanced developmental accomplishment that does not emerge fully until adolescence (Fischer & Biddell, 1998; Harter, 1999; Harter & Monsour, 1992). Indeed, how individuals organize positive and negative affect in terms of differentiated cognitive–affective structures has emerged as a lively research question and is of theoretical interest. Anticipated by Loevinger’s (1976) work on ego development, this orientation recently has led to several proposals that focus on individuals’ understanding and organization of affect across time, context, and emotion category or valence. Variously referred to by such terms as cognitive–affective complexity or differentiation (Labouvie-Vief, DeVoe, & Bulka, 1989; Labouvie-Vief & Medler, 2002), affect complexity (Cacioppo & Berntson, 1994; Ong & Allaire, 2005; Ong & Bergeman, 2004; Reich, Zautra, & Davis, 2003; Zautra, 2003), emotional awareness (Lane & Schwartz, 1987; Lane & Nadel, 2000), or emotional intelligence (Mayer & Salovey, 1995), some authors (e.g., Helson & Wink, 1987; Labouvie-Vief, 1999; Labouvie-Vief & Medler, 2002; Ryan & Deci, 2001) have suggested that these terms refer to a second criterion of adaptive emotion regulation—one that may be independent of valence-based ones, per se.
From a cognitive–developmental perspective, Labouvie–Vief and Márquez (2004) suggested that such complex cognitive–affective structures emerge out of the assimilation–accommodation dynamic that is central to Piaget’s (1954/1981) theory and that parallels the contemporary differentiation between two modes of processing affective information, schematic and conscious (Chaiken & Trope, 1999; Clore & Ortony, 2000; Epstein & Pacini, 1999; LeDoux, 1996; Metcalfe & Mischel, 1999; Schore, 1994; Tucker, 1992). Assimilation, in essence, represents a low-effort schematic processing mode in which judgments are automatic and framed in a binary fashion in terms of good and bad or right and wrong. Shifts toward accommodation, in turn, involve a conscious and effortful processing, elaboration, and coordination of the implicit knowledge of schemas into declarative knowledge structures that integrate multiple dimensions. The resulting representations are of high computational complexity and demanding of computational resources, and from a developmental perspective, emotional processing shifts from emotion schemas or structures that are relatively automatic to ones that involve more complex representations.
The how of such shifts is addressed by the second set of propositions that suggests a dynamic relationship between the two modes. The resulting interaction is captured by a generalization of the Yerkes-Dodson law (1908) as recently elaborated by Metcalfe and Mischel (1999). This law postulates a compensatory and curvilinear relationship between the level of activation/arousal on the one hand and the degree to which complex, integrated behavior is possible on the other hand. Accordingly, when levels of emotional activation/arousal are low, complex and well-integrated thinking, planning, and remembering are facilitated. However, in contrast to the facilitative effect of low and moderate levels of arousal, when arousal rises to extremely high levels, it tends to render complex, “cool” cognitions and behavior dysfunctional and poorly integrated. Instead, automated, nonconscious schemas take over in an effort to maintain the system activation within tolerable boundaries (see Labouvie-Vief & Márquez, 2004; Metcalfe & Mischel, 1999).
That moderate levels of activation enhance cognitive integration and efficiency is evident from findings suggesting that at such levels cognitive complexity and efficiency tend to be enhanced. For example, LaBar and Phelps (1998) have shown that amygdala activation strengthens hippocampus-dependent memory consolidation (see also Eysenck, 1976). Thus, whereas at very low levels of activation processing is dependent solely on a conscious, effortful system, at moderate levels processing is facilitated by enriching representations with vivid and image-rich elements (see Kensinger, Piguet, Rrendl, & Corkin, 2005). Emotional facilitation has been widely established behaviorally and also is at the root of theories that emphasize the energizing and attention-focusing effect of moderate levels of arousal and activation (e.g., Selye, 1976; Yehuda & McEwen, 2004).
However, in contrast to the facilitative effect of moderate levels of arousal, very high levels of activation tend to render complex representations less well integrated. Yet the resulting degradation of complexity is part of an adaptive trade-off in which highly automated mechanisms assert themselves in order to maintain affect balance in a sufficiently positive range. Further, degradation may not result in complete fragmentation and breakdown but can be relatively coherent or graceful (Tucker, 1992) in the sense that relatively well-organized strategies of self-protection emerge. Of those, a particularly important example is the emergence of a positivity bias in which attention is diverted from negative to positive information about the self.
Trading off differentiation and complexity in favor of optimization makes good sense in situations that pose a threat to the well-being and survival of the serf. Such situations stimulate both individual emergency responses and increases in social cohesion that focus attention on restoring equilibrium and securing survival. In a way, this permits individuals to retreat to safe havens by reducing the range of their action and seeking refuge in close social networks while at the same time directing individual and group aggression toward perceived threats. However, a related negative consequence of this shift toward self-protectiveness is that negative affect and information often are projected onto others (Mikulincer & Horesh, 1999; Pyszczynski, Greenberg, & Solomon, 1999), resulting in increased black-and-white thinking, stereotyping, and polarization among in-groups and out-groups (e.g., Paulhus & Lim, 1994). Erikson (1984) referred to these ways of simplifying psychological complexity as pseudo-speciation—the exclusion of others from the circle of humanity in which one includes oneself.
Optimization and Complexity Across the Life Span
How does the complexity–optimization trade-off apply to adult development and aging? Although the principle ideally works in a dynamic, flexible, and integrated way, some conditions can reduce flexible integration. Most important for our current purposes, normal developmental changes in cognitive resources can alter vulnerability to degradation of optimization and complexity. For example, as cognitive resources grow during the early life span, individuals are better able to maintain integrated behavior even when levels of activation are high. In contrast, as cognitive resources decline, individuals are more strongly affected by overactivation (Labouvie-Vief & Márquez, 2004; Metcalfe & Mischel, 1999).
Research on development at the early portion of the life span suggests, indeed, that with advancing development, individuals differentiate primary emotions into complex ones that expand the original automatic organizations and create more complex cognitive–affective schemas. For example, researchers in child development (e.g., Harris, 2000; Lewis, 2000) have shown that as children differentiate their emotions from those of others, qualitatively new secondary affects emerge—self-conscious feelings such as shame and embarrassment, pride, and guilt. Along with this emergence of complex emotions, the ability to coordinate negative emotions gradually emerges (Fischer & Biddell, 1998; Harter, 1999; Harter & Monsour, 1992).
Previous work from our laboratory (Labouvie-Vief, Chiodo, et al., 1995; Labouvie-Vief et al., 1989; Labouvie-Vief, Diehl, Chioda, & Coyle, 1995; Labouvie-Vief & Medler, 2002) has shown that the general structure of such emotional differentiation continues well into middle adulthood but declines in later adulthood. Specifically, from age 60 onward, individuals tended to show less cognitive–affective complexity. In contrast to this growth–decline curvilinear pattern, the elderly scored highest of all age groups on measures of positive affect and self-reported well-being, but lowest on negative affect (Labouvie-Vief & Medler, 2002). This finding is in keeping with research that has emphasized increases in affect balance with age (see Carstensen, Isaacowitz, & Charles, 1999), but it does not fully support the conclusion that elevations in hedonic tone reflect overall improvements in self-regulation and resilience. Our battery permitted relating the more cognitive measures to the ones that are more aimed at hedonic tone, and our data indicated that cognitive–affective complexity in our sample did not correlate with measures of hedonic tone, such as well-being and positive affect (Labouvie-Vief & Medler, 2002). In contrast, cognitive-affective complexity was significantly positively correlated with negative affect, as well as measures of cognition and ego complexity. The fact that individuals of higher complexity tended to express more negative affect validated our notion of affective complexity as involving coordination of positive and negative affect, but it also suggested that negative affect, but not positive affect, was related to cognitive functioning—perhaps because the processing of negative affect tends to be more cognitively demanding (Pratto & John, 1991). As a consequence, we (Labouvie-Vief, 2005; Labouvie-Vief & Medler, 2002) suggested that many older individuals compensate for decreases in cognitive resources, and resulting decreases in emotional differentiation and complexity, by increases in optimization.1
That older individuals suffer from declines in cognitive–affective complexity is suggested by a number of findings in the literature. First, an extensive body of research indicates that older adults experience normative cognitive resource restrictions, such as aging-related decrements in executive functioning (Hasher & Zacks, 1988; Salthouse, 1991), declines in prefrontal cortical volume and related monitoring functioning (Cabeza, 2002; Johnson et al., 2004; Raz, 2000), and neuromodulatory declines (Li, Lindenberger, & Sikström, 2001). Because cognitive–affective regulation is a resource-demanding process, one would therefore predict declines in affective regulation resulting in a pattern of degradation, or simplification of cognitive–affective structure. This hypothesis is supported by a large body of experimental evidence suggesting that in comparison with young adults, older adults are more likely to interpret information in a positive direction (Labouvie-Vief & Medler, 2002; Mather & Johnson, 2000), to engage in stereotypical thinking (Mather & Johnson, 1999; von Hippel, Silver, & Lynch, 2000), and to engage in negative attributions (Blanchard-Fields, 1999; Blanchard-Fields & Norris, 1994). Moreover, older adults tend to exhibit performance deficits in many situations but less so when the emphasis is on personally vital dimensions such as safety, truth, and moral character (Rahhal, May, & Hasher, 2002) and when personal identification with targets is possible (Hess, Rosenberg, & Waters, 2001). Older adults also tend to limit their behavior to a more restricted range of physical (Lawton & Nahemow, 1973), and social environments (Carstensen, Charles, & Issacowitz, 2000) and to a narrower range of goals (Baltes & Baltes, 1990; Brandtstädter & Greve, 1994). All of these behaviors suggest that as individuals experience reductions in cognitive–affective complexity, they can maintain a strategy of affect optimization as long as they reduce the demands made on them by their external environment (Labouvie-Vief, 1998; Schaie, 1996).
The Current Research
In the current research, we provide a longitudinal examination of the hypothesized developmental trajectories of affect complexity and affect optimization. The research is an extension of our earlier work (Labouvie-Vief & Medler, 2002) in which we showed in a cross-sectional study that affect complexity was characterized by a curvilinear pattern of age differences with a positive trend until midlife and decline thereafter, whereas affect optimization showed a pattern of age differences indicative of a linear increase across the adult life span. At the same time, individuals low in affect complexity but high in affect optimization, who were classified as expressing a self-protective regulation style, were most strongly represented in the oldest age group. Although these findings were consistent with our theoretical propositions (Labouvie-Vief & Márquez, 2004), because of the cross-sectional design no direct examination of the longitudinal trajectories of affect complexity and affect optimization was possible.
In the current study, we present such a longitudinal examination over a 6-year time span. Specifically, we predicted that over the 6-year observation period, the mode of affect complexity would show a curvilinear pattern of change across the adult life span. Specifically, we hypothesized that in younger age groups, the change trajectory for affect complexity would be positive up to middle adulthood (i.e., positive within-person slopes), whereas the change trajectory for age groups from middle adulthood on was expected to be negative (i.e., negative within-person slopes). In contrast, affect optimization was expected to show a linearly (or at least, monotonically) increasing trend (i.e., positive within-person slopes) over the course of the adult life span covered in this study. Evidence in support of the hypothesized change trajectories would lend additional validity to the theoretical propositions of DIT.
Method
Participants
The study sample consisted of adolescents and adults who were recruited in 1992 from three suburban communities in a major midwestern metropolitan area and contacted by mail regarding their participation (see Diehl, Coyle, & Labouvie-Vief, 1996; Labouvie-Vief, Chiodo, et al., 1995). The three communities were selected to represent different income levels (low, medium, and high) on the basis of the median housing value from 1990 census information. Among the 30% individuals who responded to the mailing, an age- and gender-stratified sample of 400 individuals (205 women, 195 men; M age = 44.7 years, SD = 20.3 years, age range = 10.1–87.5 years) was randomly selected. Participants’ annual family household income ranged from $10,000 to over $150,000 a year, with an average of $55,000. The majority (95%) of the participants were White. Compared with 1990 census information, participants in the present sample were similar to the parent sample in terms of income but were somewhat more educated (see Labouvie-Vief, Chiodo, et al., 1995).
In 1994, 330 participants (153 men, 177 women) of the original sample were re-examined, resulting in a return rate of 83%. For the 70 participants who were not retested, the reasons for their non-participation were as follows: 30 (43%) had moved out of the area and could not be contacted; 11 (16%) were unable to participate due to illness; 8 (11.4%) did not respond to numerous requests for participation; 7 (10%) dropped out without mentioning a specific reason; 8 (11.4%) said they were unhappy about continuing to participate in the research; 4 (6%) were deceased; and 2 (2.8%) were lost due to incomplete data.
In 1998, 258 participants (144 women, 114 men; M age = 50.5 years, SD = 19.6 years; age range = 16.1–92.4 years) of the original sample were followed up, resulting in a return rate of 64.5% of the original sample or 78% of the Time 2 sample. For the 72 participants who participated in 1994 but who were not retested in 1998, the reasons for their nonparticipation were as follows: 14 participants (19.4%) had moved out of the area and could not be contacted; 48 (66.7%) were either unable to participate due to illness, declined participation due to a busy schedule, did not respond to numerous requests for participation, or dropped out without giving a reason; 10 (13.9%) participants were deceased.
Attrition across the 6-year period did not significantly alter the sample with regard to age or gender composition. Attrition analyses revealed that compared with individuals who returned for testing, participants who did not return in 1994 had a significantly lower level of education and scored significantly lower on three of four mental ability tests (i.e., subtraction/multiplication, letter sets, and vocabulary) at the beginning of the study. Nonreturnees also rated their health as significantly poorer than did returnees and scored significantly lower on affect complexity. No significant differences between nonreturnees and returnees were found with regard to affect optimization.
Attrition analyses for the 1994–1998 interval showed that compared with individuals who returned for testing in 1998, nonreturnees scored significantly lower on subtraction/multiplication and letter sets. No significant differences were found with regard to other variables such as age, income, subjective health, affect optimization, affect complexity, or depressive symptoms. Thus, compared with the original sample, the sample used for the analyses reported here was biased in favor of more educated, healthier, and cognitively higher functioning individuals. Overall, this pattern of attrition is similar to the pattern reported from other long-term longitudinal studies of adult development (Schaie, 1996).
Design
One advantage of individual growth curve modeling using multilevel analysis is that it permits the inclusion of participants who do not have data at all points of measurement (Singer & Willett, 2003). In addition, this type of analysis allows the use of observations collected at intervals that vary both within and across individuals (Singer & Willett, 2003). Across the three waves of data collection, 388 participants provided a total of 906 observations.2 A total of 214 participants (53.5%) had complete data on all relevant variables for all three occasions; 90 participants (22.8%) had complete data on the relevant variables for two waves; and 84 participants (21.0%) had complete data for only one occasion. The majority of missing data was due to the fact that participants had not received the California Psychological Inventory (CPI; Gough, 1987) at the first occasion of measurement because of their age or had missing data on the CPI-based variables on the first and second occasions of measurement. Because participants’ scores for affect optimization and affect complexity were calculated as linear composites of the CPI-based scale scores, participants with missing information on these variables at the first and second occasions could not be included in the analyses. This resulted in a sample of 304 participants with a total of 823 observations.3 This number is considerably larger than the number of data points that would have been permitted by more traditional methods, such as repeated measures of analysis of variance.
Procedure
At each occasion of testing, participants completed two 2-hr sessions that were scheduled, on average, 2 weeks apart. Testing was conducted by trained graduate students and was held in small groups of 2–10 individuals at locations in the participants’ communities. In 1992 and in 1994, participants received a remuneration of $50.00 for the completion of both testing sessions. In 1998, participants received $75.00 for the completion of the testing sessions.
Measures
Affect optimization and affect complexity were assessed using the Coping and Defense scales from the CPI (Gough, 1987). The CPI was administered to participants age 15 and older three times over the course of 6 years: 1992, 1994, and 1998.4
In our previous research (see Labouvie-Vief & Medler, 2002, Table 1), principal components analyses on select Coping and Defense scales derived from the CPI (Haan, 1977; Joffe & Naditch, 1977) yielded two orthogonal factors. Consistent with our theoretical predictions, one factor was related specifically to affect optimization, indicating a tendency to contain and dampen negative affect. In contrast, the other factor was related to affect complexity, indicating a tendency to explore and amplify affect and to confront reality openly. As shown in the Appendix, the CPI scales of denial, regression, doubt, and regression in the service of the ego loaded on the factor of affect optimization. Specifically, high denial, low regression, low doubt, and low regression in service of the ego defined affect optimization.
Table 1.
Descriptive Statistics and Correlations Across the Times of Measurement
| Year of Assessment
|
|||
|---|---|---|---|
| 1992 (N = 284) | 1994 (N = 281) | 1998 (N = 218) | |
| 1992 | — | .81 | .77 |
| 1994 | .82 | — | .81 |
| 1998 | .76 | .82 | — |
| Affect optimization | |||
| M | 99.84 | 100.23 | 100.94 |
| SD | 15.15 | 14.98 | 14.20 |
| Range | 42.6–133.1 | 55.6–131.3 | 59.3–132.5 |
| Affect complexity | |||
| M | 101.19 | 100.32 | 99.76 |
| SD | 15.13 | 14.57 | 16.06 |
| Range | 56.5–143.7 | 62.9–136.3 | 62.6–133.8 |
Note. Correlations are based on pairwise inclusion of cases; because cases with partially missing data can be included in multilevel analyses, the N for the individual change analyses deviates from the Ns shown above. Correlations for affect optimization are shown below the main diagonal; correlations for affect complexity are shown above the main diagonal. All correlations were significant at p < .01.
The scales of intellectuality, intellectualization, tolerance of ambiguity, and repression loaded on the factor of affect complexity. High intellectualization, high intellectuality, high tolerance of ambiguity, and low repression define affect complexity. Accordingly, these eight scales were used in the present study to compute individuals’ scores for the two modes of affect regulation. The scores for affect optimization and affect complexity were computed by reverse-coding the respective CPI scales and then creating a unit-weighted linear composite of the standardized CPI scores.
Data Analyses
To examine the change trajectories of affect optimization and affect complexity over the 6-year interval, we estimated individual growth curves using multilevel modeling (MLM), also known as hierarchical linear modeling, mixed effects modeling, or random coefficient modeling (see Raudenbush & Bryk, 2002; Singer & Willett, 2003). SAS PROC MIXED (SAS Institute, Cary, NC) was used to perform all analyses (Littell, Milliken, Stroup, & Wolfinger, 1996). MLM is an effective and desirable approach for the analyses of longitudinal data because it takes into account several important issues (see Singer & Willett, 2003). First, MLM takes into account that longitudinal data have a hierarchical structure with observations nested within individuals. Second, MLM does not require that all participants be assessed at all occasions or that intervals of observation be equally spaced. Finally, MLM allows the simultaneous estimation of within- and between-person effects, thus avoiding the problems of aggregation of more traditional methods (see Raudenbush & Bryk, 2002; Singer & Willett, 2003).
In estimating the models, we first tested for fixed effects, which describe the intercept (i.e., the mean level at Time 1) and the slope (i.e., the change over time) for the overall sample. Subsequently, we tested for random effects in intercept and slope assessing the deviation of the person-level intercepts and slopes from the sample estimates. A significant estimate for the random intercept indicates that there was significant between-person variation around the overall sample mean at the beginning of the assessment period. A significant estimate for the random slope indicates that there were significant between-person differences in how individuals changed over time (i.e., interindividual differences in intraindividual change).
For each mode of affect regulation, we performed two sets of analyses. The first set of analyses examined whether affect optimization and affect complexity changed over the 6-year interval. At the individual level (i.e., Level 1), change in affect optimization and affect complexity across the three time points was modeled in the following way:
| (1) |
Equation 1 specifies that the observed score for affect optimization or affect complexity for person p at time t, Ypt, is a function of (a) that person’s score (i.e., intercept) of affect optimization or affect complexity in 1992, (β0p; (b) that person’s estimated rate of rate of change (i.e., slope) per year over the 6-year period, (βlp; and (c) a random within-person error, ept, representing the deviation of participant p’s observed score from his or her estimated score at time t. The term (Timept − 92) is the index for the time elapsed since 1992, corresponding to the years passed since the beginning of the study.5
The individual intercepts and slopes (i.e., (β0p and (βlp) in the Level-1 model were then modeled in a Level-2 equation by estimating the mean change function of the entire sample and the degree of deviation of the individual intercepts and slopes from the sample mean. Thus, the Level-2 equations read as follows:
| (2) |
and
| (3) |
where γ00 is the intercept for the entire sample, representing the mean score of the entire sample on affect optimization and affect complexity in 1992, u0p represents the unaccounted variance in participant p’s 1992 score, γ10 is the rate of change (i.e., slope) for the entire sample, and u1p represents the unaccounted variance in participant p’s rate of change. Substituting Equations 2 and 3 into Equation 1 allows the simultaneous estimation of individual and sample parameters of the effect of time with regard to affect optimization and affect complexity.
The second set of analyses examined whether the observed changes in affect optimization and affect complexity differed by participants’ age at entry into the study. We predicted that individuals of different ages would show different trajectories of change in affect optimization and affect complexity over the 6-year observation period. For these analyses, the Level-1 model from the first set of analyses, which accounted for variation within participants over time, remained unchanged. However, the Level-2 model was expanded so that the parameters from the individual growth curves were modeled as a function of time and age. Because we hypothesized a curvilinear relationship between age and affect complexity, we computed a quadratic variable of age by squaring age and included it in the model. Age was centered on the 1992 sample mean (M = 46.12) to facilitate interpretation. Therefore, the equations for the Level-2 model can be expressed as:
| (4) |
and
| (5) |
The intercept and rate of change for individual p on affect optimization or affect complexity were predicted by his or her age in 1992. Now γ00 is the expected level of affect optimization or affect complexity in 1992 for a person with average age (i.e., age equal to the sample mean); γ01 and γ02 represent the effects of age, linear and quadratic, on the initial level of affect optimization or affect complexity for individual p, and u0p represents the unaccounted variance in participant p’s initial level. In addition, γ10 is the expected rate of change over the 6-year period for a person of average age (i.e., age equal to the sample mean); γ11 and γ12 represent the effects of age on the rate of change of affect optimization and affect complexity, and ulp represents the unaccounted variance in participant p’s rate of change.
Results
Results are presented in two major sections. First, we present descriptive statistics and correlations for affect optimization and affect complexity over the 6-year observation period. Second, we present findings from the multilevel analyses estimating individual change trajectories for the two modes of affect regulation. The analyses for affect optimization are presented first, followed by the findings for affect complexity.
Six-Year Stability
Table 1 shows the stability coefficients for affect optimization (below the main diagonal) and affect complexity (above the main diagonal) across the 6-year period. As can be seen in Table 1, the rank-order stability was considerable for both affect optimization and affect complexity, suggesting that individuals who scored high on affect optimization or affect complexity at the beginning of the study also tended to score high 6 years later, and vice versa. Inspection of the descriptive statistics suggested that there was also considerable mean level stability at the sample level, although the dispersion around the mean decreased for affect optimization and increased for affect complexity.
Trajectories of Change in Affect Optimization
The top panel of Table 2 provides information about the fixed effects of the growth function of affect optimization, indicating the average change trajectory for affect optimization in the sample as a whole. The estimate for the mean level in affect optimization (γ00) was 99.69, which was significantly different from zero. The estimate of the mean rate of change in affect optimization (γ10) was .27, p < .05, indicating a significant positive average rate of change in affect optimization over the 6-year interval.
Table 2.
Estimates of Fixed and Random Effects of Change Trajectories for Affect Optimization
| Effects | Estimate | SE | t ratio | z | |
|---|---|---|---|---|---|
| Fixed | |||||
| For initial level, β0p | |||||
| Intercept, γ00 | 99.69 | 0.88 | 113.65*** | ||
| For linear growth rate, β1p | |||||
| Intercept, γ10 | 0.27 | 0.11 | 2.55* | ||
| Random | |||||
| Intercept, u0 | 204.40 | 19.29 | 10.60*** | ||
| Slope, u1 | 0.75 | 0.31 | 2.34** | ||
| Residual variance, e2 | 37.26 | 3.22 | 11.55*** |
p < .05.
p < .01.
p < .001.
The bottom panel of Table 2 shows the estimates of the random effects of the individual growth curves, indicating significant interindividual differences in intraindividual change in affect optimization. The results show significant between-person variation in both intercepts (u0) and slopes (u1) for affect optimization. This indicates that participants did not only vary significantly from the sample mean in terms of levels of affect optimization in 1992 but also in rates of change over the 6-year observation period.
Results also showed that the rate of change in affect optimization was negatively correlated with the initial level, r = −.44, p < .001. Given that affect optimization showed a mean pattern of positive change, the negative correlation between initial level and rate of change suggests that individuals who were initially lower in affect optimization tended to show greater increases over time than individuals who had initially higher scores. In summary, these results provided evidence in support of significant individual differences in the 6-year change trajectories for affect optimization.
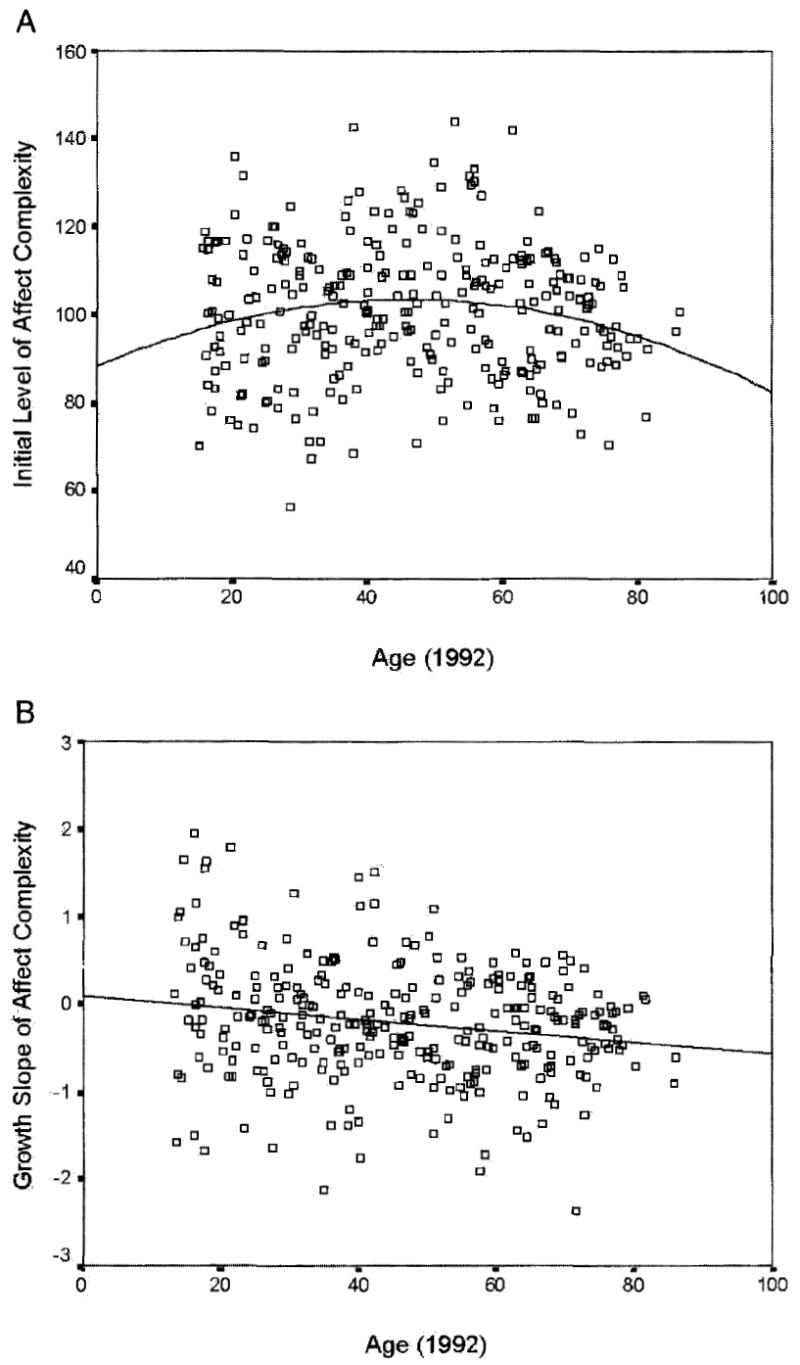
The results from the second set of analyses, examining whether individuals who entered the study at different ages changed at different rates in affect optimization across the 6-year observation period are shown in Table 3. As can be seen in Table 3, age showed a significant linear, γ 01 = .26, p < .001, and a significant quadratic relationship, γ02 = −.005, p < .05, with initial level. Specifically, initial level of affect optimization increased with age, up until about age 60, and leveled off thereafter (see Figure 1, Panel A). In terms of the rate of change in affect optimization over the 6-year period, there was a significant interaction between time and age, indicating that individuals with different ages at entry into the study changed differently across the observation period. Inspection of the rates of change across age showed that the rates of change for affect optimization decelerated with age up to the age 60; between age 60 and 70, the rates of change tended to be flat, and they started to accelerate again starting around age 80 (see Figure 1, Panel B).
Table 3.
Fixed and Random Effects of Change Trajectories for Affect Optimization Examining Interaction of Age With Time
| Effects | Estimate | SE | t ratio | z |
|---|---|---|---|---|
| Fixed | ||||
| For initial level, β0p | ||||
| Intercept, γ00 | 101.51 | 1.22 | 83.26*** | |
| Age, γ01 | 0.26 | 0.04 | 5.92*** | |
| Age2, γ02 | −0.005 | 0.002 | −2.07* | |
| For linear growth rate, β1p | ||||
| Intercept, γ10 | 0.06 | 0.15 | 0.39 | |
| Age × Time, γ11 | −0.01 | 0.005 | −2.01* | |
| Age2 × Time, γ12 | 0.001 | 0.000 | 1.93+ | |
| Random | ||||
| Intercept, u0 | 180.39 | 17.35 | 10.40*** | |
| Slope, u1 | 0.67 | 0.32 | 2.13* | |
| Residual variance, e2 | 37.28 | 3.23 | 11.54*** |
p < .10.
p < .05.
p < .001.
Figure 1.

Scatterplots of intercepts (i.e., initial levels, Panel A) and slopes (i.e., rates of change, Panel B) for affect optimization in relation to participants’ age in 1992.
In summary, the results from this set of analyses suggest that individuals of different ages had different levels of affect optimization at entry into the study and showed different rates of change over the 6-year period. Specifically, initial levels of affect optimization tended to be positively associated with age up to age 60 and leveled off from then on. Rates of change in affect optimization had a negative association with age from adolescence to late middle age, whereas in late life the rate of change tended to be positively associated with age.
Trajectories of Change in Affect Complexity
The top panel of Table 4 provides information about the fixed effects of the growth function of affect complexity, indicating the average change trajectory for affect complexity in the entire sample. The estimate for the mean level in affect complexity (γ00) was 100.88, which was significantly different from zero. The estimate of the mean rate of change in affect complexity (γ10) was −.19, p < .05, indicating a significant negative average rate of change in affect complexity over the 6-year interval.
Table 4.
Estimates of Fixed and Random Effects of Change Trajectories for Affect Complexity
| Effects | Estimate | SE | t ratio | z |
|---|---|---|---|---|
| Fixed | ||||
| For initial level, β0p | ||||
| Intercept, γ00 | 100.88 | 0.84 | 119.61*** | |
| For linear growth rate, β1p | ||||
| Intercept, γ10 | −0.19 | 0.12 | −1.59 | |
| Random | ||||
| Intercept, u0 | 186.30 | 17.74 | 10.50*** | |
| Slope, u1 | 1.34 | 0.40 | 3.34*** | |
| Residual variance, e2 | 37.56 | 3.41 | 11.03*** |
p < .001.
The bottom panel of Table 4 shows the estimates of the random effects of the individual growth curves, indicating significant interindividual differences in intraindividual change in affect complexity. The results show significant between-person variation in both intercepts (u0) and slopes (u0) for affect complexity. This indicates that participants did not only vary significantly from the sample mean in terms of levels of affect complexity in 1992, but also in rates of change over the 6-year observation period.
Results also showed that the rate of change in affect complexity was negatively correlated with the initial level, r = − .14, p < .05. Given that the sample pattern of change for affect complexity was negative, the negative correlation between initial level and rate of change suggests that individuals who were initially lower in affect complexity tended to show greater declines over time, whereas individuals with initially higher levels of affect complexity tended to show smaller declines. In summary, these results provided evidence in support of significant individual differences in the 6-year change trajectories for affect complexity.
The results from the second set of analyses, examining whether individuals who entered the study at different ages changed at different rates are shown in Table 5. As can be seen in Table 5, the estimate for a linear association between age and initial level of affect complexity was not statistically significant, whereas the estimate for the quadratic effect of age was significant, γ02 = − .005, p < .05. The data indicated that initial level of affect complexity was positively associated with age up until middle age (i.e., around age 45); after about the age of 45, the association between initial level of affect complexity and age became negative (see Figure 2, Panel A).
Table 5.
Fixed and Random Effects of Change Trajectories for Affect Complexity Examining Interaction of Age With Time
| Effects | Estimate | SE | t ratio | z |
|---|---|---|---|---|
| Fixed | ||||
| For initial level, β0p | ||||
| Intercept, γ00 | 103.23 | 1.23 | 84.16*** | |
| Age, γ01 | −0.01 | 0.04 | −0.23 | |
| Age2, γ02 | −0.007 | 0.002 | −2.64*** | |
| For linear growth rate, β1p | ||||
| Intercept, γ10 | −0.36 | 0.17 | −2.17* | |
| Age × Time, γ11 | −0.02 | 0.001 | −3.55*** | |
| Age2 × Time, γ12 | 0.001 | 0.000 | 1.43 | |
| Random | ||||
| Intercept, u0 | 182.70 | 17.49 | 10.45*** | |
| Slope, u1 | 1.18 | 0.38 | 3.06** | |
| Residual variance, e2 | 37.40 | 3.38 | 11.08*** |
p < .05.
p < .01.
p < .001.
Figure 2.
Scatterplots of intercepts (i.e., initial levels, Panel A) and slopes (i.e., rates of change, Panel B) for affect complexity in relation to participants’ age in 1992.
In terms of the rate of change in affect complexity over the 6-year period, there was a significant interaction between time and age, γ11 = −.02, p < .001, indicating that individuals with different ages at entry into the study changed differently across the observation period. Inspection of the data showed that, in general, affect complexity tended to decrease over time and that the rate of change accelerated with age (see Figure 2, Panel B). That is, with increasing age, individuals tended to show greater decline in affect complexity.
In summary, the results from this set of analyses showed that age had a nonlinear association with initial level of affect complexity. That is, initial level of affect complexity was positively associated with age up until about age 45, whereas the association with age after age 45 became negative. In addition, findings showed that individuals with different ages at entry into the study changed differently over time. Although the association between age and rate of change in affect complexity was negative, this association was significantly more pronounced in the later half of the adult life span.
Discussion
The current study provides further evidence in support of our hypothesis that affect optimization and affect complexity show different courses of development across the adult life span. Affect optimization and affect complexity serve somewhat different functions, are based on somewhat different mechanisms, and show different courses of development.
Life Course of Affect Optimization
Our core hypothesis was that the two modes reflect different dimensions of affect regulation and exhibit different developmental trajectories. This hypothesis was based on an extension (see Labouvie-Vief, 2003; Labouvie-Vief & Márquez, 2004) of Piaget’s (1954/1981) assimilation–accommodation paradigm and suggests that the mode of affect optimization is a primarily automatic, hedonically organized mode aimed at the maximization of positive affect and minimization of negative affect. This mode of functioning is inherent in the increasing reliance on well-integrated and smoothly functioning cognitive–affective schemas that provide individuals with well-rehearsed and successful solutions to many emotion regulation problems. In this way, this mode maintains relatively low levels of arousal as it permits the individual to dampen out schema-incongruent deviations. In contrast, affect complexity involves the elaboration and amplification of affect, a mode of processing that is resource demanding and involves complex representations of emotions of contradictory and opposing valence.
In accord with our predictions, affect optimization showed the predicted pattern of age-related differences as well as 6-year changes. Our data indicated that at initial testing in 1992, age and level of affect optimization were related in a nonlinear fashion, with mean levels increasing over the course of early adulthood up to late middle age and leveling off in later adulthood. Confirming this pattern longitudinally, analyses of individual change trajectories over the 6-year period indicated that the rates of change for affect optimization decelerated with age. Thus, the most rapid change in affect optimization took place in individuals in the early to middle adulthood stages. Thereafter, it came to a virtual stand still between the age of 60 and 70, with a possible positive rate of change (i.e., increase) in affect optimization starting for some individuals around the age of 80.
In general, it is noteworthy that the pattern of age differences in affect optimization observed cross-sectionally and the pattern of change over the 6-year interval show a high degree of convergence. Because the former reflects, in essence, age-cohort differences but the latter reflects longitudinal changes, this pattern indicates that within the limits of the current design, estimates for age differences and age changes are congruent. Hence, it appears that the relationship of age at entry into the study and affect optimization is not merely an artifact of cross-sectional assessment in which age-related patterns may, in actuality, be a result of cohort differences. The fact that 6-year changes indicated a highly convergent pattern suggests that our results may reflect a more robust pattern of genuine longitudinal changes. Nevertheless, despite this convergence of cross-sectional and longitudinal pattern, our design has not truly disentangled the roles of age and cohort, and the evidence for some convergence must be taken with a degree of caution. However, conclusions of developmental research are necessarily constrained by this inherent correlation of age and birth cohort and generalization to cohorts born at times considerably earlier or later are thus limited.
With that cautionary note, another finding with regard to affect optimization is intriguing. Positive changes in affect optimization occurred primarily from young to middle adulthood and slowed down in later life, with the exception of very old age when again positive change trajectories were observed. This finding may suggest that the mechanisms in the rise of affect optimization from youth to later middle adulthood may be quite different from those of late life. That is, the increases in affect optimization up to about the age of 60 appear to represent a developmental phenomenon typical of the period that precedes relatively precipitous aging. For example, they suggest that differences in positive affect balance between young adults and those in late midlife may not reflect aging patterns, per se, but rather the slowing down—and coming to maturity—of a process of earlier adulthood. In contrast, the accelerated changes in very old age may well reflect different processes, such as those related to degenerative processes of aging.
If our interpretation is correct, it would imply that the widely used strategy of comparing young adults and individuals in late midlife (i.e., the “young-old”) may not, or may not only, assess processes that may be important in late life, such as making adjustments initiated by a person’s vulnerability and his or her awareness of time and death (e.g., Carstensen, Fung, & Charles, 2003). Rather, our interpretation suggests that genuine increases in self-regulatory capacity may primarily take place in the period up to midlife when the capacity for complex cognitive–affective experience is joined with the ability to optimize affect (Labouvie-Vief, 2005). In contrast, increases in affect optimization in the elderly appear to reflect compensatory adjustments to declines in affect complexity, as further detailed below. If this interpretation is correct, it would be important in future research to examine the total developmental trajectory of affect regulation from young adulthood to very old age, as research based on comparisons between young and old adults may capture developmental processes that are normative for earlier parts of the adult life span— that is, up to late middle age.
Life Course of Affect Complexity
In contrast to affect optimization, level of affect complexity showed a different relationship with age at initial testing in 1992. Replicating the general findings of Labouvie-Vief and collaborators (Labouvie-Vief et al., 1989; Labouvie-Vief, Chiodo, et al., 1995; Labouvie-Vief, Diehl, et al., 1995), middle aged adults had the highest level of affect complexity, with the young and older age groups scoring significantly lower. Estimation of individual 6-year change slopes, on the other hand, suggested a pattern of modest longitudinal changes with the regression line of slope values on age showing a negative value. Most of the positive change occurred during the earlier part of the adult life span (see Figure 2, Panel B), but starting at about age 60, the majority of the estimated slopes for affect complexity tended to be negative, suggesting that in later life, declines in affect complexity predominate over increases. Overall, the longitudinal estimates suggest a less positive pattern of developmental change than do the cross-sectional ones.
In addition to the mean slope values, inspection of the scatter of intraindividual slope values tends to be informative. Across the entire age range, the variability of slope values was substantial, ranging from pronounced increases to similarly pronounced decreases over the 6-year period. Nevertheless, the pattern suggested that with advancing age, the values of 6-year changes tended to become successively smaller and more frequently negative.
It is interesting in that context to note that our measures of affect complexity in the past (e.g., Labouvie-Vief, Chiodo, et al., 1995; Labouvie-Vief, Diehl, et al., 1995) have shown a strong correlation with fluid intelligence, particularly for the older portion of the sample. Since fluid abilities are usually taken to reflect more directly the biological limits and “mechanics” of cognitive processes, this may suggest increasingly strong cognitive constraints on growth processes as age advances. If that interpretation is correct, it directly supports our interpretation of affect complexity as a high resource dependent process. It would also explain the fact that longitudinally, few if any positive changes occur over the adult life span. Nevertheless, we are aware that other interpretations of affect complexity may not similarly emphasize cognitive resources, per se.
Variability in 6-Year Patterns
Although our work has yielded significant age differences and age changes, it was evident that large interindividual differences in intraindividual change existed in the data. This was indicated by the significant random effects of the multilevel analyses. Similarly, inspection of the figures showed that at all age-cohort levels, interindividual variation was the rule rather than the exception. This was also true of the 6-year changes. For example, although the average slopes for affect optimization indicated a diminution of the rate of change up to the age of 60, increases as well as decreases in affect optimization were found for individuals at all age levels. Similarly, although affect complexity tended to decline for the sample in general, there were strong interindividual differences in negative slopes and many interindividual differences indicative of positive change. The current analyses did not address the why of these differences, which are likely related not only to age but also to demographic characteristics such as income and education as well as to profiles of physical and psychological health. It is our aim to address reasons for these interindividual differences in change patterns more specifically in future work.
The question of variability is particularly interesting in light of the high stability coefficients that suggest relatively trait-like patterns rather than state-like ones (see Costa & McCrae, 1994; Mroczek & Spiro, 2003; Roberts & DelVecchio, 2000: Robins, Fraley, Roberts, & Trzesniewski, 2001). This is important to note, because a simple inspection of the stability coefficients (see Table 2) would have led to a less differentiated and possibly erroneous conclusion with regard to changes in affect optimization and affect complexity over time. Thus, the current findings provide a strong case in support of intraindividual growth curve analyses via multilevel modeling (Raudenbush & Bryk, 2002; Singer & Willett, 2003) as the method of choice for assessing interindividual differences in intraindividual change.
Conclusions and Caveats
In sum, our data carry several implications for the study of cognitive–affective development in adulthood and later life. First, the notion of dynamic integration and compensation suggests greater caution about simple hedonic interpretations of “good” self-regulation and places the terms affect optimization and affect complexity into a broader framework. In distinguishing affect optimization and affect complexity as clearly different though interacting processes, this framework suggests more careful analyses of different ways of adapting. The present study offers one step towards such an analysis of different change patterns in aging and, indeed, across the total life span.
One limitation of the present study is, that despite its sequential nature, the time interval covered is relatively short. As a consequence, generalizations of patterns of change must be treated with some caution, because the patterns of change remain related to cohort rather than age, per se. We hope to address this possible problem in future waves of this ongoing study. Nevertheless, it is important to add that even in more complex sequential studies, age and cohort cannot be completely removed and generalizations with respect to patterns of change, in principle, are limited by the cohort and historical time under consideration.
A second limitation is that the current study did not address the issue of how changes in affect complexity are linked to changes in affect optimization across the adult life span. The dynamic linkage and integration (or disintegration) of the two modes of affect regulation are an integral part of DIT that we will be addressing in separate analyses, using dual change score modeling.
If correct, our interpretation of a dynamic relationship between different affect regulation strategies carries implications well beyond the relatively molar analyses presented here, which were based on paper-and-pencil, self-report assessments. In particular, future research will need to investigate the precise relationship between affect-regulatory and cognitive mechanisms that form the core of the dynamic integration thesis. We have begun to do so in an experimental context and have obtained evidence that the elderly indeed tend to have greater difficulty regulating arousing/activating events once they are activated (Labouvie-Vief, Slater, & Jain, 2007; Wurm, Labouvie-Vief, Aycock, Rebucal, & Koch, 2004). However, much remains to be investigated about the combined role of the dynamic linkage of cognitive regulation and emotional activation in adulthood and later life.
Acknowledgments
Portions of this research were completed while Gisela Labouvie-Vief was at Wayne State University. The project was supported by Grant R01 AG009203 from the National Institute on Aging. Manfred Diehl’s contributions to the research were additionally supported by Grant R01 AG21147 from the National Institute on Aging.
Appendix
California Psychological Inventory (CPI; Gough, 1987)–Based Defense and Coping Processes Used to Define Affect Optimization and Affect Complexity
| CPI-based process | Description | Defining Level |
|---|---|---|
| Affect optimization | ||
| Denial | Individual ignores past and present facts that would be unpleasant to acknowledge and instead focuses on the benign. | High |
| Regression | Individual exhibits inappropriate behavior and fantasy in order to avoid responsibility and aggression from others and/or self. | Low |
| Doubt | Individual has a tentative attitude; he or she doubts the validity of his or her perception and has trouble making decisions. | Low |
| Regression in the service of the ego | Individual does not attend to feelings and nonrational processes in a rich and flexible way. | Low |
|
| ||
| Affect complexity | ||
| Intellectuality | Individual is able to detach from restrictions of the environment and the self, so as to give his or her thoughts free rein. | High |
| Intellectualization | Individual retreats from affect to formulation of words and abstractions which are often inappropriate to the specific situation. | High |
| Tolerance of ambiguity | Individual copes with cognitive and affective complexity or dissonance; gray areas are accepted. | High |
| Repression | Individual consciously or unconsciously forgets; gaps in memory. | Low |
Footnotes
It should be noted that the definition of cognitive–affective complexity in this research differs in emphasis from some other notions of affect complexity in its explicit emphasis on emotional representation and the capacity to integrate a number of differentiated elements within a single concept of representation.
We had no data for 12 participants on the relevant variables because their data were either incomplete or these individuals had not been administered the measures that were used to derive the linear composites for affect optimization and affect complexity.
In our attempt to retain the largest sample possible, we performed several analyses in which we tried to include the participants who only had one data point. Across three different software packages (i.e., SAS, HLM, SPSS), these analyses, however, failed to converge, which was due to the fact that most of the data were missing for the first time of measurement, resulting in the difficulty in estimating these participants’ intercept at the first occasion of measurement.
In accordance with the instructions for administration (Gough, 1987), in 1992, the CPI was not administered to 28 early adolescents (age 10–14 years). In addition, 9 participants had incomplete data so that no valid CPI scale scores could be calculated for these individuals, resulting in a maximum sample size of 363 individuals with valid CPI scores for the first time of measurement (see Diehl et al., 1996).
One reviewer suggested that we should have clocked time in terms of participants’ age and then used age group/cohort to examine whether change over time differed by age group/cohort. Although in principle this seems to be a reasonable suggestion, we chose years since inception of the study to clock time because we wanted to avoid redundancy in the model when examining whether change over time differed for participants of different ages. In this study, cohort has the meaning of birth cohort and is, by definition, not independent of participants’ age.
Contributor Information
Gisela Labouvie-Vief, Department of Psychology, University of Geneva, Geneva, Switzerland.
Manfred Diehl, Department of Human Development and Family Studies, Colorado State University.
Elizabeth Jain, Department of Psychology, Wayne State University.
Fang Zhang, Department of Psychology, Assumption College.
References
- Baltes PB, Baltes MM. Psychological perspectives on successful aging: The model of selective optimization with compensation. In: Baltes PB, Baltes MM, editors. Successful aging: Perspectives from the behavioral science. New York: Cambridge University Press; 1990. pp. 1–34. [Google Scholar]
- Blanchard-Fields F. Social schemacity and causal attributions. In: Hess TM, Blanchard-Fields F, editors. Social cognition and aging. San Diego, CA: Academic Press; 1999. pp. 219–236. [Google Scholar]
- Blanchard-Fields F, Norris L. Causal attributions from adolescence through adulthood: Age differences, ego level, and generalized response style. Aging and Cognition. 1994;1:67–86. [Google Scholar]
- Brandtstädter J, Greve W. The aging self: Stabilizing and protective processes. Developmental Review. 1994;14:52–80. [Google Scholar]
- Cabeza R. Hemispheric asymmetry reduction in older adults: The HAROLD model. Psychology and Aging. 2002;17:85–100. doi: 10.1037//0882-7974.17.1.85. [DOI] [PubMed] [Google Scholar]
- Cacioppo JT, Berntson GG. Relationship between attitudes and evaluative space: A critical review, with emphasis on the separability of positive and negative substrates. Psychological Bulletin. 1994;115:401–423. [Google Scholar]
- Carstensen L, Charles S, Issacowitz D. Applying science to human behavior. American Psychologist. 2000;55:343. doi: 10.1037/0003-066x.55.3.343.a. [DOI] [PubMed] [Google Scholar]
- Carstensen L, Fung H, Charles S. Socioemotional selectivity theory and the regulation of emotion in the second half of life. Motivation & Emotion. 2003;27:103–123. [Google Scholar]
- Carstensen L, Isaacowitz D, Charles S. Taking time seriously: A theory of socioemotional selectivity. American Psychologist. 1999;54:165–181. doi: 10.1037//0003-066x.54.3.165. [DOI] [PubMed] [Google Scholar]
- Chaiken S, Trope Y. Dual-process theories in social psychology. New York: Guilford; 1999. [Google Scholar]
- Charles S, Reynolds C, Gatz M. Age-related differences and change in positive and negative affect over 23 years. Journal of Personality and Social Psychology. 2001;80:136–151. [PubMed] [Google Scholar]
- Clore G, Ortony A. Cognition in emotion: Always, sometimes, or never? In: Lane RD, Nadel L, editors. Cognitive neuroscience of emotion. London, United Kingdom: Oxford University Press; 2000. pp. 24–61. [Google Scholar]
- Costa PT, McCrae RR. Set like plaster? Evidence for the stability of adult personality. In: Heatherton TF, Weinberger JL, editors. Can personality change? Washington, DC: American Psychological Association; 1994. pp. 21–40. [Google Scholar]
- Diehl M, Coyle N, Labouvie-Vief G. Age and sex differences in strategies of coping and defense across the life span. Psychology and Aging. 1996;11:127–139. doi: 10.1037//0882-7974.11.1.127. [DOI] [PubMed] [Google Scholar]
- Epstein S, Pacini R. Some basic issues regarding dual-process theories from the perspective of cognitive-experiential self-theory. In: Chaiken S, Trope Y, editors. Dual-process theories in social psychology. New York: Guilford; 1999. pp. 462–482. [Google Scholar]
- Erikson E. Reflections on the last stage—and the first. Psychoanalytic Study of the Child. 1984;39:155–165. doi: 10.1080/00797308.1984.11823424. [DOI] [PubMed] [Google Scholar]
- Eysenck MW. Arousal, learning, and memory. Psychological Bulletin. 1976;83:389–404. [PubMed] [Google Scholar]
- Fischer KW, Bidell TR. Dynamic development of psychological structures in action and thought. In: Damon W, Lerner RM, editors. Handbook of child psychology: Vol I. Theoretical models of human development. 5. Hoboken, NJ: Wiley; 1998. [Google Scholar]
- Gough HG. California Psychological Inventory Administrator’s guide. Palo Alto, CA: Consulting Psychologists Press; 1987. [Google Scholar]
- Haan N, editor. Coping and defending: Processes of self-environment organization. New York: Academic Press; 1977. [Google Scholar]
- Harris P. Understanding emotion. In: Lewis M, Haviland-Jones JM, editors. Handbook of emotion. 2. New York: Guilford; 2000. pp. 281–292. [Google Scholar]
- Harter S. The construction of the self: A developmental perspective. New York: Guilford; 1999. [Google Scholar]
- Harter S, Monsour A. Development analysis of conflict caused by opposing attributes in the adolescent self-portrait. Developmental Psychology. 1992;28:251–260. [Google Scholar]
- Hasher L, Zacks RT. Working memory, comprehension, and aging: A review and a new view. In: Bower GH, editor. The psychology of learning and motivation: Advances in research and theory. Vol. 22. San Diego, CA: Academic Press; 1988. pp. 193–225. [Google Scholar]
- Hashtroudi S, Johnson M, Chrosniak L. Aging and source monitoring. Psychology and Aging. 1989;4:106–112. doi: 10.1037//0882-7974.4.1.106. [DOI] [PubMed] [Google Scholar]
- Helson R, Wink P. Two conceptions of maturity examined in the findings of a longitudinal study. Journal of Personality and Social Psychology. 1987;53:531–541. doi: 10.1037//0022-3514.53.3.531. [DOI] [PubMed] [Google Scholar]
- Hess T, Rosenberg D, Waters S. Motivation and representational processes in adulthood: The effects of social accountability and information relevance. Psychology and Aging. 2001;16:629–642. [PubMed] [Google Scholar]
- Joffe P, Naditch MP. Paper and pencil measures of coping and defense processes. In: Haan N, editor. Coping and defending: Processes of self-environment organization. New York: Academic Press; 1977. pp. 280–294. [Google Scholar]
- Johnson MK, Mitchell KJ, Raye CL, Greene EJ. An age-related deficit in prefrontal cortical function associated with refreshing information. Psychological Science. 2004;15:127–132. doi: 10.1111/j.0963-7214.2004.01502009.x. [DOI] [PubMed] [Google Scholar]
- Kensinger EA, Piguet O, Krendl AC, Corkin S. Memory for contextual details: Effects of emotion and aging. Psychology and Aging. 2005;20:241–250. doi: 10.1037/0882-7974.20.2.241. [DOI] [PubMed] [Google Scholar]
- LaBar KS, Phelps EA. Arousal-mediated memory consolidation: Role of the medial temporal lobe in humans. Psychological Science. 1998;9:490–493. [Google Scholar]
- Labouvie-Vief G. Cognitive–emotional integration in adulthood. In: Schaie KW, Lawton MP, editors. Annual review of gerontology and geriatrics: Vol 17. Focus on emotion and adult development. New York: Springer; 1998. pp. 206–237. [Google Scholar]
- Labouvie-Vief G. Emotions in adulthood. In: Bengtson VL, Schaie KW, editors. Handbook of theories of aging. New York: Springer; 1999. pp. 253–267. [Google Scholar]
- Labouvie-Vief G. Dynamic integration: Affect, cognition, and the self in adulthood. Current Directions in Psychological Science. 2003;12:201–206. [Google Scholar]
- Labouvie-Vief G. Self-with-other representations and the organization of the self. Journal of Research in Personality. 2005;39:185–205. [Google Scholar]
- Labouvie-Vief G, Chiodo LM, Goguen LA, Diehl M, Orwoll L. Representations of self across the life span. Psychology and Aging. 1995;10:404–415. doi: 10.1037//0882-7974.10.3.404. [DOI] [PubMed] [Google Scholar]
- Labouvie-Vief G, DeVoe M, Bulka D. Speaking about feelings: Conceptions of emotion across the life span. Psychology and Aging. 1989;4:425–437. doi: 10.1037//0882-7974.4.4.425. [DOI] [PubMed] [Google Scholar]
- Labouvie-Vief G, Diehl M, Chiodo LM, Coyle N. Representations of self and parents across the life span. Journal of Adult Development. 1995;2:207–222. [Google Scholar]
- Labouvie-Vief G, Márquez M. Dynamic integration: Affect optimization and differentiation in development. In: Dai DY, Steinberg RJ, editors. Motivation, emotion, and cognition. Mahwah, NJ: Erlbaum; 2004. pp. 237–272. [Google Scholar]
- Labouvie-Vief G, Medler SM. Affect optimization and affect complexity: Modes and styles of regulation in adulthood. Psychology and Aging. 2002;17:571–587. doi: 10.1037//0882-7974.17.4.571. [DOI] [PubMed] [Google Scholar]
- Labouvie-Vief G, Slater JM, Jain E. Affective processing as a function of age and regulation style. 2007 Manuscript submitted for publication. [Google Scholar]
- Lane R, Nadel L, editors. Cognitive neuroscience of emotion. London, United Kingdom: Oxford University Press; 2000. [Google Scholar]
- Lane R, Schwartz G. Levels of emotional awareness: A cognitive–developmental theory and its application to psychopathology. American Journal of Psychiatry. 1987;144:133–143. doi: 10.1176/ajp.144.2.133. [DOI] [PubMed] [Google Scholar]
- Lawton MP, Nahemow L. Ecology and the aging process. In: Eisdorfer C, Lawton MP, editors. The psychology of adult development and aging. Washington, DC: American Psychological Association; 1973. pp. 619–574. [Google Scholar]
- LeDoux J. The emotional brain: The mysterious underpinnings of emotional life. New York: Simon & Schuster; 1996. [Google Scholar]
- Lewis M. The emergence of human emotions. In: Lewis M, Haviland-Jones JM, editors. Handbook of emotions. 2. New York: Guilford; 2000. pp. 265–280. [Google Scholar]
- Li S, Lindenberger U, Sikström S. Aging cognition: From neuromodulation to representation. Trends in Cognitive Sciences. 2001;5:479–486. doi: 10.1016/s1364-6613(00)01769-1. [DOI] [PubMed] [Google Scholar]
- Littell RC, Milliken GA, Stroup WW, Wolfinger RD. SAS system for mixed models. Cary, NC: SAS Institute; 1996. [Google Scholar]
- Loevinger J. Origins of conscience. Psychological Issues. 1976;9:265–297. [Google Scholar]
- Mather M, Johnson M. Stereotype reliance in source monitoring: Age differences and neuropsychological test correlates. Cognitive Neuropsychology. 1999;16:437–458. [Google Scholar]
- Mather M, Johnson M. Choice-supportive source monitoring: Do our decisions seem better to us as we age? Psychology and Aging. 2000;15:596–606. doi: 10.1037//0882-7974.15.4.596. [DOI] [PubMed] [Google Scholar]
- Mayer J, Salovey P. Emotional intelligence and the construction and regulation of feelings. Applied & Preventive Psychology. 1995;4:197–208. [Google Scholar]
- Metcalfe J, Mischel W. A hot/cool-system analysis of delay of gratification: Dynamics of willpower. Psychological Review. 1999;106:3–19. doi: 10.1037/0033-295x.106.1.3. [DOI] [PubMed] [Google Scholar]
- Mikulincer M, Horesh N. Adult attachment style and the perception of others: The role of projective mechanisms. Journal of Personality and Social Psychology. 1999;76:1022–1034. doi: 10.1037//0022-3514.76.6.1022. [DOI] [PubMed] [Google Scholar]
- Mroczek D, Kolarz C. The effect of age on positive and negative affect: A developmental perspective on happiness. Journal of Personality and Social Psychology. 1998;75:1333–1349. doi: 10.1037//0022-3514.75.5.1333. [DOI] [PubMed] [Google Scholar]
- Mroczek D, Spiro A. Modeling intraindividual change in personality traits: Findings from the Normative Aging Study. Journals of Gerontology, Series B: Psychological Sciences and Social Sciences. 2003;58B:P153–P165. doi: 10.1093/geronb/58.3.p153. [DOI] [PubMed] [Google Scholar]
- Ong AD, Allaire JC. Cardiovascular intraindividual variability in later life: The influence of social connectedness and positive emotions. Psychology and Aging. 2005;20:476–485. doi: 10.1037/0882-7974.20.3.476. [DOI] [PubMed] [Google Scholar]
- Ong AD, Bergeman CS. The complexity of emotions in later life. Journals of Gerontology, Series B: Psychological Sciences and Social Sciences. 2004;59B:P117–P122. doi: 10.1093/geronb/59.3.p117. [DOI] [PubMed] [Google Scholar]
- Paulhus D, Lim D. Arousal and evaluative extremity in social judgments: A dynamic complexity model. European Journal of Social Psychology. 1994;24:89–99. [Google Scholar]
- Piaget J. Intelligence and affectivity: Their relationship during child development. Palo Alto, CA: Annual Review; 1981. Original work published 1954. [Google Scholar]
- Pratto F, John OP. Automatic vigilance: The attention-grabbing power of negative social information. Journal of Personality and Social Psychology. 1991;61:380–391. doi: 10.1037//0022-3514.61.3.380. [DOI] [PubMed] [Google Scholar]
- Pyszczynski T, Greenberg J, Solomon S. A dual-process model of defense against conscious and unconscious death-related thoughts: An extension of terror management theory. Psychological Review. 1999;106:835–845. doi: 10.1037/0033-295x.106.4.835. [DOI] [PubMed] [Google Scholar]
- Rahhal T, May C, Hasher L. Truth and character: Sources that older adults can remember. Psychological Science. 2002;13:101–105. doi: 10.1111/1467-9280.00419. [DOI] [PMC free article] [PubMed] [Google Scholar]
- Raudenbush S, Bryk A. Hierarchical linear models: Applications and data analysis methods. 2. Thousand Oaks, CA: Sage; 2002. [Google Scholar]
- Raz N. Aging of the brain and its impact on cognitive performance: Integration of structural and functional findings. In: Craik FIM, Salthouse TA, editors. The handbook of aging and cognition. 2. Mahwah, NJ: Erlbaum; 2000. pp. 1–90. [Google Scholar]
- Reich JW, Zautra AJ, Davis M. Dimensions of affect relationships: Models and their integrative implications. Review of General Psychology. 2003;7:66–83. [Google Scholar]
- Roberts B, DelVecchio W. The rank-order consistency of personality traits from childhood to old age: A quantitative review of longitudinal studies. Psychological Bulletin. 2000;126:3–25. doi: 10.1037/0033-2909.126.1.3. [DOI] [PubMed] [Google Scholar]
- Robins RW, Fraley RC, Roberts BW, Trzesniewski K. A longitudinal study of personality change in young adulthood. Journal of Personality. 2001;69:617–640. doi: 10.1111/1467-6494.694157. [DOI] [PubMed] [Google Scholar]
- Ryan R, Deci E. On happiness and human potentials: A review of research on hedonic and eudaimonic well-being. Annual Review of Psychology. 2001;52:141–166. doi: 10.1146/annurev.psych.52.1.141. [DOI] [PubMed] [Google Scholar]
- Salthouse T. Cognitive facets of aging well. Generations. 1991;15:35–38. [Google Scholar]
- Schaie KW. Intellectual development in adulthood: The Seattle Longitudinal Study. New York: Cambridge University Press; 1996. [Google Scholar]
- Schore A. Affect regulation and the origin of the self: The neurobiology of emotional development. Hillsdale, NJ: Erlbaum; 1994. [Google Scholar]
- Selye H. The stress of life. New York: McGraw-Hill; 1976. [Google Scholar]
- Singer JD, Willett JB. Applied longitudinal data analysis: Modeling change and event occurrence. New York: Oxford University Press; 2003. [Google Scholar]
- Tucker DM. Developing emotions and cortical networks. In: Gunnar MR, Nelson CA, editors. Developmental behavioral neuroscience. Hillsdale, NJ: Erlbaum; 1992. pp. 75–128. [Google Scholar]
- von Hippel W, Silver L, Lynch M. Stereotyping against your will: The role of inhibitory ability in stereotyping and prejudice among the elderly. Personality and Social Psychology Bulletin. 2000;26:523–532. [Google Scholar]
- Wurm LH, Labouvie-Vief G, Aycock J, Rebucal KA, Koch HE. Performance in auditory and visual emotional Stroop tasks: A comparison of younger and older adults. Psychology and Aging. 2004;19:523–535. doi: 10.1037/0882-7974.19.3.523. [DOI] [PubMed] [Google Scholar]
- Yehuda R, McEwen BS. Protective and damaging effects of the biobehavioral stress response: Cognitive, systemic, and clinical aspects. ISPNE XXXIV meeting summary. Psychoneuroimmunology. 2004;29:1212–1222. doi: 10.1016/j.psyneuen.2004.01.006. [DOI] [PubMed] [Google Scholar]
- Yerkes RM, Dodson JD. The relation of strength of stimulus to rapidity of habit formation. Journal of Comparative Neurology and Psychology. 1908;18:459–482. [Google Scholar]
- Zautra AJ. Emotions, stress, and health. New York: Oxford University Press; 2003. [Google Scholar]