Abstract
Long-lived near-infrared phosphors with high quantum yields have recently become available, making it possible to image oxygen distributions in tissue in three dimensions. By numerical simulations we demonstrate that, by using phosphorescent probes with appropriate oxygen quenching constants, one can image hypoxic phantoms in scattering media with adequate spatial resolution, employing simple time-gated measurements. The approach developed will guide experimental imaging of phosphorescence lifetime and oxygen pressure in living tissue.
In the past several years optical tomography with exogenous contrast agents has become an area of extensive investigations.1 Biodistribution of luminescent dyes and, in some cases, their photophysical properties often correlate with physiologically important parameters of tissue, e.g., areas of enhanced (or suppressed) activity of enzymes.2 Imaging with luminescent tracers has historically been dominated by fluorescence. There are many more fluorescent probes (nanosecond lifetimes) with high quantum yields than there are phosphorescent probes, and some fluorophores are approved clinically.3 ln addition, some investigators have suggested that using phosphorescent probes in diffuse imaging is not feasible because the probes’ long lifetimes would prevent localization of objects hidden deep in tissues.4,5 Their analysis, however, did not take into account that phosphorescence lifetimes may vary significantly in tissues. It relied on the assumption that lifetime-based contrast in phosphorescence lifetime imaging (PLI) has the same origin as fluorescence lifetime imaging,6,7 which is erroneous. Recent progress in the development of phosphorescent probes for intravascular use8 and the importance of tomographic imaging of oxygen by luminescence quenching9,10 prompted us to clarify the role of the probe’s excited-state lifetime in contrast-enhanced optical imaging and in PLI in particular.
Intramolecular processes that lead to the generation of triplet states occur on a subpicosecond time scale and therefore can be considered instantaneous with respect to triplet lifetimes (tens to hundreds of microseconds). Similarly, triplet lifetimes are orders of magnitude longer than photon migration times (tens of nanoseconds), even if photons travel deep into tissue. Therefore, unlike fluorescence, phosphorescence is a quasi-static process with respect to the photon migration time scale. In fluorescence lifetime imaging, additional spatial contrast can be gained by use of the relationship between the signal kinetics and the probability of emission originating at a particular depth,4 but this is not relevant to PLI. In PLI, high contrast ratios are attainable because time-gated detection allows explicit separation of short-lived signals (e.g., owing to the background) from long-lived phosphorescence. This makes it possible to accurately localize phosphorescent objects hidden deep in scattering media.
A special area of application for phosphorescence imaging is detection and monitoring of tissue hypoxia.11 Luminescence quenching by oxygen in solution is a diffusion-controlled process, which typically follows the linear Stern-Volmer relationship in the range of physiologically relevant oxygen concentrations:
| (1) |
where τ and I are, respectively, the phosphorescence lifetime and the intensity that correspond to partial oxygen pressure pO2, τ0 and I0 are the phosphorescence lifetime and intensity, respectively, in the absence of oxygen, and kq is the bimolecular rate constant. The probability of collisional quenching by oxygen increases with an increase in the excited-state lifetime, making longer decaying probes more sensitive to small changes in oxygen concentration.
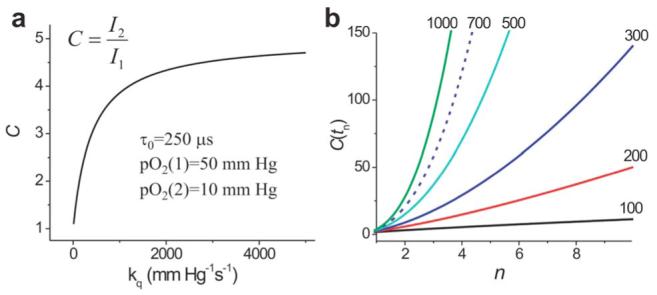
Consider a phosphorescent probe with τ0=250 μs,12 homogeneously distributed in a sample consisting of two equal volumes, i.e., normoxic tissue (pO2=50 mm Hg=50 Torr) and hypoxic tissue (pO2=10 mm Hg). If both volumes are excited with continuous-wave (cw) light of equal intensity, contrast C, defined as the ratio between emission intensities that corresponds to two volumes, will asymptotically approach the inverse ratio of the oxygen concentrations with an increase in constant kq [Fig. 1(a)].
Fig. 1.

(Color online) a, Dependence of contrast C on kq for two equally excited volumes with continuous-wave excitation; b, dependence of contrast C(tn) on index n for which tn=τ2 ln(n); tn, start of data integration values of kq for the curves are given in units of mm Hg-1 s-1 (1mm Hg=1 Torr).
Quenching constants can be tuned chemically over a broad range, e.g., 150-3000 mm Hg-1 s-1.8 Selecting a probe with a higher quenching constant would give better contrast; however, values of kq that are too high will cause the phosphorescence to be extremely weak even under relatively hypoxic conditions (pO2=10 mm Hg). Thus, for probes with kq s <1000 mm Hg-1/s-1 contrast ratios would not exceed 3-4 under cw excitation.
Time-gated detection can dramatically increase the contrast in phosphorescence images. For two volumes, characterized by lifetimes τ1 and τ2 and equally excited by a pulse of light, ratio C (contrast) of the phosphorescence signals will be a function of the delay, tn, introduced between the excitation pulse and the beginning of the data integration:
| (2) |
The penalty in this case is a decrease in signal-tonoise ratio (SNR): the longer the delay tn, the less signal is collected. As interest is primarily in the hypoxic region, it is useful to plot contrast C(tn) versus the τ2-related decrease index n, corresponding to the moment of time tn=τ2 ln(n) when the phosphorescence from the hypoxic region (τ2) has decreased n times [Fig. 1(b)]. For the values of pO2 from Fig. 1(a) and a phosphor with kq=700 mm Hg-1 s-1 (τ0=250 μs),12 a contrast of ∼20 will be attained when n=2 (tn=63 μs), and it will increase to 58 for n=3 (tn=100 μs) and to 121 for n=4 (tn=126 μs).
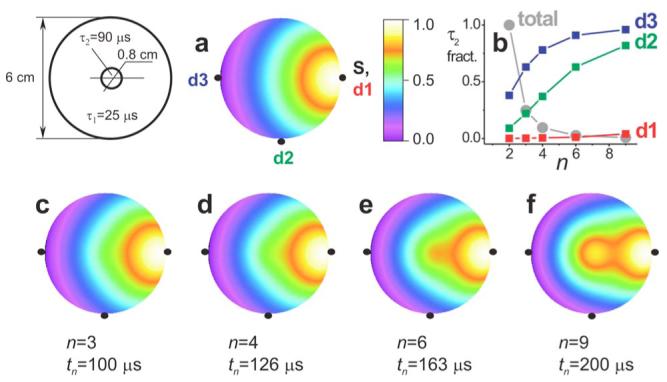
In imaging by diffuse light, areas located deep in tissue receive fewer excitation photons than do regions close to the boundary. The distribution of excitation photons injected from a boundary point source into a two-dimensional cylinder with a uniformly scattering and absorbing medium is shown in Fig. 2a. The simulations were performed by use of the diffusion approximation and the finite-element method.13
Fig. 2.

(Color online) a, Distribution of excitation density and c-f, individually normalized distributions of phosphorescence density (log scale) after delays tn in a two-dimensional object: μs=0.5 mm-1, μa=0.006 mm-1 (excitation), pO2=50 mm Hg (hypoxic region, pO2=10 mm Hg). b, Changes in fraction of the τ2 signal in detectors d1-d3 and relative changes in total photons (lighter shading).
Immediately after the excitation pulse, the transient distribution of the phosphorescence photon density in the volume will be almost exactly proportional to the distribution of the excitation photons. As a result, the signal in all the detectors (d1-d3, Fig. 2) will be dominated by the τ1 component. However, as the beginning of the data collection is delayed, the fraction of the long-lived phosphorescence (τ2) in the signal will become increasingly large. A sequence of transient photon density images, taken at different delays tn (Figs. 2c-2f), reveals that the hypoxic region behaves as a glowing luminescent bulb, continuing to emit photons after the signal from the normoxic medium (τ1) has decayed. The fraction of the signal corresponding to τ2 in all three detectors (Fig. 2d) grows with delay tn and in the case of detector d3 (transillumination) has already become greater than the τ1 signal after 83 μs (n=2.5).
Delays in collection of the emission result in dramatic improvement in the contrast of reconstructed images. In the case of long delays (e.g., n=6 and n=9), for which the hypoxic region is best seen in the maps of the photon density, the signal level becomes insufficient for adequate data processing. More-realistic delays are those when n=2-4, where the fraction of the τ2 decay in all the detectors is already high enough for the reconstruction algorithm to detect the phantom (Fig. 3).
Fig. 3.

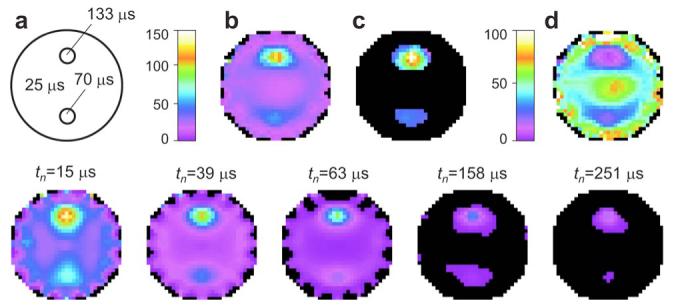
Images of a hypoxic phantom (τ2=90 μs), a,in a normoxic volume (τ1=25 μs; Fig. 2) and, b-d, reconstructed from boundary data acquired after delays tn=τ2 ln(n).
In Fig. 3 the boundary data were simulated for 240 source-detector pairs (16 sources, 15 detectors), with sources and detectors distributed equally at the periphery of the object. Normally distributed noise (SNR, 50 for n=2; tn=63 μs) was added to the data.14 The reconstruction was performed by the self-scaling recursive maximum-entropy method with an autoadjustable regularization parameter.15 In all the recovered images, the hypoxic phantom is seen in the center of the object; however, for n=1 (Fig. 3b) it is surrounded by a strong halo. The image is better resolved at n=2, and at n=4 the contrast becomes extremely high. Notably, the SNR in the last set (n=4) is only 25, but the recovery still occurs with excellent accuracy.
For mapping tissue oxygenation it is important to reconstruct not only the phosphorescence intensity images but the images of the phosphorescence lifetimes as they change throughout the volume (see above). Time-resolved data collection in PLI makes it possible to restore the decay rate in every element of the spatial grid by using a relatively simple approach. Since the intensity images, corresponding to delays tn, represent the total number of photons emitted by the elements of the volume, a series of such images can be fitted by probe function f(r,tn):
| (3) |
where r is a spatial coordinate and τ(r) and I0(r) are the images of lifetimes and initial intensities, respectively. Notably, the latter image is proportional to the spatial distribution of the probe. This simple procedure is possible because the kernel of the convolution in the inverse problem of the PLI is independent of τ(r),10 which is not the case for fluorescene lifetime imaging. Images τ(r) and I0(r), determined from this fitting, can be further refined by solution of the inverse problem over the combined set of data for all delays tn, using an appropriate positively constrained regularized nonlinear inversion method.
The approach described is illustrated in Fig. 4. A sequence of data sets (240 source-detector pairs) with logarithmically spaced delays tn=15-251 μs (SNR, 50; tn=63 μs) was simulated, and integral intensity images (some shown in the lower row) were reconstructed by the maximum-entropy method. The lifetime maps obtained by fitting either the whole sequence Fig. 4b or just the last images [tn=63-251 μs]; (Fig. 4c), show significantly different contrasts. Increasing the delay eliminates the background phosphorescence almost entirely, bringing into focus the hypoxic regions. The oxygen image (Fig. 4d), derived from the lifetime image (Fig. 4b), demonstrates that localization of the hypoxic phantoms can be accomplished with adequate accuracy even with this relatively simple procedure.
Fig. 4.

(Color online) a, Scattering object (Ø6cm, pO2=50 mm Hg) with two hypoxic regions: pO2=15 mm Hg (τ2=70 μs) and pO2=15mm Hg (τ3=133 μs). Lifetime images (microseconds), b, reconstructed from the whole sequence of intensity images (lower row) or, c, from the intensity images acquired at higher delays (tn>50 μs). d, Oxygen images (in millimeters of mercury) obtained from lifetime image. b, Bottom row, phosphorescence intensity images collected at difference delays tn and normalized by the maximal intensity in the first image (tn=15 μs). Same color scheme as for a-d.
In summary, we have shown that by selecting optimal long-lived probes and using time-resolved detection it is feasible to reconstruct images of phosphorescence lifetime and intensity in scattering volumes. The phosphor does not have to be confined to the region of interest (i.e., hypoxia) and can be distributed throughout the volume. Contrast can be greatly enhanced by use of an appropriate delay before beginning data collection.
Acknowledgments
Support by grants EB3663-01 to S. A. Vinogradov and NS-31465 to D. F. Wilson from the National Institutes of Health is gratefully acknowledged. We thank Brian W. Pogue (Dartmouth College) for useful discussions.
Footnotes
OCIS codes: 290.0290, 290.7050, 170.0170, 170.3010.
References
- 1.Hielscher AH. Curr. Opin. Biotechnol. 2005;16:79. doi: 10.1016/j.copbio.2005.01.002. and references therein. [DOI] [PubMed] [Google Scholar]
- 2.Ntziachristos V, Tung C, Bremer C, Weissleder R. Nat. Med. (N.Y.) 2002;8:757. doi: 10.1038/nm729. [DOI] [PubMed] [Google Scholar]
- 3.Licha K. Top. Curr. Chem. 2002;222:1. [Google Scholar]
- 4.Sevick-Muraca EM, Burch CL. Opt. Lett. 1994;19:1928. doi: 10.1364/ol.19.001928. [DOI] [PubMed] [Google Scholar]
- 5.Chen A, Sevic-Muraca EM. Proc. SPIE. 1997;2979:129. [Google Scholar]
- 6.O’Leary MA, Boas DA, Li XD, Chance B, Yodh AG. Opt. Lett. 1996;21:158. doi: 10.1364/ol.21.000158. [DOI] [PubMed] [Google Scholar]
- 7.Jiang H. Appl. Opt. 1998;37:5337. doi: 10.1364/ao.37.005337. [DOI] [PubMed] [Google Scholar]
- 8.Rietveld IB, Kim E, Vinogradov SA. Tetrahedron. 2003;59:3821. [Google Scholar]
- 9.Shives E, Xu Y, Jiang H. Opt. Express. 2002;10:1557. doi: 10.1364/oe.10.001557. [DOI] [PubMed] [Google Scholar]
- 10.Soloviev VY, Wilson DF, Vinogradov SA. Appl. Opt. 2004;43:564. doi: 10.1364/ao.43.000564. [DOI] [PubMed] [Google Scholar]
- 11.Wilson DF, Vinogradov SA. In: Handbook of Biomedical Fluorescence. Mycek M-A, Pogue BW, editors. Marcel Dekker; 2003. pp. 637–662. [Google Scholar]
- 12. Optical parameters of the prototype probe, Pd tetrabenzoporphyrin dendrimer: λmax (abs)=636 nm, ∊=82,000 M-1 cm-1, λmax(emiss)=810 nm, Øphos=0.2, Kq=718 mm Hg-1 s-1, τ0=246 μs.
- 13.Arridge SR. Inverse Probl. 1999;15:R41. doi: 10.1088/1361-6420/ac8a91. [DOI] [PMC free article] [PubMed] [Google Scholar]
- 14. SNR here is defined as the ratio of the signal at the start of the decay (before integration) to the amplitude of the noise. The SNR of a data set (decays for all source-detector pairs) is the SNR of the decay with maximal initial intensity. In the shot-noise limit and for the model experiment described, a SNR of 50 can easily be achieved by use of, e.g., 1 μs excitation pulses of 1 W LED and detection over an ∼5 mm2 boundary area.
- 15.Vinogradov SA, Wilson DF. Appl. Spectrosc. 2000;54:849. [Google Scholar]


