

Abstract
Calorie restriction (CR) extends life span in a wide variety of species. Recent studies suggest that an increase in mitochondrial metabolism mediates CR induced life span extension. Here we present evidence that Lat1 (dihydrolipoamide acetyltransferase), the E2 component of the mitochondrial pyruvate dehydrogenase complex (PDC), is a novel metabolic longevity factor in the CR pathway. Deleting the LAT1 gene abolishes life span extension induced by CR. Over-expressing Lat1 extends life span and this life span extension is not further increased by CR. Similar to CR, life span extension by Lat1 over-expression largely requires mitochondrial respiration indicating mitochondrial metabolism plays an important role in CR. Interestingly, Lat1 over-expression does not require the Sir2 family to extend life span, suggesting Lat1 mediates a branch of the CR pathway that functions in parallel to the Sir2 family. Lat1 is also a limiting longevity factor in non-dividing cells in that over expressing Lat1 extends cell survival during prolonged culture at stationary phase. Our studies suggest that Lat1 over-expression extends life span by increasing metabolic fitness of the cell. CR may therefore also extend life span and ameliorate age-associated diseases by increasing metabolic fitness through regulating central metabolic enzymes.
Calorie restriction (CR) is the most effective intervention known to extend life span in a variety of species including mammals (1,2). CR has also been shown to delay the onset or reduce the incidence of many age-related diseases (1). Although it has been suggested that CR may work by reducing the levels of reactive oxygen species due to a slowing in metabolism (1,3), the mechanism by which CR extends life span and ameliorates age-associated diseases is still uncertain.
Moderate CR can be imposed in the budding yeast S. cerevisiae by reducing the glucose concentration from 2% to 0.5% in rich media (4-9). Under this CR condition, the growth rate remains robust and yeast mother cells show an extended replicative life span (division potential) of about 20-30%. Variations in CR protocols have been described where limitation of amino acids and other nutrients accompany carbon source limitation (10,11). These regimens may represent another possible longevity pathway that functions in parallel to CR in rich media. Genetic models of CR have also been identified and studied in multiple strain backgrounds such as PSY316 (4,5,7), W303 (4,8,9,12) and BY4742 (13). These CR mimics include a hexokinase mutant (hxk2Δ) and mutations that down regulate the glucose sensing cyclic-AMP/ Protein Kinase A (PKA) pathway: the temperature sensitive alleles of the adenylate cyclase (cdc35-1) or the RAS nucleotide exchange protein (cdc25-10) and deletions of the glucose sensing protein GPA2 and GPR1. Additional CR genetic models, the tor1Δ and sch9Δ mutants, have recently been reported to extend yeast life span (14,15). The nutrient sensing TOR pathway and Sch9 kinase (a homolog of the Akt kinase family) are known to interact with the PKA pathway to regulate cell growth (16,17).
Many studies have linked CR to a conserved longevity factor, Sir2 (4,5,18-22). In yeast, CR requires NAD (nicotinamide adenine dinucleotide, oxidized form) and Sir2 (4), a key regulator of life span in both yeast and animals (23,24). Sir2 exhibits an NAD-dependent histone deacetylase activity that is conserved among the Sir2-family members (25-27) and is required for chromatin silencing and life span extension by CR (4,5). It has been suggested that yeast Sir2 extends life span by increasing chromatin silencing at specific genomic loci thereby decreasing genome instability and inappropriate gene expression (28). Yeast Sir2 may also increase the fitness of newborn cells by asymmetric partitioning of the oxidatively damaged proteins to mother cells (29). The Sir2 family in higher eukaryotes also plays an important role in CR induced life span extension. Both worm and fly Sir2 homologs are required for life span extension in several CR models (19,22).
In yeast, CR induces a shunting of carbon metabolism from fermentation to the mitochondrial TCA cycle (5). The concomitant increase in respiration is necessary and sufficient for the activation of Sir2-mediated silencing and extension in life span (5). The fact that respiration produces NAD from NADH (30,31) as well as the finding that NADH can function as a competitive inhibitor of Sir2 activity (7), reinforce the idea that an increase in the NAD/NADH ratio activates Sir2 during CR. A link between CR and increased mitochondrial metabolism has also been reported in mammals. For example, in mice, CR was found to increase levels of the endothelial nitric oxide synthase, eNOS, mediating an increase in respiration and mitochondrial biogenesis (20). Concomitant with an increase in eNOS concentration, enhanced expression of the mammalian Sir2 ortholog Sirt1 was observed, thus reinforcing the link between respiration and Sir2 activation (20).
Other mechanisms for CR induced Sir2-dependent life span extension demonstrate that nictotinamide (NAM), a by-product of NAD degradation in the Sir2-mediated deacetylation reaction (32) also affects Sir2 activity. Over-expression of the nicotinamidase, Pnc1, increases yeast life span and suppresses the inhibitory effect of NAM on Sir2 deacetylase activity in vivo and in vitro (8,33). Recently, a Sir2-independent CR pathway has been described (13). Two Sir2 family members, Hst2 and Hst1 have been suggested to play a role in this Sir2-independent pathway under certain CR conditions (9). It remains highly possible that CR also induces other proteins in addition to the Sir2 family to extend life span.
Many mitochondrial metabolic enzymes are regulated by the NAD/NADH ratio and are also likely to mediate CR induced life span extension. To further understand the mechanism of CR, we characterized one such metabolic target of CR-the conserved NAD-dependent pyruvate dehydrogenase complex, PDC. The PDC acts in the mitochondria to convert pyruvate into acetyl-CoA, (34) an activity regulated by the NAD/NADH ratio (35). In this study, we showed that a functional PDC is required for CR induced life span extension. Over-expressing components of the PDC extended life span suggesting PDC is a limiting longevity factor. The role of mitochondrial metabolism in CR and several genetic models of CR are also discussed.
Experimental Procedures
Strains and media
Yeast strain BY4742 MATa his3Δ1 leu2Δ0 lys2Δ0 ura3Δ0 was acquired from Open Biosystems and has been previously described (36). W303AR MATa ura3-1 leu2-3, 112 his3-11, 15 trp1-1 ade2-1 RDN1::ADE2 can1-100 has been described in (23) Rich media YPD and synthetic media were made as described (37). Medium used for life span analysis was YEP (2% bacto peptone, 1% yeast extract, 1.5% agar) supplemented with filter-sterilized glucose at a final concentration of 2%, 0.5% or 0.05%. All gene deletions in this study were generated in our laboratory by replacing the wild type genes with the reusable Kanr marker as described in (38) and verified by Polymerase Chain Reaction (PCR) using oligonucleotides flanking the genes of interest. The Lat1 over-expression construct pADH1-LAT1 was made as follows: a pair of oligonucleotides were designed to amplify the LAT1 coding region (from start codon to stop codon) via polymerase chain reaction (PCR). This pair of oligonucleotides also added a Not1 site to the 5′ end and a Nhe1 site to the 3′ end of the LAT1 gene. After PCR amplification, DNA was digested with Not1 and Nhe1 then ligated to ppp81 digested with the same enzymes resulting in pADH1-LAT1. The Lpd1 over-expression construct pADH1-LPD1 and the Pda1 over-expression construct pADH1-PDA1 were made the same way. Both constructs carried a functional LAT1 or LPD1 as verified by the ability to suppress the growth defects of the lat1Δ and lpd1Δ mutant respectively on non-fermentable carbon. The cdc25-10 mutants were made by two-step allele replacement as previously described (4). The Hap4 over-expressing construct pADH1-HAP4 has been previously described (5). Strains over-expressing Lat1, Lpd1 or Hap4 were made by integrating Pac1 linearized pADH1-LAT1, pADH1-LPD1 or pADH1-HAP4 into the genomic ADH1 promoter. Strains over-expressing Pda1 were made by integrating Nhe1 linearized pADH1-PDA1 into the genomic PDA1 locus. Strains carrying control vectors were made by integrating Pac1 linearized ppp81 into the genomic ADH1 promoter.
Replicative life span analysis
All life span analyses in this study were carried out on YEP plates supplemented with different concentrations of glucose with 50 cells per strain per experiment as previously described (39) with a few modifications. Fresh growing cells were patched daily onto a fresh YEP plate with 2% glucose at least 3 days prior to life span analysis. Cells from frozen stocks were grown on normal media (re-patched daily) for at least 7 days prior to life span analysis. On the day of life span analysis, cells were re-patched onto the side of the life span plates then allowed to grow. After 2 hours, ten groups of cells were moved from the initial patch and arrayed onto the center of the life span plate (one strain per plate) using a micromanipulator and allowed to grow for 1.5 hrs (1-2 divisions). Virgin cells were then selected and subjected to life span analysis. To reduce the chance of human errors and biases, life span assays were measured at least three times by two to three researchers.
NAD and NADH measurements
Intracellular levels of the NAD and NADH nucleotides were determined as described previously (40) with a few modifications. In brief, cells were grown to OD600 of ∼ 1 then 107 cells were harvested in duplicates by centrifugation in 2 × 1.5 mL tubes. Acid extraction was performed in one tube to obtain NAD and alkali extraction was performed in the other to obtain NADH. 3 μL of neutralized cell extract (∼105 cells) was used for enzymatic cycling reaction as previously described (40). The concentration of nucleotides was measured fluorometrically with excitation at 365 nm and emission monitored at 460 nm. Standard curves for determining NAD and NADH concentrations were obtained as follows: NAD and NADH were added into the acid and alkali buffer to a final concentration of 0 μM, 2.5 μM, 5 μM, 7.5 μM which were then treated with the same procedure along with other samples. The fluorometer was calibrated each time before use with 0 μM, 5 μM, 10 μM, 20 μM, 30 μM and 40 μM NADH to ensure the detection was within a linear range.
Chronological life span analysis
Three single colonies from each strain were analyzed in each experiment as previously described (41) with a few modifications. Cells were grown in synthetic media supplemented with 2% glucose and 4X auxotrophic amino acids (uracil, histidine, lysine and leucine) at a starting OD600 of 0.1. Cell viability was monitored daily by plating a fraction of the culture onto fresh media to determine the colony forming units (CFU). The rate of cell survival was calculated by normalizing the CFU to the highest cell number (the stationary phase) for each strain.
RNA extraction and Northern blot analysis
50 mL cells were grown in YPD containing 2%, 0.5% or 0.05% glucose as indicated to mid-logarithmic phase (OD600 of 0.5-0.6), concentrated by centrifugation and total RNA extraction was performed using a hot phenol method employing phase-lock tubes (Eppendorf) as previously described (42). 20 μg of total RNA was loaded in each lane. After electrophoresis, the RNA was transferred to Duralon - UV membrane (Stratagene). The membranes were then probed, washed, exposed to a phosphoimaging screen, and analyzed using STORM 860 imaging system and software provided by the manufacturer (Molecular Dynamics). DNA templates for the Northern probes were made as described previously (Powers and Walter, 1999). In short, PCR and specific gene primers were utilized to prepare the DNA templates using BY4742 genomic DNA. Northern probes were made using [α-32P] dCTP and Ready-to-Go DNA-labeling beads (Pharmacia).
rDNA recombination
rates of the rDNA recombination were determined by the rate of loss of ADE2 in the rDNA of strain W303AR at the first cell division (half-sectored colonies) as previously described (43). Cells were grown at 30° C for 2 days followed by 4 to 5 days at 4°C for color enhancement. A total of more than 70,000 colonies were examined for each strain in each experiment.
Isolation and immunofluorescence microscopy analysis of young and old mother cells
yeast cells were labeled with EZ-link Sulfo-NHS-LC-biotin (Pierce), allowed to divide ∼7 generations then isolated with streptavidin-magnetic beads as previously described (39). Young cells refer to generation 0-1 cells that have not divided or have divided once only. Old cells refer to generation 6-7 cells that have divided 6-7 times. Strains for visualization of the mitochondrial structures were constructed by transformation with the pVT100-mtGFP plasmid carrying the subunit 9 of the F0 ATPase of Neurospora crassa and a URA3 marker (44). Cells recovered from magnetic bead sorting were washed with Phosphate buffered saline (PBS, pH=7.2), stained with calcofluor/fluorescent brightener (for bud scars) or 4′,6-Diamidino-2-phenylindole, DAPI, (for DNA) for 5 minutes, washed again with PBS then examined under a Nikon Eclipse 80i fluorescence microscope with a Hamamatsu ORCA-ER camera at 1000× magnification.
Pyruvate dehydrogenase complex activity assay
Activity of the PDC was assayed in mitochondrial lysates as described (35). Briefly, cells were grown in YPD to OD600 of 1-2 then the crude mitochondrial fraction (pellet P12000) was purified as described (45). Enzyme activity was assayed immediately after preparation of mitochondrial extracts. The assay mixture contained: 100 mM potassium phosphate buffer, pH 7.4; 1 mM CaCl2; 1 mM MgCl2; 2.5 mM NAD; 2 mM thiamine pyrophosphate; 2 mM cysteine; 5 mM pyruvate. The reaction was started by the addition of coenzyme A (final concentration 0.15 mM), and the increase of NADH concentration was followed at 340 nm. PDC activity was calculated and shown as the amount of NADH produced per μg of mitochondrial proteins per hour (nmole · μg-1 · hr-1).
RESULTS
CR induces an increase in mitochondrial metabolic activity (5,20). The pyruvate dehydrogenase complex (PDC) catalyzes the oxidative decarboxylation of pyruvate to acetyl-CoA, the key substrate entering the mitochondrial tricarboxylic cycle (the TCA cycle). The PDC is composed of multiple copies of three separate enzymes: pyruvate dehydrogenase (E1, ∼20 copies), dihydrolipoamide acetyltransferase (E2, ∼60 copies) and lipoamide dehydrogenase (E3, ∼6 copies) (46). In yeast, the E1 component of the PDC is composed of two different subunits encoded by the PDA1 and PDB1 gene respectively (34). The activity of E1 is regulated by reversible phosphorylation catalyzed by the pyruvate dehydrogenase kinases (PDK) and pyruvate dehydrogenase phosphate phosphatases (PDP). Phosphorylation of E1 by PDK leads to PDC inactivation (47-50). To date, four PDK isoforms and two PDP isoforms have been identified in mammals whereas in yeast, only one PDK isoform (Pkp1) and one PDP isoform (Ppp1) have been identified. (49) The E2 component, encoded by the LAT1 gene is the core of the PDC and plays both an enzymatic and structural role (51). The E3 component, encoded by the LPD1 gene, is also a component in the 2-oxoglutarate dehydrogenase and glycine decarboxylase complexes (34). The protein X (encoded by the PDX1 gene) plays a structural role in the PDC: it binds and positions E3 to the E2 core (52). Deleting any genes in PDC resulted in defects in generating acetyl-CoA (34). To examine whether PDC is a novel metabolic target of CR, we first determined whether a functional PDC was required for CR induced life span extension. Replicative life span (RLS) of cells devoid of Lat1, the core component of the PDC, was analyzed under 0.5% glucose induced CR conditions as previously described (4-9). As shown in Fig 1A, deleting the LAT1 gene abolished CR induced life span extension suggesting a functional PDC was required for CR. We then determined whether components of the PDC were indeed limiting longevity factors. As shown in Fig. 1B, cells over-expressing the E2 component, Lat1, showed a ∼30% increase in average life span. Interestingly, over-expressing the E1 or E3 components, Pda1 and Lpd1, did not extend life span (Fig. 1B). Deleting the recently discovered yeast PDK, Pkp1 (49) also failed to extend life span (Fig. 1B). These results suggested that Lat1 was the limiting longevity factor in the PDC. We then examined whether Lat1 over-expression functioned as a CR mimic to extend life span. As shown in Fig. 1C, Lat1 over-expression did not synergize with 0.5% glucose to extend life span suggesting Lat1 functions in the same pathway as CR to extend life span.
Fig. 1.

The role of Lat1 in CR. A, 0.5% glucose induced CR requires Lat1 to extend replicative life span. Life span analysis of the wild type cells and the lat1Δ mutant cells grown in 2% and 0.5% glucose. B, Lat1 over-expression extends replicative life span. Life span analysis of the wild type cells carrying a control vector, the Lat1 over-expression plasmid, the Lpd1 over-expression plasmid, the Pda1 over-expression plasmid and the pkp1Δ mutant. C, Lat1 over-expression does not synergize with 0.5% glucose to extend replicative life span. Life span analysis of the wild type and Lat1-oe cells grown under 2% and 0.5% glucose. D, 0.05% glucose induced CR requires Lat1 to extend replicative life span. Life span analysis of the wild type cells and the lat1Δ mutant cells grown in 2% and 0.05% glucose. E, Lat1 over-expression does not synergize with 0.05% glucose to extend replicative life span. Life span analysis of the wild type and Lat1-oe cells grown under 2% and 0.05% glucose. F, Northern blot analysis of the Lat1 mRNA levels in cells grown in 2%, 0.5% and 0.05% glucose CR conditions. WT: BY4742 wild type; Lat1-oe: Lat1 over-expression. One set of representative data is shown.
The Sir2 family members play important roles in CR in several model systems (4,5,18-22). In yeast, 0.5% glucose requires the Sir2 family to mediate life span extension (4,5,9). To determine whether Lat1 over-expression functioned through the Sir2 family to extend life span, we over-expressed Lat1 in the sir2Δfob1Δhst1Δhst2Δ quadruple mutant, a genetic model for studying the requirement of Sir2 family for life span (9). Interestingly, deletions of the Sir2 family did not abolish the long life span induced by Lat1 over-expression (Fig. 2A). For comparison, mutations in the Sir2 family largely abolished 0.5% induced life span extension (Fig. 2B, left panel). As a further test, we determined whether Lat1 affected genome stability at the ribosomal DNA (rDNA) loci. It has been suggested that CR and the Sir2 family extend life span by increasing chromatin silencing at the ribosomal DNA (rDNA) loci thereby decreasing the production of toxic rDNA circles (28). Interestingly, Lat1 over-expression slightly decreased the recombination rate at the rDNA loci whereas the lat1Δ mutation slightly increased the recombination rate (Fig. 2C). These studies suggested that Lat1 functioned at least in part by increasing the stability at the rDNA loci. Lat1 may thus mediate a branch of the CR pathway that functioned in parallel to the Sir2 family.
Fig. 2.

Role of the Sir2 family in CR and Lat1 over-expression induced replicative life span extension. A, Lat1 over-expression does not require the Sir2 family to extend life span. Life span analysis of the wild type, Lat1-oe cells, the fob1Δsir2Δhst1Δhst2Δ quadruple mutant, and the fob1Δsir2Δhst1Δhst2Δ mutant with Lat1-oe on 2% glucose media. One set of representative data is shown. B, 0.5% glucose but not 0.05% glucose requires the Sir2 family to extend life span. Percent increase in life span (relative to 2% glucose) induced by 0.5% glucose (left panel) and by 0.05% glucose (right panel) is shown. Life span analysis of the wild type and the fob1Δsir2Δhst1Δhst2Δ quadruple mutant cells grown in 0.05%, 0.5% and 2% glucose. The results show the average of 3 independent experiments. Error bars denote standard deviations. C, Lat1 regulates recombination at the rDNA loci. Measurements of the rate of loss of an ADE2 marker integrated at the rDNA in wild type, Lat1 over-expressing (left panel) and the lat1Δ (right panel) mutant cells. These results show the average of three independent experiments, each conducted in quadruplicate. Error bars denote standard deviations. WT: BY4742 wild type with (2A and 2C, left panel), or without (2B and 2C, right panel) a control vector; Lat1-oe: Lat1 over-expression.
A Sir2 independent CR pathway induced by 0.05% glucose (13,15,53), a significant reduction in glucose concentration compared to 0.5% glucose induced CR (4-9) has recently been described. We therefore examined whether Lat1 also functioned in this pathway. Similar to Lat1 over-expression (Fig. 2A), 0.05% glucose induced ∼30 % life span extension in the Sir2 family mutants (Fig. 2B, right panel). It was also noteworthy that although 0.05% glucose extended life span effectively in the Sir2 family mutants, it appeared to be a less effective CR condition (∼10% extension) in wild type cells compared to 0.5% glucose (∼30% extension) (Fig. 2B, right and left panels) and Lat1 over-expression (∼30% extension) (Fig. 1B). It is possible that under 0.05% glucose, the homolog of the mammalian AMP-activated protein kinase Snf1 becomes activated, leading to reduced replicative life span (54). To examine whether Lat1 played a role in this CR pathway, we first analyzed whether Lat1 was required for 0.05% glucose induced life span extension. As shown in Fig. 1D, 0.05% glucose did not significantly extend life span in the lat1Δ mutant. We then examined whether 0.05% would further synergize with Lat1 over-expression to extend life span. Interestingly, 0.05% glucose abolished the life span extension induced by Lat1 over-expression (Fig. 1E) suggesting Lat1 over-expression and 0.05% glucose exerted opposite effects on certain common downstream targets. Alternatively, 0.05% glucose might reduce Lat11 over-expression back to the wild type level. We therefore determined the Lat1 mRNA level in cells over-expressing Lat1 grown under different CR conditions. As shown in Fig. 1F, 0.05% glucose did not reduce Lat1 expression down to wild type levels (∼5 fold increase in Lat1 expression). Interestingly, 0.05% glucose induced a ∼1.5 fold increase in the Lat1 mRNA levels whereas 0.5% glucose had no affect on the Lat1 mRNA levels. It was therefore very likely that Lat1 over-expression, 0.5% glucose and 0.05% glucose induced CR functioned through distinct yet overlapping mechanisms.
We then determined whether CR and Lat1 over-expression increased PDC activity. Interestingly, as shown in Table 1, there was no significant increase in steady state PDC activity in cells grown under CR conditions or over-expressing Lat1. It was possible that our assay was not sensitive enough to detect subtle differences. These results also suggested that CR and Lat1 over-expression extended life span by continuous replacement of damaged E2 subunits in the PDC to maintain PDC activity over time rather than increase overall steady state PDC activity. Alternatively but not mutually exclusive, components of the PDC are damaged over time, some of these damages may decrease the ability of PDC to respond to changes in NAD/NADH ratio. CR and Lat1 over-expression may alleviate these problems by changing the NAD/NADH ratio or by increasing the sensitivity of PDC to the NAD/NADH ratio. It has been suggested that CR extends life span by increasing the intracellular NAD/NADH ratio (7). To further understand how Lat1-over-expression extended life span and the interaction between Lat1 over-expression and CR, we determined whether Lat1 played a role in the intracellular NAD/NADH homeostasis. As shown in Fig. 3A, Lat1 over-expression did not affect either NAD or NADH levels. For comparison and consistent with previous studies, 0.5% glucose increased the NAD/NADH ratio by decreasing the NADH level ∼2 fold (Fig. 3B). Interestingly, 0.05%, a more stringent CR condition, did not further increase the NAD/NADH ratio (Fig. 3B). In fact, as the glucose concentration further decreased to 0.05%, the NADH level was increased to a level close to that in non-CR cells (Fig. 3B). Therefore, 0.05% glucose might have induced a distinct metabolic state compared to 0.5% glucose mediated CR. We also examined whether Lat1 was required for the 0.5% glucose CR induced increase in the NAD/NADH ratio. As shown in Fig. 3C, 0.5% was able to elicit an increase in the NAD/NADH ratio in both wild type and the lat1Δ mutant cells. These results demonstrated that Lat1 did not affect the steady state level of NAD and NADH. Therefore, it seemed unlikely that Lat1 over-expression extended life span by regulating the NAD/NADH ratio.
Table 1.
PDC enzymatic activity in various strains
| Strains | PDC activity (±SD) |
|---|---|
| WT | 193.31 (±15.55) |
| Lat1-oe | 175.61 (±17.89) |
| CR (0.5% glucose) | 174.27 (±20.9) |
| CR (0.05% glucose) | 181.59 (±18.86) |
| lat1Δ | 44.27 (±13.28) |
PDC activity was shown as the amount of NADH produced per μg of mitochondrial proteins per hour (nmole · μg-1 · hr-1). SD: standard deviations. Results showed one representative set of three independent experiments each conducted in triplicate.
Fig. 3.

Role of Lat1 and CR in the regulation of intracellular NAD/NADH levels. Measurements of the intracellular NAD and NADH levels in wild type, Lat1 over-expressing and lat1Δ mutant cells grown in 2%, 0.5%, and 0.05% glucose. A, Lat1 over-expression does not increase the NAD/NADH ratio. B, Levels of the NAD and NADH of cells grown in different glucose concentrations. 0.5% glucose induces a ∼ 2-fold increase in the NAD/NADH ratio whereas 0.05% glucose does not elicit the same effect. C, the lat1Δ mutation does not affect the NAD/NADH levels in cells under 0.5% glucose induced CR. One representative set of three independent experiments, each conducted in quadruplicate, is shown. Error bars denote standard deviations. WT: BY4742 wild type; Lat1-oe: Lat1 over-expression; SD: standard deviations
Mitochondrial respiration has been shown to be required for life span extension induced by certain CR conditions (5,53). We therefore examined whether Lat1 over-expression also required functional mitochondrial respiration using the cyt1Δ mutant. Cells carrying the cyt1Δ mutation (devoid of cytochrome c1) are defected in electron transport chain activities (55). Similar to 0.5% glucose (Fig. 4B), Lat1 over-expression required a functional respiratory chain to elicit maximum life span extension (Fig. 4A). Interestingly, the cyt1Δ mutant showed a ∼30% reduction in life span compared to wild type cells grown in 2% glucose (Fig. 4B), suggesting respiration not only was required for maximum life span extension induced by Lat1 over-expression but also important for maintaining normal life span. Interestingly, both 0.5% and Lat1 over-expression appeared to restore the short life span of the cyt1Δ mutant back to that of the wild type cells (Fig. 4A) suggesting 0.5% glucose and Lat1 over-expression were able to rescue certain growth defects associated with the cyt1Δ mutation. Consistent with previous reports (53), 0.05% glucose did not require functional mitochondrial respiration (Fig. 4B). In fact, 0.05% glucose extended life span much more efficiently in the cyt1Δ mutant (∼50% increase) than in the wild type cells (∼10% increase)(Fig. 4B) suggesting 0.05% glucose may extend life span through an alternative pathway that is normally repressed by respiration.
Fig. 4.
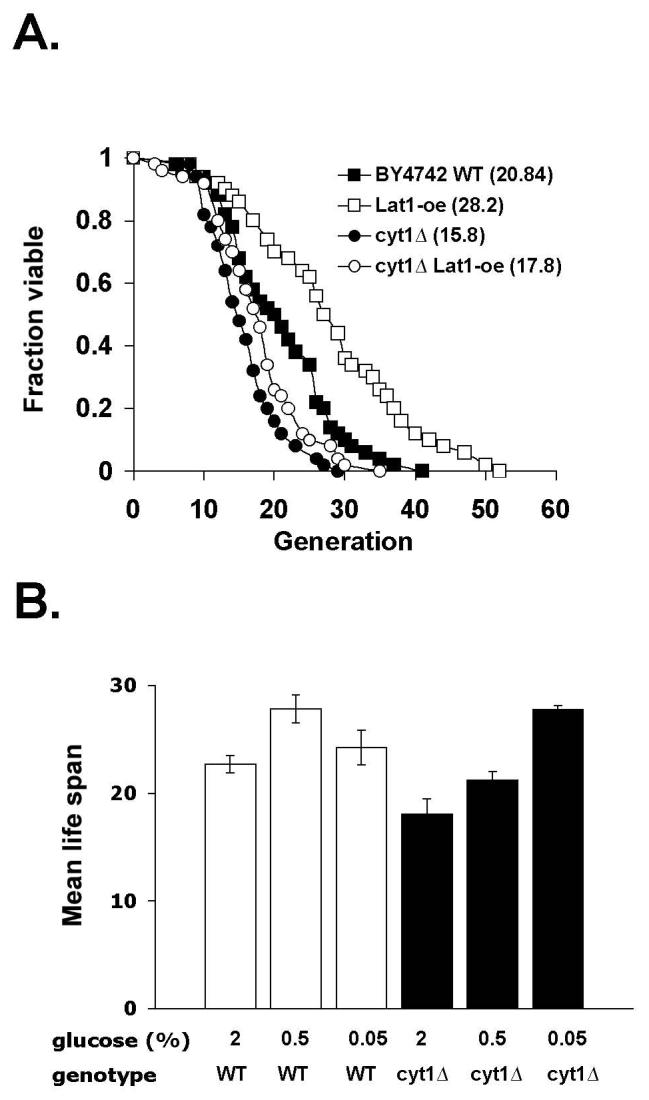
Role of mitochondrial respiration in CR and Lat1 over-expression induced replicative life span extension. A, Lat1 requires Cyt1 for life span extension. Life span analysis of the wild type cells, the cyt1Δ mutant, and the cyt1Δ mutant with Lat1-oe cells grown in 2% glucose. WT: BY4742 wild type; Lat1-oe: Lat1 over-expression. One set of representative data is shown. B, 0.5% glucose fails to elicit maximum life span extension in the respiratory deficient cyt1Δ mutant whereas 0.05% confers robust life span extension in this mutant. Life span analysis of the wild type and cyt1Δ cells grown in 2%, 0.5% and 0.05% glucose. The results show mean life span (generations) derived from three independent experiments. Error bars denote standard deviations.
We also analyzed the requirement of Cyt1 and Lat1 in several genetic models of CR to further examine the role of mitochondrial metabolism in CR. As shown in Fig. 5, we found that all CR genetic mimics tested required a functional respiratory chain for maximum life span extension. The hexokinase hxk2Δ mutant normally showed a 60%∼80% increase in life span (9,13) (Fig. 5A). The cyt1Δ mutation largely reduced the life span of the hxk2Δ to almost wild type level (Fig. 5A). We also analyzed three additional CR mimics: the cdc25-10 (RAS GTPase) mutant, Hap4 over-expression and the sch9Δ mutant. In the cdc25-10 mutant, the glucose sensing cAMP-activated PKA activity is down regulated thereby increasing life span (4). Hap4 is a component of the Hap complex that binds to the consensus sequences CCAAT and increases the transcription of many genes involved in mitochondrial metabolism (56). Over-expressing Hap4 has been shown to induce a metabolic shift towards respiration and extend life span in the PSY316 strain (5). Sch9 is a homolog of the Akt kinase family and is shown to extend life span (14,15). As shown in Fig. 5B, C and D, all these CR genetic mimics extended life span significantly and, as expected, Cyt1 was required for maximum life span extension. Similar to 0.5% glucose, most CR mimics also rescued the short life span of the cyt1Δ mutant to wild type level suggesting a respiration independent pathway, which played a minor role, was also induced by CR to extend life span. In summary, these results demonstrated that respiration played an important role in CR (0.5% glucose and most genetic mimic of CR including Lat1 over-expression) and 0.05% glucose represented a different pathway of CR. We then examined whether Lat1 was required for life span extension in these genetic models of CR. As shown in Figure 6B and 6C, the lat1Δ mutation significantly reduced the life span extension by Hap4 over-expression and the cdc25-10 mutation suggesting Lat1 played an important role in these two CR genetic models. Interestingly, Lat1 did not seem to affect the long life span of the hxk2Δ (Fig. 6A) and sch9Δ (Fig. 6D) mutants suggesting the hxk2Δ and sch9Δ mutants acted through a Lat1 independent pathway. This Lat1 independent pathway was, however, dependent on a functional respiratory chain since life span extension by the hxk2Δ and sch9Δ mutations was largely abolished in the cyt1Δ mutant.
Fig. 5.

Respiration is required for maximum replicative life span extension in genetic models of CR. A, The hxk2Δ mutation requires Cyt1 for maximum life span extension. Life span analysis of the wild typecells, the hxk2Δ and cyt1Δ mutants and the hxk2Δcyt1Δ double mutant cells on 2% glucose media. B, Over-expression of Hap4 increases life span and requires Cyt1 for maximum extension. Life span analysis of the wild type and Hap4-oe cells, the cyt1Δ mutant and the cyt1Δ mutant with Hap4-oe on 2% glucose media. C, The cdc25-10 mutation increases life span of the BY4742 strain and requires Cyt1 for maximum extension. Life span analysis of the wild type and cdc25-10 mutant cells, the cyt1Δ mutant and the cdc25-10 cyt1Δ double mutant cells on 2% glucose media. D, The sch9Δ mutation requires Cyt1 for maximum life span extension. Life span analysis of the wild type and sch9Δ mutant cells, the cyt1Δ mutant and the sch9Δcyt1Δ double mutant cells on 2% glucose media. WT: BY4742 wild type; Hap4-oe: Hap4 over-expression. One set of representative data is shown.
Fig. 6.

Role of Lat1 in genetic models of CR. A, The hxk2Δ mutation does not require Lat1 for life span extension. Replicative life span analysis of the wild type cells, the hxk2Δ and lat1Δ mutants and the hxk2Δlat1Δ double mutant cells on 2% glucose media. B, Over-expression of Hap4 requires Lat1 for maximum life span extension. Replicative life span analysis of the wild type and Hap4-oe cells, the lat1Δ mutant and the lat1Δ mutant with Hap4-oe on 2% glucose media. C, The cdc25-10 mutation requires Lat1 for life span extension. Replicative life span analysis of the wild type and cdc25-10 mutant cells, the lat1Δ mutant and the cdc25-10 lat1Δ double mutant cells on 2% glucose media. D, The sch9Δ mutation does not require Lat1 for life span extension. Replicative life span analysis of the wild type and sch9Δ mutant cells, the cyt1Δ mutant and the sch9Δcyt1Δ double mutant cells on 2% glucose media. WT: BY4742 wild type; Hap4-oe: Hap4 over-expression. One set of representative data is shown.
The lat1Δ mutation has been shown to cause slow growth on non-fermentable carbon sources (34), and is synthetic lethal with deletions in the Hsp82 gene, a member of the Hsp90 chaperones (57). The lat1Δ mutation may therefore decrease metabolic fitness of the cell, thereby preventing the benefits of CR. Consistent with this hypothesis, we found that the lat1Δ mutants gave rise to more petite daughter cells when a single cell lineage was followed. Fig. 7A (left panel) showed the frequencies of petite formation in cells derived from single colonies directly from the culture plates after two-day growth. The lat1Δ mutant exhibited a 5-fold increase in petite formation compared to wild type cells. Interestingly, this phenotype was not observed in fresh growing cells (Day 1) compared to the 2-day old cell population. These results indicated that Lat1 was essential for maintaining metabolic fitness in cells during prolonged culture. The lat1Δ mutant was therefore likely to reduce chronological life span of cells. In yeast, chronological life span (CLS) refers to the length of time cells remain viable in stationary phase or post-diauxic phase (14). The lat1Δ mutant indeed showed a significant reduction in viability in the 2-day old culture (Fig. 7A, right panel): only 35% (normal + petite) of the lat1Δ mutant cells remained viable (Fig. 7A). Although we failed to detect significant decreases in petite formation by Lat1 over-expression (data not shown), it was very likely that our assay was not sensitive enough to detect small differences. Therefore, we directly examined the CLS of cells over-expressing Lat1. As shown in Fig. 7B (left panel), Lat1 over-expression significantly extended the survival of cells grown in stationary phase, indicating Lat1 was a limiting longevity factor in both dividing and non-dividing cells. For comparison, we analyzed cells over-expressing Pda1 and Lpd1 and cells lacking Pkp1. Interestingly, Lpd1 over-expression also extended CLS (Fig. 7B, right panel), whereas over-expression of Pda1 or deletion of Pkp1 did not significantly increase CLS (data not shown). These results suggested that similar to Lat1, Lpd1 was also a limiting longevity factor in non-dividing cells. Lpd1 over-expression, however, failed to extend replicative life span (Fig. 1B). This was likely due to the pleiotrophic effects induced by Lpd1 over-expression since Lpd1 was also a component in the 2-oxoglutarate dehydrogenase and glycine decarboxylase complexes (34). CLS has been associated with an increase in stress resistance (14). However, our studies showed that neither Lat1 over-expression nor the lat1Δ mutation conferred resistance or sensitivity to paraquat, a chemical generating superoxide anions (data not shown), reinforcing the idea that Lat1 increased CLS by increasing metabolic fitness of the cells. This Lat1 mediated metabolic fitness also played a role in replicative life span regulation. As shown in Fig. 7C, yeast cells exhibited age-dependent increases in mitochondrial fission. In young cells, mitochondria appeared as dynamic tube-like structures (58) (Fig. 7C), whereas in old cells (6-7 generation old) mitochondria became highly fragmented (Fig. 7C). It has been shown that components regulating mitochondrial fusion and fission also regulate apoptosis (58). Shifting the balance towards fusion renders cells resistant to apoptotic stimuli, whereas blocking the fusion processes increases mitochondrial fragmentation and renders cells sensitive to apoptotic stimuli (58). The age-dependent mitochondrial fission phenotypes observed in old cells suggested that apoptosis may also play a role in replicative senescence. Interestingly, at least 10%-20% of the old cells over-expressing Lat1 retained the tube-like structure, suggesting Lat1 may increase life span by delaying age-dependent mitochondrial structural changes.
Fig. 7.

Lat1 affects metabolic fitness of cells. A, The lat1Δ mutants exhibit decreased mitochondrial fitness and viability after prolonged culture. For each strain, 1000 cells derived from one-day old cell patches or 2-day old single colonies were plated onto YPD plates. Colony forming units were determined after 3 days. Left panel shows the percentage of petite colonies and right panel shows the percentage of colonies grown to normal size both derived from the same experiment. One representative set of two independent experiments, each conducted in quadruplicate, is shown. Error bars denote standard deviations. B, Lat1 and Lpd1 over-expression extends chronological life span. Fractions of viable wild type, Lat1-oe and Lpd1-oe cells were determined from cultures grown to stationary phase. One representative set of three independent experiments, each conducted in triplicate, is shown. Error bars denote standard deviations. C, Lat1 over-expression delays age-dependent changes in mitochondrial structure. GFP denotes the localization of the mitochondrial inner membrane F0 ATPase. DAPI denotes nuclear and mitochondrial DNA. One set of representative data is shown. WT: BY4742 wild type with (7B), or without (7A and 7C) a control vector; Lat1-oe: Lat1 over-expression; Lpd1-oe: Lpd1 over-expression.
DISCUSSION
In this report, we characterized the core (E2) component of the PDC, Lat1, as a novel longevity regulator required for CR mediated life span extension. Over-expression of Lat1 extended life span and did not synergize with CR, whereas deletion of Lat1 abolished life span extension induced by CR and several genetic mimics of CR. Here we provide evidence that the central metabolic enzyme-Lat1/PDC functions at the interface of multiple longevity regulating pathways (Fig. 8A). PDC converts pyruvate to acetyl-CoA, which initiates the mitochondrial TCA cycle leading to the synthesis of metabolic intermediates for amino acid metabolism and energy production by respiration (34). As expected, Lat1 over-expression required mitochondrial respiration for life span extension. Most CR models examined in this study also required mitochondrial respiration for maximum life span extension indicating mitochondrial metabolism plays an important role in multiple CR pathways with one interesting exception-the 0.05% glucose induced CR (Fig. 8A). Several lines of evidence suggest that 0.05% glucose and 0.5% glucose induced CR likely function through distinct pathways. In contrast to 0.5% glucose, 0.05% glucose did not require mitochondrial respiration or the Sir2 family to extend life span. In fact, 0.05% glucose extended life span more effectively in the Sir2 family mutants and the cyt1Δ mutants than in wild type cells. These results suggest that the 0.05% glucose pathway is normally repressed by components in the 0.5% glucose pathway (Fig. 8A). It remains unclear how 0.05% glucose functions to extend life span. Although Lat1 appeared to play an important role in the 0.05% glucose CR pathway; 0.05% glucose induced Lat1 expression and the lat1Δ mutation abolished 0.05% glucose induced life span extension, certain differences exist between these two pathways. For example, Lat1 over-expression required a functional respiratory chain to elicit life span extension whereas 0.05% glucose did not.
Fig. 8.

Proposed models for the role of the PDC in multiple longevity pathways. A, Multiple CR pathways act to affect longevity in yeast. Respiration is required for 0.5% CR and CR mimic induced life span extension but inhibits the life span benefits of 0.05% CR. A functional PDC is required for some CR mimics and may be acting at the interface between 0.5% and 0.05% CR pathways. The PDC maintains metabolic fitness of the cell and functions in parallel to the Sir2 family to mediate CR effects. B, Over-expressing the E2 component of the PDC may lead to increased metabolic fitness through continuous replacement of damaged subunits over time. Different CR conditions activate the PDC by different mechanisms. For example, 0.5% glucose induced CR may increase metabolic fitness through the prevention of age-associated damages to the PDC and /or through the regulation of the NAD/NADH ratio. The 0.05% glucose induced CR may act partially through increasing the expression level of E2. Furthermore, 0.5% glucose induced CR may inhibit the pyruvate dehydrogenase kinase, PDK, by increasing the NAD/NADH ratio.
Both 0.5% glucose CR and the Sir2 family have been suggested to extend life span by increasing the genome stability at the rDNA loci (28). Lat1 appeared to affect rDNA recombination: Lat1 over-expression decreased the recombination rate whereas the lat1Δ mutation increased the recombination rate without a significant reduction in replicative life span. Perhaps, the increase in rDNA recombination caused by the lat1Δ mutation is relatively minor (less than 2 fold) compared to the sir2Δ mutation which increases rDNA recombination by at least 10 fold and shortens replicative life span (23). These results suggested that Lat1 did not extend life span solely by repressing rDNA recombination. Interestingly, over-expressing Lat1 did not require the Sir2 family to extend life span suggesting Lat1 over-expression functioned in parallel to the Sir2 family to mediate CR. Alternatively, the Sir2 family may also extend life span by regulating metabolic enzymes. In fact, the Sir2 family has recently been connected to the synthesis of acetyl-CoA production through deacetylation of acetyl-CoA Synthetase, ACS (59,60). The Sir2 homolog in S. enerica, CobB, also activates ACS by NAD-dependent deacetylation (61). ACS produces acetyl-CoA from acetate, acting as a bypass for acetyl-CoA production in the absence of a functional PDC. Although ACS is not the major pathway for generating acetyl-CoA, it is still possible that certain CR conditions may act through ACS. Moreover, in addition to being a major source of biological energy, acetyl-CoA is also used by the cell as a substrate for protein modification and regulation of gene transcription (62-64). For example, transcription factors whose activities are dramatically affected by acetylation status, such as TFIIB, have higher levels of acetylation in mice after fasting, correlating with proposed increases in acetyl-CoA levels (64). These studies suggest that certain metabolic factors such as acetyl-CoA directly connect metabolism, metabolic stress and perhaps CR, to transcriptional regulation. Together, these studies demonstrate that CR is mediated by multiple pathways, which are interconnected by different longevity factors.
Components of the PDC are susceptible to age-related oxidative damage (65,66). This selective damage to the PDC over time may cause aging and certain age associated diseases. In fact, several age-associated diseases have been linked to defects in the PDC (67,68). Since Lat1 over-expression and CR do not increase the steady state PDC activity (Table 1), it is very likely that Lat1 over-expression and CR extend life span by continuous replacement of damaged E2 subunits in the PDC (Fig. 8B). It would be interesting to examine whether Lat1 over-expression and CR maintain PDC activity in old cells. CR may also increase life span by decreasing age induced damage to the PDC since CR has been shown to decrease the level of reactive oxygen species and prevent specific age induced damages to metabolic enzymes (3,69,70). In addition, CR (0.5% glucose) may activate PDC activity by increasing the NAD/NADH ratio. The E1 and E3 components of the PDC have been shown to be subject to NAD/NADH regulation (35,47-50). In higher eukaryotes, it has been suggested that the PDC activity is mainly controlled through E1. The activity of E1 is inhibited by reversible phosphorylation catalyzed by E1 specific kinases (PDK) and phosphatases (PDP). The activity of PDK is activated by NADH and inhibited by NAD (48,50). In prokaryotes, the control of PDC activity is mainly through E3. The activity of E3 in the PDC requires NAD (as an electron acceptor) and is inhibited by NADH. In yeast, both E1 and E3 seem to be the controlling points of PDC activity (35,49,71). The E2 component does not appear to be a direct target of NAD/NADH regulation. E2 may however, affect the ability of E1 and E3 to interact with NAD and/or NADH. It has been suggested that binding of E3 to the E2 core increases the NADH sensitivity of E3 (72). Furthermore, the mammalian PDKs (E1 kinases) are known to associate with PDC through binding to the lipoyl domains of E2. Interestingly, the yeast PDK (Pkp1) lacks the tail domain found in mammalian PDKs that binds to the lipoyl domain of E2. Therefore, it remains unclear how Pkp1 interacts with PDC in yeast. Collectively, these data suggest that E2 plays a key role in regulating PDC activity and that over-expressing E2 may extend life span by increasing the sensitivity of PDC to the NAD/NADH ratio.
Other CR conditions may extend life span by increasing the expression levels of Lat1 (such as 0.05% glucose) or by PDC independent pathways (the sch9Δ and hxk2Δ mutants). It was noteworthy that the hxk2Δ and sch9Δ long lived mutants did not require Lat1 for life span extension. Although these two mutants may extend life span by a mechanism independent of Lat1/PDC, both mutants required mitochondrial respiration for life span extension suggesting mitochondrial metabolism played an important role in these mutants. It was therefore likely that the acetyl-CoA bypass pathway (mediated by the pyruvate decarboxylase and acetyl-CoA synthetase etc) (34) was induced in both mutants to generate sufficient acetyl-CoA for life span extension. This bypass may also account for the normal life span seen in the lat1Δ mutant strains. Interestingly, growing cells on media containing acetate as the sole carbon source severely reduced the life span (an average of 3 - 5 divisions, data not shown) suggesting the PDC bypass was unable to adequately produce life-sustaining levels of acetyl-CoA and that the PDC activity was essential for normal life span.
Over-expressing Lat1 may enhance metabolic fitness of the cell. Although over-expressing Lat1 did not increase resistance to oxidative stress, it did however, extend cell survival in stationary phase, a relatively stressful growth condition. In addition, we found that the lat1Δ mutant gave rise to more petite daughter cells suggesting a decrease in metabolic fitness in these cells. It was noteworthy that although the lat1Δ mutants showed reduced chronological life span, they exhibited normal replicative life span. It is possible that the lat1Δ mutation primarily reduces the fitness of the daughter cells and therefore does not affect the division potential of the mother cells in which RLS was determined. Alternatively, since the lat1Δ mutation abolished CR induced life span extension, it was very likely that the lat1Δ mutation also reduced the fitness of the mother cell. In this case, the lat1Δ mutant mother cells may maintain a normal life span and fitness at the expense of the fitness of the daughter cells. Chronological life span (CLS) has been suggested to be a model for studying senescence of post-mitotic cells whereas replicative life span (RLS) resembles the proliferative potential of mitotic cells. The complex mechanisms underlying CLS and RLS regulation and whether these two pathways share common components are currently unclear. Although certain CR conditions appeared to extend both RLS and CLS (14), it has also been shown that RLS and CLS functioned through distinct down stream targets (14). Our studies demonstrated that components of the PDC played an important role in both types of life span regulation and were therefore likely to be conserved longevity regulators that functioned at the interface of these two pathways. Interestingly, feeding lipoic acid/lipoamide (an essential cofactor for E2 activity) to old rats alleviates several age-associated phenotypes and improves metabolic function (73). The activity of E2 may also play an important role in life span regulation in mammals. Treating yeast cells with sub-toxic doses of lipoamide, however, does not extend yeast replicative life span (data not shown) further suggesting E2 is the limiting factor in yeast. These data also suggest that the limiting components in PDC for life span extension are likely to vary in different species.
PDC is also an emerging metabolic target in cancer. Inactivation of PDC has been shown to be a critical step in adaptation to hypoxia induced metabolic switches. In mammals, the activity of the E1α subunit of the PDC is regulated through phosphorylation by pyruvate dehydrogenase kinase, PDK1 (48). Upon E1 phosphorylation, the PDC becomes inactive and prevents pyruvate metabolism through the TCA cycle (48). Under hypoxic conditions, the hypoxia-inducible factor 1, HIF-1, upregulates the transcription of PDK1 (74,75). Inactivation of the PDC by PDK1 causes a shift from mitochondrial respiration to glycolysis, the main form of metabolism in 60-90% of tumor cells (76,77). Together, these studies suggest CR may prevent or delay the onset of cancer by activating the PDC.
Acknowledgments
We thank members of the Lin laboratory for discussions and suggestions; Dr. J. Nunnari for providing the pVT100-mtGFP plasmid; Dr. B. Ames for suggestions. This study was supported by the National Institute on Aging and the Ellison Medical Foundation.
Footnotes
S.-J. Lin is a new research scholar of the Ellison Medical Foundation. The authors have declared that no conflicts of interest exist.
REFERENCES
- 1.Weindruch W, Walford RL. The retardation of aging and diseases by dietary restriction. Charles C. Thomas, Springfield; Illinois, USA: 1998. [Google Scholar]
- 2.Roth GS, Ingram DK, Lane MA. Ann. N. Y. Acad. Sci. 2001;928:305–315. doi: 10.1111/j.1749-6632.2001.tb05660.x. [DOI] [PubMed] [Google Scholar]
- 3.Sohal RS, Weindruch R. Science. 1996;273:59–63. doi: 10.1126/science.273.5271.59. [DOI] [PMC free article] [PubMed] [Google Scholar]
- 4.Lin SJ, Defossez PA, Guarente L. Science. 2000;289:2126–2128. doi: 10.1126/science.289.5487.2126. [DOI] [PubMed] [Google Scholar]
- 5.Lin S-J, Kaeberlein M, Andalis AA, Sturtz LA, Defossez P-A, Culotta VC, Fink GR, Guarente L. Nature. 2002;418:344–348. doi: 10.1038/nature00829. [DOI] [PubMed] [Google Scholar]
- 6.Kaeberlein M, Andalis AA, Fink GR, Guarente L. Mol. Cell. Biol. 2002;22:8056–8066. doi: 10.1128/MCB.22.22.8056-8066.2002. [DOI] [PMC free article] [PubMed] [Google Scholar]
- 7.Lin SJ, Ford E, Haigis M, Liszt G, Guarente L. Genes and Development. 2004;18:12–16. doi: 10.1101/gad.1164804. [DOI] [PMC free article] [PubMed] [Google Scholar]
- 8.Anderson RM, Bitterman KJ, Wood JG, Medvedik O, Sinclair DA. Nature. 2003;423:181–185. doi: 10.1038/nature01578. [DOI] [PMC free article] [PubMed] [Google Scholar]
- 9.Lamming DW, Latorre-Esteves M, Medvedik O, Wong SN, Tsang FA, Wang C, Lin SJ, Sinclair DA. Science. 2005;309:1861–1864. doi: 10.1126/science.1113611. [DOI] [PubMed] [Google Scholar]
- 10.Jiang JC, Jaruga E, Repnevskaya MV, Jazwinski SM. FASEB J. 2000;14:2135–2137. doi: 10.1096/fj.00-0242fje. [DOI] [PubMed] [Google Scholar]
- 11.Jiang JC, Wawryn J, Shantha Kumara HM, Jazwinski SM. Exp. Gerontol. 2002;37:1023–1030. doi: 10.1016/s0531-5565(02)00064-5. [DOI] [PubMed] [Google Scholar]
- 12.Anderson RM, Bitterman KJ, Wood JG, Medvedik O, Cohen H, Lin SS, Manchester JK, Gordon JI, Sinclair DA. J. Biol. Chem. 2002;277:18881–18890. doi: 10.1074/jbc.M111773200. [DOI] [PubMed] [Google Scholar]
- 13.Kaeberlein M, Kirkland KT, Fields S, Kennedy BK. PLoS Biol. 2004;2:1381–1387. doi: 10.1371/journal.pbio.0020296. [DOI] [PMC free article] [PubMed] [Google Scholar]
- 14.Fabrizio P, Pozza F, Pletcher SD, Gendron CM, Longo VD. Science. 2001;292:288–290. doi: 10.1126/science.1059497. [DOI] [PubMed] [Google Scholar]
- 15.Kaeberlein M, Powers RW, 3rd, Steffen KK, Westman EA, Hu D, Dang N, Kerr EO, Kirkland KT, Fields S, Kennedy BK. Science. 2005;310:1193–1196. doi: 10.1126/science.1115535. [DOI] [PubMed] [Google Scholar]
- 16.Pedruzzi I, Dubouloz F, Cameroni E, Wanke V, Roosen J, Winderickx J, De Virgilio C. Mol. Cell. 2003;12:1607–1613. doi: 10.1016/s1097-2765(03)00485-4. [DOI] [PubMed] [Google Scholar]
- 17.Martin DE, Soulard A, Hall MN. Cell. 2004;119:969–979. doi: 10.1016/j.cell.2004.11.047. [DOI] [PubMed] [Google Scholar]
- 18.Wood JG, Rogina B, Lavu S, Howitz K, Helfand SL, Tatar M, Sinclair D. Nature. 2004;430:686–689. doi: 10.1038/nature02789. [DOI] [PubMed] [Google Scholar]
- 19.Rogina B, Helfand SL. Proc. Natl. Acad. Sci. USA. 2004;101:15998–16003. doi: 10.1073/pnas.0404184101. [DOI] [PMC free article] [PubMed] [Google Scholar]
- 20.Nisoli E, Tonello C, Cardile A, Cozzi V, Bracale R, Tedesco L, Falcone S, Valerio A, Cantoni O, Clementi E, Moncada S, Carruba MO. Science. 2005;310:314–317. doi: 10.1126/science.1117728. [DOI] [PubMed] [Google Scholar]
- 21.Chen D, Steele AD, Lindquist S, Guarente L. Science. 2005;310:1641. doi: 10.1126/science.1118357. [DOI] [PubMed] [Google Scholar]
- 22.Wang Y, Tissenbaum HA. Mech. Ageing Dev. 2006;127:48–56. doi: 10.1016/j.mad.2005.09.005. [DOI] [PubMed] [Google Scholar]
- 23.Kaeberlein M, McVey M, Guarente L. Genes Dev. 1999;13:2570–2580. doi: 10.1101/gad.13.19.2570. [DOI] [PMC free article] [PubMed] [Google Scholar]
- 24.Tissenbaum HA, Guarente L. Nature. 2001;410:227–230. doi: 10.1038/35065638. [DOI] [PubMed] [Google Scholar]
- 25.Imai S, Armstrong CM, Kaeberlein M, Guarente L. Nature. 2000;403:795–800. doi: 10.1038/35001622. [DOI] [PubMed] [Google Scholar]
- 26.Landry J, Sutton A, Tafrov ST, Heller RC, Stebbins J, Pillus L, Sternglanz R. Proc. Natl. Acad. Sci. USA. 2000;97:5807–5811. doi: 10.1073/pnas.110148297. [DOI] [PMC free article] [PubMed] [Google Scholar]
- 27.Smith JS, Brachmann CB, Celic I, Kenna MA, Muhammad S, Starai VJ, Avalos JL, Escalante-Semerena JC, Grubmeyer C, Wolberger C, Boeke JD. Proc. Natl. Acad. Sci. USA. 2000;97:6658–6663. doi: 10.1073/pnas.97.12.6658. [DOI] [PMC free article] [PubMed] [Google Scholar]
- 28.Guarente L. Genes Dev. 2000;14:1021–1026. [PubMed] [Google Scholar]
- 29.Aguilaniu H, Gustafsson L, Rigoulet M, Nystrom T. Science. 2003;299:1751–1753. doi: 10.1126/science.1080418. [DOI] [PubMed] [Google Scholar]
- 30.Bakker BM, Overkamp KM, van Maris AJ, Kotter P, Luttik MA, van Dijken JP, Pronk JT. FEMS Microbiol. Rev. 2001;25:15–37. doi: 10.1111/j.1574-6976.2001.tb00570.x. [DOI] [PubMed] [Google Scholar]
- 31.Cruz F, Villalba M, Garcia-Espinosa MA, Ballesteros P, Bogonez E, Satrustegui J, Cerdan S. J. Neurosci. Res. 2001;66:771–781. doi: 10.1002/jnr.10048. [DOI] [PubMed] [Google Scholar]
- 32.Bitterman KJ, Anderson RM, Cohen HY, Latorre-Esteves M, Sinclair DA. J. Biol. Chem. 2002;277:45099–45107. doi: 10.1074/jbc.M205670200. [DOI] [PubMed] [Google Scholar]
- 33.Gallo CM, Smith DL, Jr., Smith JS. Mol. Cell. Biol. 2004;24:1301–1312. doi: 10.1128/MCB.24.3.1301-1312.2004. [DOI] [PMC free article] [PubMed] [Google Scholar]
- 34.Pronk JT, Yde Steensma H, Van Dijken JP. Yeast. 1996;12:1607–1633. doi: 10.1002/(sici)1097-0061(199612)12:16<1607::aid-yea70>3.0.co;2-4. [DOI] [PubMed] [Google Scholar]
- 35.Kresze GB, Ronft H. Eur. J. Biochem. 1981;119:573–579. doi: 10.1111/j.1432-1033.1981.tb05646.x. [DOI] [PubMed] [Google Scholar]
- 36.Brachmann CB, Davies A, Cost GJ, Caputo E, Li J, Hieter P, Boeke JD. Yeast. 1998;14:115–132. doi: 10.1002/(SICI)1097-0061(19980130)14:2<115::AID-YEA204>3.0.CO;2-2. [DOI] [PubMed] [Google Scholar]
- 37.Sherman F, Fink GR, Lawrence CW. Methods in Yeast Genetics. Cold Spring Harbor Laboratory Press; Cold Spring Harbor, NY: 1978. [Google Scholar]
- 38.Guldener U, Heck S, Fielder T, Beinhauer J, Hegemann JH. Nucleic Acids Res. 1996;24:2519–2524. doi: 10.1093/nar/24.13.2519. [DOI] [PMC free article] [PubMed] [Google Scholar]
- 39.Park PU, McVey M, Guarente L. Methods Enzymol. 2002;351:468–477. doi: 10.1016/s0076-6879(02)51865-6. [DOI] [PubMed] [Google Scholar]
- 40.Lin SS, Manchester JK, Gordon JI. J. Biol. Chem. 2001;276:36000–36007. doi: 10.1074/jbc.M103509200. [DOI] [PubMed] [Google Scholar]
- 41.Fabrizio P, Longo VD. Aging Cell. 2003;2:73–81. doi: 10.1046/j.1474-9728.2003.00033.x. [DOI] [PubMed] [Google Scholar]
- 42.Powers T, Walter P. Mol. Biol. Cell. 1999;10:987–1000. doi: 10.1091/mbc.10.4.987. [DOI] [PMC free article] [PubMed] [Google Scholar]
- 43.Defossez PA, Prusty R, Kaeberlein M, Lin SJ, Ferrigno P, Silver PA, Keil RL, Guarente L. Mol. Cell. 1999;3:447–455. doi: 10.1016/s1097-2765(00)80472-4. [DOI] [PubMed] [Google Scholar]
- 44.Westermann B, Neupert W. Yeast. 2000;16:1421–1427. doi: 10.1002/1097-0061(200011)16:15<1421::AID-YEA624>3.0.CO;2-U. [DOI] [PubMed] [Google Scholar]
- 45.Meisinger C, Sommer T, Pfanner N. Anal. Biochem. 2000;287:339–342. doi: 10.1006/abio.2000.4868. [DOI] [PubMed] [Google Scholar]
- 46.Maeng CY, Yazdi MA, Niu XD, Lee HY, Reed LJ. Biochemistry. 1994;33:13801–13807. doi: 10.1021/bi00250a034. [DOI] [PubMed] [Google Scholar]
- 47.James AG, Cook RM, West SM, Lindsay JG. FEBS Lett. 1995;373:111–114. doi: 10.1016/0014-5793(95)01020-f. [DOI] [PubMed] [Google Scholar]
- 48.Holness MJ, Sugden MC. Biochem. Soc. Trans. 2003;31:1143–1151. doi: 10.1042/bst0311143. [DOI] [PubMed] [Google Scholar]
- 49.Krause-Buchholz U, Gey U, Wunschmann J, Becker S, Rodel G. FEBS Lett. 2006;580:2553–2560. doi: 10.1016/j.febslet.2006.04.002. [DOI] [PubMed] [Google Scholar]
- 50.Patel MS, Korotchkina LG. Biochem. Soc. Trans. 2006;34:217–222. doi: 10.1042/BST20060217. [DOI] [PubMed] [Google Scholar]
- 51.Lawson JE, Niu XD, Reed LJ. Biochemistry. 1991;30:11249–11254. doi: 10.1021/bi00111a009. [DOI] [PubMed] [Google Scholar]
- 52.Lawson JE, Behal RH, Reed LJ. Biochemistry. 1991;30:2834–2839. doi: 10.1021/bi00225a015. [DOI] [PubMed] [Google Scholar]
- 53.Kaeberlein M, Hu D, Kerr EO, Tsuchiya M, Westman EA, Dang N, Fields S, Kennedy BK. PLoS Genet. 2005;1:614–621. doi: 10.1371/journal.pgen.0010069. [DOI] [PMC free article] [PubMed] [Google Scholar]
- 54.Lin SS, Manchester JK, Gordon JI. J. Biol. Chem. 2003;278:13390–13397. doi: 10.1074/jbc.M212818200. [DOI] [PubMed] [Google Scholar]
- 55.Schneider JC, Guarente L. Mol. Cell. Biol. 1991;11:4934–4942. doi: 10.1128/mcb.11.10.4934. [DOI] [PMC free article] [PubMed] [Google Scholar]
- 56.Forsburg SL, Guarente L. Genes Dev. 1989;3:1166–1178. doi: 10.1101/gad.3.8.1166. [DOI] [PubMed] [Google Scholar]
- 57.Zhao R, Davey M, Hsu YC, Kaplanek P, Tong A, Parsons AB, Krogan N, Cagney G, Mai D, Greenblatt J, Boone C, Emili A, Houry WA. Cell. 2005;120:715–727. doi: 10.1016/j.cell.2004.12.024. [DOI] [PubMed] [Google Scholar]
- 58.Meeusen SL, Nunnari J. Curr. Opin. Cell Biol. 2005;17:389–394. doi: 10.1016/j.ceb.2005.06.014. [DOI] [PubMed] [Google Scholar]
- 59.Hallows WC, Lee S, Denu JM. Proc. Natl. Acad. Sci. USA. 2006;103:10230–10235. doi: 10.1073/pnas.0604392103. [DOI] [PMC free article] [PubMed] [Google Scholar]
- 60.Schwer B, Bunkenborg J, Verdin RO, Andersen JS, Verdin E. Proc. Natl. Acad. Sci. USA. 2006;103:10224–10229. doi: 10.1073/pnas.0603968103. [DOI] [PMC free article] [PubMed] [Google Scholar]
- 61.Starai VJ, Celic I, Cole RN, Boeke JD, EscalanteSemerena JC. Science. 2002;298:2390–2392. doi: 10.1126/science.1077650. [DOI] [PubMed] [Google Scholar]
- 62.Galasinski SK, Lively TN, Grebe De Barron A, Goodrich JA. Mol. Cell. Biol. 2000;20:1923–1930. doi: 10.1128/mcb.20.6.1923-1930.2000. [DOI] [PMC free article] [PubMed] [Google Scholar]
- 63.Choi CH, Burton ZF, Usheva A. Cell Cycle. 2004;3:114–115. doi: 10.4161/cc.3.2.651. [DOI] [PubMed] [Google Scholar]
- 64.Choi CH, Zimon A, Usheva A. Cell Mol Life Sci. 2005;62:625–628. doi: 10.1007/s00018-005-4516-6. [DOI] [PMC free article] [PubMed] [Google Scholar]
- 65.Cabiscol E, Piulats E, Echave P, Herrero E, Ros J. J. Biol. Chem. 2000;275:27393–27398. doi: 10.1074/jbc.M003140200. [DOI] [PubMed] [Google Scholar]
- 66.Long J, Wang X, Gao H, Liu Z, Liu C, Miao M, Liu J.
- 67.Bubber P, Haroutunian V, Fisch G, Blass JP, Gibson GE. Ann. Neurol. 2005;57:695–703. doi: 10.1002/ana.20474. [DOI] [PubMed] [Google Scholar]
- 68.Perluigi M, Poon HF, Maragos W, Pierce WM, Klein JB, Calabrese V, Cini C, De Marco C, Butterfield DA. Mol. Cell. Proteomics. 2005;4:1849–1861. doi: 10.1074/mcp.M500090-MCP200. [DOI] [PubMed] [Google Scholar]
- 69.Reverter-Branchat G, Cabiscol E, Tamarit J, Ros J, Piulats E, Echave P, Herrero E. J. Biol. Chem. 2004;279:31983–31989. doi: 10.1074/jbc.M404849200. [DOI] [PubMed] [Google Scholar]
- 70.Barros MH, Bandy B, Tahara EB, Kowaltowski AJ. J. Biol. Chem. 2004;279:49883–49888. doi: 10.1074/jbc.M408918200. [DOI] [PubMed] [Google Scholar]
- 71.Uhlinger DJ, Yang CY, Reed LJ. Biochemistry. 1986;25:5673–5677. doi: 10.1021/bi00367a049. [DOI] [PubMed] [Google Scholar]
- 72.Harmych S, Arnette R, Komuniecki R. Mol. Biochem. Parasitol. 2002;125:135–146. doi: 10.1016/s0166-6851(02)00221-9. [DOI] [PubMed] [Google Scholar]
- 73.Liu J, Atamna H, Kuratsune H, Ames BN. Ann. N. Y. Acad. Sci. 2002;959:133–166. doi: 10.1111/j.1749-6632.2002.tb02090.x. [DOI] [PubMed] [Google Scholar]
- 74.Kim JW, Tchernyshyov I, Semenza GL, Dang CV. Cell Metab. 2006;3:177–185. doi: 10.1016/j.cmet.2006.02.002. [DOI] [PubMed] [Google Scholar]
- 75.Papandreou I, Cairns RA, Fontana L, Lim AL, Denko NC. Cell Metab. 2006;3:187–197. doi: 10.1016/j.cmet.2006.01.012. [DOI] [PubMed] [Google Scholar]
- 76.Warburg O. Science. 1956;124:269–270. [PubMed] [Google Scholar]
- 77.Garber K. Science. 2006;312:1158–1159. doi: 10.1126/science.312.5777.1158. [DOI] [PubMed] [Google Scholar]