Abstract
A rapid and sensitive method to determine 8-oxoguanine (8oxoG) and 8-hydroxydeoxyguanosine (8OHdG), biomarkers for oxidative DNA damage, in cerebral cortex microdialysate samples using capillary electrophoresis with electrochemical detection was developed. Samples were concentrated on-column using pH-mediated stacking for anions. On-column anodic detection was performed with a carbon fiber working electrode and laser-etched decoupler. The method is linear over the expected extracellular concentration range for 8oxoG and 8-OHdG during induced ischemia-reperfusion, with RSD values ≤ 5 % and limits of detection of 0.5 nM for both analytes. Basal concentrations of 8oxoG in rat cerebral cortex microdialysate were determined to be 3.2 ± 0.6 nM. Actual 8oxoG concentration in the brain was estimated to be 5.5 ± 1.3 nM based on probe calibration by in vivo delivery. 8OHdG was not detected under basal conditions in the rat cerebral cortex extracellular fluid. These results were confirmed by LC with tandem mass spectrometry.
1 Introduction
The central nervous system (CNS) is highly vulnerable to damage from oxidative stress. Episodes of acute oxidative stress occurring after head trauma [1], spinal cord injury [2], or ischemia-reperfusion (stroke) [3] can be especially dangerous because these types of injury cause reactive oxygen species (ROS) concentrations to increase at a rate that overwhelms the body’s defense mechanisms and can be severely damaging to affected tissue.
8-Hydroxylated guanine species such as 8-oxoguanine (8oxoG) and 8-hydroxy-2’-deoxyguanosine (8OHdG) are repair products of oxidized guanine lesions (8OHGLs) and have been identified as biomarkers for oxidative stress [4]. 8OHdG formation by ROS was first reported by Kasai and Nishmura in 1984 [5]. It was later determined that the presence of 8OHGLs in DNA caused G→T transversions [6], which led to numerous studies on the relationship between various chemical agents and oxidative DNA damage using 8oxoG and 8OHdG as biomarkers. 8oxoG and 8OHdG are formed through similar repair pathways that release the nucleobase or nucleoside depending on the enzyme involved [7]. Reports of analytical methodologies for 8OHdG determination are more common than for 8oxoG, with many reports of 8oxoG being determined as 8OHdG. Elevated levels of 8OHdG have been correlated with exposure to ionizing radiation [8], industrial chemicals [9], air pollution [10], cigarette smoking [11], cancer [12,13], chemotherapy [14], and ischemia-reperfusion [15–17]. Although only a few are mentioned here, there are several hundred reports linking increased concentrations of 8OHdG to increased oxidative stress or disease states, with over twenty reports using 8OHdG as a biomarker for ischemia-reperfusion. 8OHdG has been quantified in various biological samples, including tissue, saliva, blood, and urine [18]. Analysis of DNA extracted from tissue is perhaps the most prevalent sampling strategy [19–23]. 8OHdG is also found in extracellular fluid (ECF), and has been recently sampled by microdialysis [18] to assess local damage by ROS in disease states [24] or during ischemia-reperfusion [25,26].
Floyd et al. were the first to report the sensitive analysis of 8OHdG by liquid chromatography with electrochemical detection (LCEC) [27], shortly after Kasai and Nishmura reported the isolation of 8OHdG. LCEC with carbon electrodes continues to be the most popular analytical method for 8oxoG and 8OHdG determination, with over 100 reports of its use to date. Amperometric detection is a selective technique for 8oxoG and 8OHdG since they can be oxidized at relatively modest potentials (normally between + 500 to 700 mV vs. Ag/AgCl depending on chromatographic conditions).
Several issues are involved when using 8oxoG and 8OHdG as biomarkers of oxidative DNA damage. First, an increase in the concentration of 8oxoG and 8OHdG may occur as a function of homogenization [28,29], phenol extraction [30], and derivitization for GCMS [31], suggesting that sample preparation is clearly an analytical concern. In light of these issues, the European Standards Committee on Oxidative DNA Damage was formed in an attempt to resolve the problems associated with the measurement of background levels of these biomarkers in human cells, and published a series of papers [32–35]. Secondly, samples such as blood and urine reflect whole body oxidative stress rather than that at specific tissues sites, and offer poor time resolution.
In order to obtain site-specific, highly time-resolved information about 8oxoG and 8OHdG concentration in vivo without harsh sample pretreatment that could lead to artifactual oxidation, microdialysis was chosen as the sampling technique. Microdialysis sampling can be used to continuously monitor the concentration of compounds from specific tissue sites. Using microdialysis to sample the ECF of the cerebral cortex during ischemia-reperfusion provides selectivity for small molecules such as 8oxoG and 8OHdG and involves minimal perturbation of the biological system under investigation. Each animal can serve as its own control and therefore 8oxoG and 8OHdG concentrations can be measured before and after induced ischemia-reperfusion in the same animal for comparison. Two groups have previously focused on microdialysis sampling of 8OHdG. Yang et al. reported an 8OHdG concentration of ~ 10 nM in rat heart microdialysate [25,26]. This value was for the concentration of 8OHdG in the dialysis sample, not taking into account the percent recovery of the probe. The linear probe used was 4 mm in length, and the perfusion rate was 2 µL/min. No microdialysis recovery values were given. Bogdanov et al. reported 8OHdG concentrations of ~ 1 –10 pM in rat brain and muscle microdialysates [18,24]. This corresponds to ~ 10 –150 pM in tissue (recovery reported at 6 – 8 % in vitro) using microdialysis with a 2 mm concentric probe perfused at 5 µL/min.
Since the treatment of reperfusion injury, such as antioxidant therapy, is extremely time-dependent [36], a highly-resolved time profile should be a priority when designing a method to quantitate the damage caused by ROS during ischemia-reperfusion. 8OHdG accumulation following ischemia- reperfusion was previously reported in the rat brain [17,37–39], gerbil hippocampus [15,40], and rat heart [25,26]. 8oxoG was also measured in the rat kidney during ischemia-reperfusion [41]. The earliest samples were collected 10 minutes after the start of reperfusion, and increases in 8OHdG concentration were observed. But improved temporal resolution is needed in order to determine how early changes in 8oxoG and/or 8OHdG concentration occur and where the therapeutic window may exist.
Because of the small sample volume requirement, capillary electrophoresis (CE) is an excellent separation technique to couple to microdialysis sampling. A few microliters of sample is all that is needed for analysis by CE, resulting in increased temporal resolution compared to existing techniques. Based on the previous reports of 8OHdG in microdialysates, UV detection would not provide the necessary detection limits. Our group has previously reported the determination of 8OHdG in urine samples by CEEC [42]. CEEC provides the necessary detection sensitivity and selectivity, but special instrument design considerations must be made to isolate the amperometric detection circuit from the high electric field strength that drives the electrophoretic separation. An issue also arises in CE when separating analytes in high-ionic strength matrices such as microdialysate. Sample destacking can occur in the analysis of such samples, resulting in poor separation efficiency and reduced sensitivity. In order to achieve preconcentration of anions (such as 8oxoG and 8OHdG at physiological pH) in high ionic strength matrices without the need for a dilution or extraction step, we have developed a technique termed base stacking. This techique has been described in detail previously [43,44]. With this technique, high-ionic strength samples are titrated to low-ionic strength on-column, resulting in field amplified sample stacking. Base stacking allows a greater amount of sample to be introduced into the capillary and greatly increases sensitivity.
In this research, a CEEC method was developed to determine 8oxoG and 8OHdG concentrations in rat brain microdialysate with improved temporal resolution. This method will make it possible to monitor 8oxoG and/or 8OHdG formation during ischemia-reperfusion in the brain with no sample pretreatment. 8oxoG and/or 8OHdG concentration can be used as an indicator for the extent of oxidative stress over the time course of a stroke, and information gained with this method can be used to develop treatment regimens to reduce brain damage in stroke victims.
2 Experimental
2.1 Chemicals
8-Hydroxy-2’-deoxyguanosine (8OHdG), ammonium chloride, imidazole hydrochloride, tris(hydroxymethyl)aminomethane hydrochloride (Tris), methylamine hydrochloride, sodium tetraborate, tetradecyltrimethylammonium bromide (TTAB), and thioguanosine were purchased from Sigma (St. Louis, MO). 8-Oxoguanine (8oxoG) was purchased from Cayman Chemical (Ann Arbor, MI). Cellulose acetate was obtained from Aldrich (Milwaukee, WI) and prepared as 6 wt % in acetone. All other chemicals were reagent grade or better and used as received. All solutions were prepared in Nanopure water (Labconco, Kansas City, KS) and were filtered through a 0.22-µm pore size membrane filter prior to use. Background electrolyte (BGE) pH was adjusted with 5 M sodium hydroxide solution.
2.2 Capillary Electrophoresis
Fused-silica capillary (50 µm i.d.) was obtained from Polymicro Technologies (Phoenix, AZ). A high voltage power supply (Spellman High Voltage Electronics Corp., Hauppauge, NY) was used to drive electrophoresis at −12 kV (negative polarity mode). The cathodic capillary reservoir (inlet) and electrical connections were isolated in a Plexiglass safety box fitted with an interlock. The electrochemical cell served as the anodic capillary reservoir. Capillaries were flushed with 0.1 M NaOH, water, and BGE at l0 psi before each use. To reverse the EOF, 0.5 mM TTAB was added to the BGE. Under these conditions, the electromigration of anions and the EOF are toward the detector. It should be noted that since sample is introduced at the cathode when using reversed polarity, no oxidation of sample or production of oxidants should occur that could cause artifactual oxidation of guanine moieties [45]. The capillary was flushed with BGE after each separation. A Spectra System UV1000 UV-vis detector at 254 nm with a flow cell modified for CE was used for optimization of stacking conditions unless otherwise noted. All experiments were performed at ambient temperature.
2.3 Electrochemical Detection for Capillary Electrophoresis
The electrochemical detector was a BAS LC-4CE amperometric detector (Bioanalytical Systems, Inc. (BAS), West Lafayette, IN) with a four-pole Bessel filter set at 0.2 Hz. A laser-etched decoupler [46] and carbon fiber working electrodes [47] were constructed as described previously. Carbon fiber electrodes were cut to 1 mm in length and screened before use. Only those electrodes with noise levels below 0.2 pA in a quiescent buffer solution were selected. The carbon fiber working electrode was aligned with the decoupler/separation capillary outlet and sealed with a septum in the electrochemical cell (Figure 1). Under a microscope, the carbon fiber working electrode was inserted into the capillary outlet at a depth of 800 µm using a micropositioner. A platinum wire was used as the auxiliary electrode and a BAS RE-6 Ag/AgCl electrode was used as reference. (All potentials are reported versus Ag/AgCl.) The electrochemical cell was housed in a Faraday cage. Data was collected with a PCI-MIO-16XE-50 A/D computer card and data aquisition was programmed in-house using LabView 5.1 software (National Instruments, Austin, TX).
Figure 1.
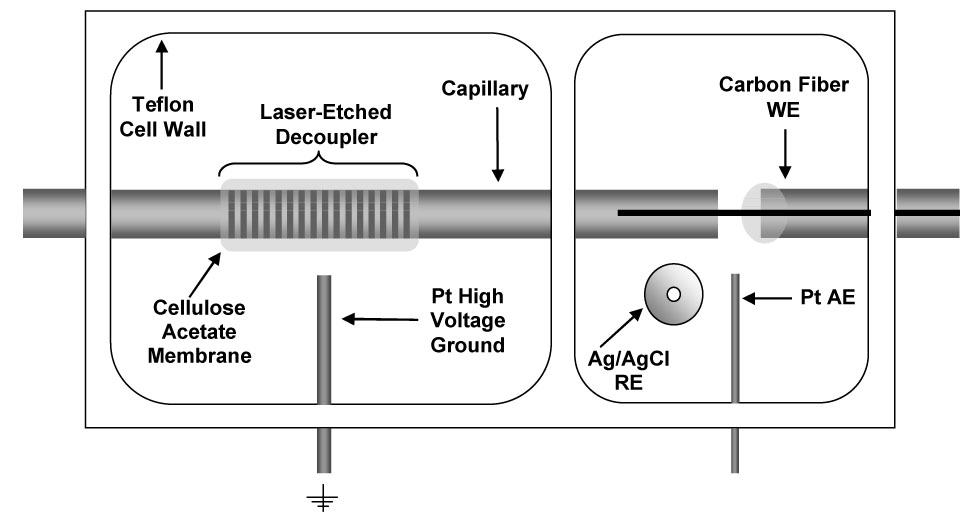
Schematic of electrochemical cell with decoupler for capillary electrophoresis with electrochemical detection (Top view).
2.4 Microdialysis Sampling
Female Sprague-Dawley rats were initially anesthetized by inhalation of isofluorane followed by an i. m. injection of a ketamine (100 mg/kg) / xylazine (10 mg/kg) mixture. Booster doses of one-fourth the initial dose of ketamine were administered as needed to maintain proper anesthesia. The top of the rat skull was shaved and disinfected with isopropanol (70 %) and betadine. The animal was then securely positioned in a stereotaxic surgical frame (BAS) with the incisor bar set at 3.3 mm from the interaural line. A 1 inch midline incision was made through the skin at the top of the skull parallel to the saggital suture. Adventitious tissue covering the skull was removed with a cotton swab. A 1 mm diameter hole was then drilled through the skull at the insertion site and an intracerebral guide cannula was lowered into the cerebral cortex and affixed to the skull with dental cement. The dummy probe was then replaced with a BR-4 brain microdialysis probe (BAS). The probe was then perfused with Ringer's solution (145 mM sodium chloride, 2.8 mM potassium chloride, 1.2 mM calcium chloride, and 1.2 mM magnesium chloride dissolved in nanopure water) at a flow rate maintained by a CMA/100 microsyringe pump (BAS). Microdialysis sample fractions were collected in plastic vials and analyzed immediately after collection with no sample pretreatment or dilution. Animals were sacrificed after the experiment while still under anesthesia.
2.5 Microdialysis Probe Calibration
Liquid chromatography with electrochemical detection (LCEC) was used for probe calibration since sample volume was unlimited and detection limits were not an issue at the standard concentrations selected. The LCEC system consisted of an ISCO Model 2350 pump, BAS LC-4B amperometric detector, and Phenomenex (Torrence, CA) Synergi Hydro-RP column (4 µM, 150 × 2.1 mm). The separation was performed with a 95/5 (v/v) formate (0.1 % (v/v), pH 2.5) / MeOH mobile phase at a flow rate of 0.3 mL/min. The thin-layer electrochemical cell used a 3 mm diameter glassy carbon working electrode at + 650 mV and BAS RE-6 Ag/AgCl reference electrode. Data was collected via a PE Nelson 900 Series Interface and Turbochrom software (Perkin Elmer, San Jose, CA).
The in vitro recovery of 8oxoG and 8oxoG was determined by perfusing Ringer's solution through a probe immersed in stirred standards of 100 nM 8oxoG and 8OHdG (in Ringer's) at 37 °C. Microdialysate samples were collected and analyzed at 20 minute intervals until there was no change in recovery for 3 consecutive sampling intervals. Once equilibrium was reached, 5 µL aliquots of microdialysate were collected and analyzed by LCEC. Percent recovery (R) was determined using the equation
where Pd is the analyte peak area in the microdialysate and Ps is the analyte peak area in the standard solution. In vivo delivery was determined by perfusing 100 nM 8oxoG and 8OHdG (in Ringer's) through a probe implanted in the rat cerebral cortex, as previously described. Microdialysate samples were collected and analyzed as described for in vitro recovery. In vivo percent delivery (D) was calculated using the following equation where Pp is the analyte peak area in the perfusate.
2.6 Standard Preparation and Injection Protocol for Capillary Electrophoresis
Stock solutions of 1 mM solution of 8oxoG were prepared by adding NaOH dropwise until 8oxoG completely dissolved with sonication. An initial 10-fold dilution of the 8oxoG stock was made with 0.01 M perchloric acid as 8oxoG was found to degrade more rapidly in basic solutions. Standard solutions of 8oxoG were diluted from stock in Ringer's solution. 8oxoG had limited stability in solution at room temperature. When refrigerated, a decrease in concentration could be observed after two weeks, which is similar to reports by other groups [48,49]. A new 8oxoG stock solution was therefore prepared weekly and stored at 4 °C.
Stock solutions of 8OHdG were prepared in water and standard solutions were diluted from stock in Ringer's solution. 8OHdG did not require special preparation conditions. Stock solutions were stored at 4 °C, and diluted standards were prepared daily. 8OHdG standards in water were found to be stable for several months. 8oxoG and 8OHdG standards prepared in Ringer's solution and microdialysis samples were injected electrokinetically at −12 kV, immediately followed by a 0.1 M NaOH injection at the same voltage. The minimum duration of NaOH injection required for stacking of analyte standards and samples was determined experimentally, as well as the maximum sample injection time allowed before degradation of the separation.
2.7 Liquid Chromatography-Tandem Mass Spectrometry of 8OHdG in Rat Brain Microdialysis Samples
Liquid chromatography with tandem mass spectrometry (LCMSMS) was also used to measure 8oxoG and 8OHdG levels in rat brain microdialysates. The LCMSMS system consisted of a Waters HPLC system with an Alliance 2690 pump (Waters Corporation, Milford MA) coupled to a Micromass (Micromass, Manchester, UK) Quattro Ulitima with Z-Spray interface. The separation was performed with a 95/5 (v/v) formate (0.1 % (v/v), pH 2.5) / MeOH mobile phase at a flow rate of 0.3 mL/min through a Phenomenex (Torrence, CA) Synergi Hydro-RP column (4 µM, 150 × 2.1 mm). The electrospray needle voltage was 3.0 kV with a cone voltage of 30 V, and the collision energy used was 15 eV. Data was collected with MassLynx software (Micromass).
Direct infusions of standards in 1:1 (v/v) methanol:water were first conducted to collect daughter ion spectra for 8oxoG and 8OHdG. Mass transitions for multiple reaction monitoring (MRM) of 8oxoG and 8OHdG were selected on the basis of signal intensity. Standard and sample injection volume was 10 µL. The lowest sample volume possible to make triplicate 10 µL injections with the vials chosen for the Waters autosampler was 40 µL. This volume was used in all subsequent LCMSMS analyses of microdialysate samples.
Microdialysis samples were collected at 0.25 µL/min for analysis by LC. The cerebral cortex microdialysate of 3 rats was collected over a period of 9 hours to collect a total of 400 µL. The samples were pooled, centrifuged with low heat until dry, and reconstituted in 40 µL of water. Preconcentrated dialysate samples were analyzed on the day of collection.
3 Results and discussion
3.1 CEEC Method Optimization
Figure 2 illustrates the effect of base stacking on detection sensitivity in high-ionic strength samples. Minimum NaOH injection length required to stack the sample was determined from 8OHdG stacking experiments. Nanomolar detection limits of 8OHdG in Ringer’s solution were not possible without base stacking. Several types of BGEs were investigated for base stacking of 8OHdG in Ringer’s solution. Table 1 lists several parameters of the base stacking performance of each BGE using UV detection. Imidazole provided a peak efficiency for 8OHdG of over 4 million theoretical plates, but at this pH the response for 8OHdG was non-linear at low concentrations due to an interfering background peak. Above pH 7.2, this large increase in efficiency is no longer observed, but 8OHdG can be resolved from the interference. Base stacking in methylamine and ammonium hydroxide required 2–3 times the amount of NaOH to stack a 30 s injection of 8OHdG compared to Tris and imidazole, and would therefore limit the amount of sample that could be injected while still leaving enough capillary length for the separation. Therefore, the most useful BGE for base stacking of 8OHdG was determined to be either Tris or imidazole above pH 7.2.
Figure 2.
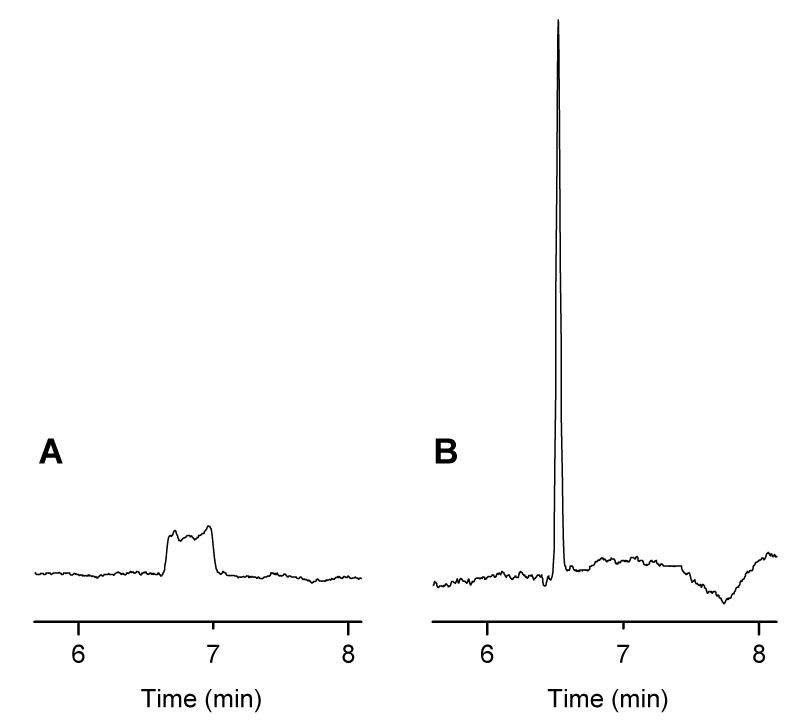
Effect of Base Stacking on 8OHdG Detection Sensitivity. (A) 20 s injection of 8OHdG standard in Ringer's solution, (B) 20 s injection of 8OHdG standard in Ringer's solution followed by a 45 s injection of 0.1 M NaOH. Conditions: 100 mM ammonium hydroxide BGE with 0.5 mM TTAB at pH 9.5, 50 µm i.d. capillary × 80 cm, separation and injection at −15 kV, detection at + 600 mV vs. Ag/AgCl.
Table 1.
Optimization of Base-Stacking Parameters for 8OHdG in Ringer's Solution
| Sample in Ringer’s Solution, with Base-Stacking | Sample in BGE, without Base-Stacking | |||||
|---|---|---|---|---|---|---|
| BGE | pH | Min. NaOH (s) | Peak Height (mAU) | Efficiency (N/1000) | Peak Height (mAU) | Efficiency (N/1000) |
| Methylamine | 10.5 | 15 | 2.28 ± 0.11 | 231 ± 5 | 0.477 ± 0.006 | 45 ± 5 |
| NH4OH | 9.2 | 15 | 1.69 ± 0.05 | 173 ± 6 | 0.530 ± 0.014 | 70 ± 5 |
| Tris | 8.0 | 5 | 2.05 ± 0.02 | 166 ± 16 | 0.435 ± 0.025 | 23 ± 7 |
| Imidazole | 7.0 | 8 | 9.39 ± 0.27 | 4,498 ± 15 | 0.542 ± 0.011 | 66 ± 6 |
Conditions: 30 s injection of 50 µM 8-OHdG standard in 90 % Ringer's for base-stacking or 10 s injection in BGE for normal electrokinetic injection, 100 mM BGE (pH ≈ pKa) with 0.5 mM TTAB, n=3, UV detection
Although BGE concentrations of 100 mM or greater are ideal for pH-mediated stacking, they also result in increased electrophoretic current. Figure 3 shows the effect of electrophoretic current on noise at the working electrode with the laser-etched decoupler. Noise does not begin to significantly increase until after 30 µA of electrophoretic current. To achieve lower limits of detection, a BGE concentration was selected that would limit the electrophoretic current to less than 25 µA at a separation voltage that would create a suitable field strength for electrophoretic separation. Both methylamine and ammonium hydroxide had higher electrophoretic currents than Tris and imidazole at the same concentrations. At a separation voltage of −12 kV, a BGE concentration of 50 mM Tris or imidazole proved to be adequate for base stacking while still limiting the electrophoretic current to less than 25 µA.
Figure 3.
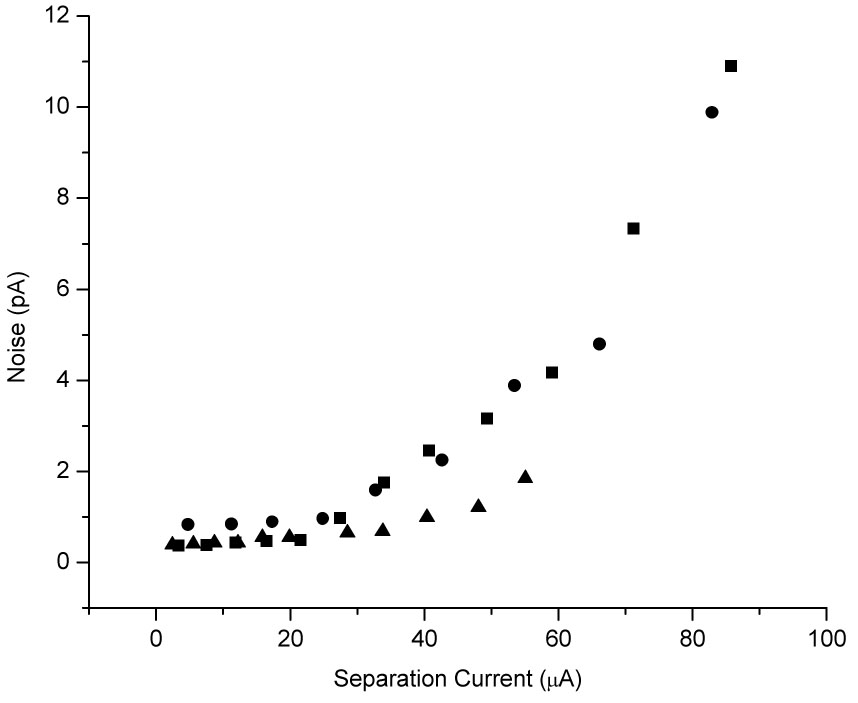
Noise vs. Electrophoretic Current for On-Column Detection with a Laser-Etched Decoupler. Conditions: 25 mM (▲), 50 mM (■), and 100 mM (●) imidazole BGE with 0.5 mM TTAB at pH 7.0, 50 µm i.d. capillary × 80 cm, 35-hole laser-etched decoupler, detection at + 600 mV vs. Ag/AgCl.
A mixture of 8oxoG and 8OHdG standards was then injected under the optimized BGE conditions. 8oxoG and 8OHdG were resolved from other matrix components, but comigrated under these conditions. Resolution did not improve with a change in ionic strength, change in pH, or an imidazole BGE. Addition of borate to the Tris BGE, however, did achieve separation of the analytes. Borate has been shown to complex with carbohydrates under moderately alkaline conditions and aid in the CE separation of molecules with otherwise identical mobilities [50]. Since increasing the ionic strength of the BGE is not favorable due to increased noise at the working electrode, the minimum borate concentration needed to achieve resolution of 8oxoG and 8OHdG was determined and results are summarized in Table 2. All subsequent separations were conducted with 50 mM Tris, 40 mM borate, 0.5 mM TTAB at pH 8.0, and a representative electropherogram is shown in Figure 4. This data also demonstrates that pH-mediated stacking is still successful when high concentrations of non-titrable electrolytes are added to the BGE.
Table 2.
Optimization of the Resolution of 8oxoG and 8OHdG
| [Tris]/[Borate](mM) | CE Current(µA) | 8-oxoG Efficiency (N/1000) | 8-OHdG Efficiency (N/1000) | Resolution |
|---|---|---|---|---|
| 50 / 50 | 30 | 96 ± 1 | 83 ± 12 | 2.34 ± 0.07 |
| 50 / 40 | 29 | 100 ± 11 | 72 ± 12 | 2.34 ± 0.06 |
| 50 / 30 | 27 | 83 ± 1 | 32 ± 4 | 1.43 ± 0.18 |
| 50 / 20 | 25 | 85 ± 3 | 18 ± 1 | 0.49 ± 0.03 |
| 50 / 10 | 23 | n/a | n/a | n/a |
| 67 / 0 * | 30 | n/a | n/a | n/a |
Conditions: 1 µM 8oxoG + 2 µM 8OHdG standards in Ringer’s injected for 60 s followed by 15 s injection of 0.1 M NaOH; Tris, borate BGE with 0.5 mM TTAB at pH 8.7, 50 µm i.d. capillary × 60 cm, separation and injection at −10 kV; detection at +650 mV vs. Ag/AgCl.
Concentration of Tris BGE alone that gave same separation current as 50 mM Tris, 50 mM borate BGE (used as ionic strength control experiment).
Figure 4.
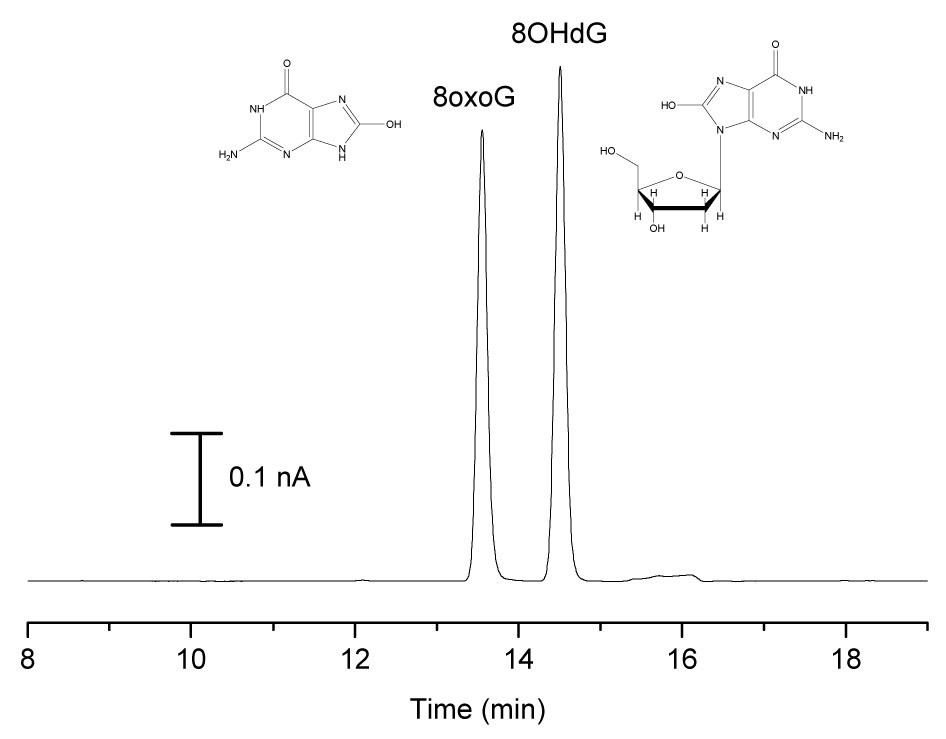
Electropherogram of 8oxoG and 8OHdG Standards. Conditions: 100 µM 8oxoG and 8OHdG standards in Ringer’s injected for 60 s followed by 15 s injection of 0.1 M NaOH; 50 mM Tris, 40 mM borate BGE with 0.5 mM TTAB at pH 8.7, 50 µm i.d. capillary × 60 cm, separation and injection at −10 kV.
Using the optimized BGE conditions and injection ratios determined from UV experiments, the maximum sample injection time was determined with microdialysate samples (1 µL/min perfusion rate). By comparing spiked and unspiked electropherograms, 8oxoG and 8OHdG were identified in the microdialysate. Sample injection times of 60 s could be performed before peak shape and resolution degraded. A sample volume of 1 µL can easily be handled with injection directly from the sample vial.
Figure 5 shows hydrodynamic voltammograms (HDVs) of 8oxoG and 8OHdG standards in Ringer’s obtained using CEEC in Tris/borate BGE. Standards were injected for 60 s followed by a 15 s NaOH injection. The response increases rapidly beginning at + 300 mV and reaches a plateau near + 600 mV. 8oxoG and 8OHdG are reported to have similar electrochemical behavior [51–53]. Based on the HDV, a potential of + 650 mV was chosen for detection, and + 450 mV was chosen for peak current ratio identification of analytes.
Figure 5.
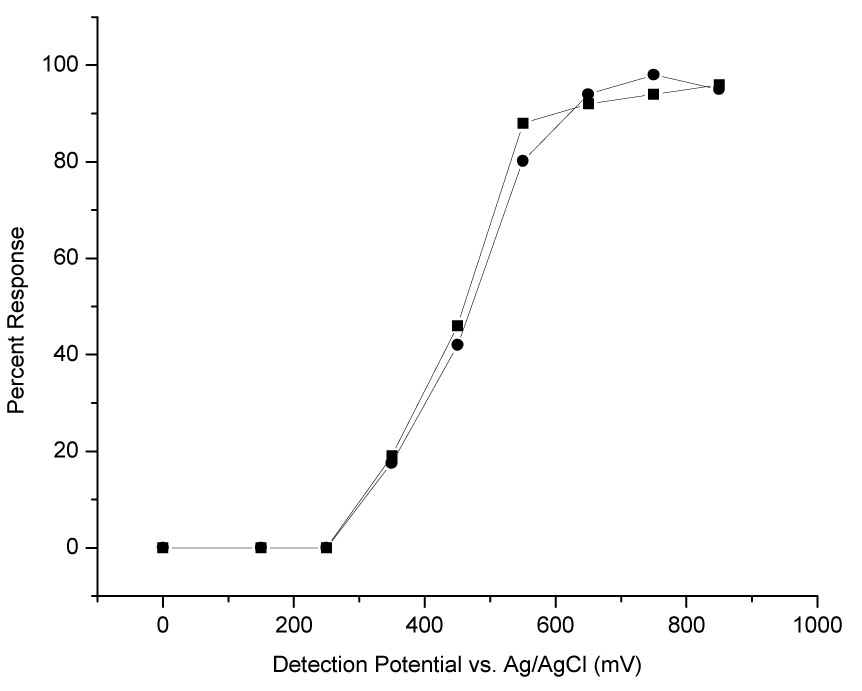
Hydrodynamic Voltammograms of 8oxoG and 8OHdG. Conditions: 20 nM 8oxoG (■) and 8OHdG (●) standards in Ringer’s, all other conditions same as in Figure 4. Response measured in peak area.
3.2 CEEC Method Validation
The limit of detection for 8oxoG and 8OHdG in Ringer's solution, using base stacking with a sample injection time of 60 s, was 0.5 nM (S/N = 3) or approximately 10 fg injected. This value is nearly 2 orders of magnitude less than we have previously reported for CEEC of 8OHdG without base stacking [42]. The response for 8oxoG and 8OHdG was nearly identically linear (R2 = 0.999) over the concentration range expected during ischemia-reperfusion experiments (0.5 – 80 nM). The RSD was ≤ 5 % for triplicate standard injections.
The optimal microdialysis perfusion rate was next determined. Figure 6 illustrates the effect of perfusion rate on the percent recovery for 8oxoG and 8OHdG. The in vitro recovery of 8oxoG and 8OHdG at a 1 µL/min perfusion rate was determined to be 28.0 ± 0.6 % and 21.9 ± 1.0 %, respectively, while recovery at a 0.25 µL/min perfusion rate was determined to be 67.9 ± 6.5 % and 57.9 ± 5.7 %, respectively. At a perfusion rate of 1 µL/min, a sampling interval of one minute would provide more than enough sample volume for analysis by CE. Comparison of spiked and unspiked brain dialysate electropherograms, however, showed that the basal brain dialysate did not contain a detectable concentration of 8oxoG or 8OHdG at the 1 µL/min perfusion rate. When spiked and unspiked electropherograms were compared at the 0.25 µL/min perfusion rate, a peak at the appropriate migration time for both 8oxoG and 8OHdG was observed.
Figure 6.
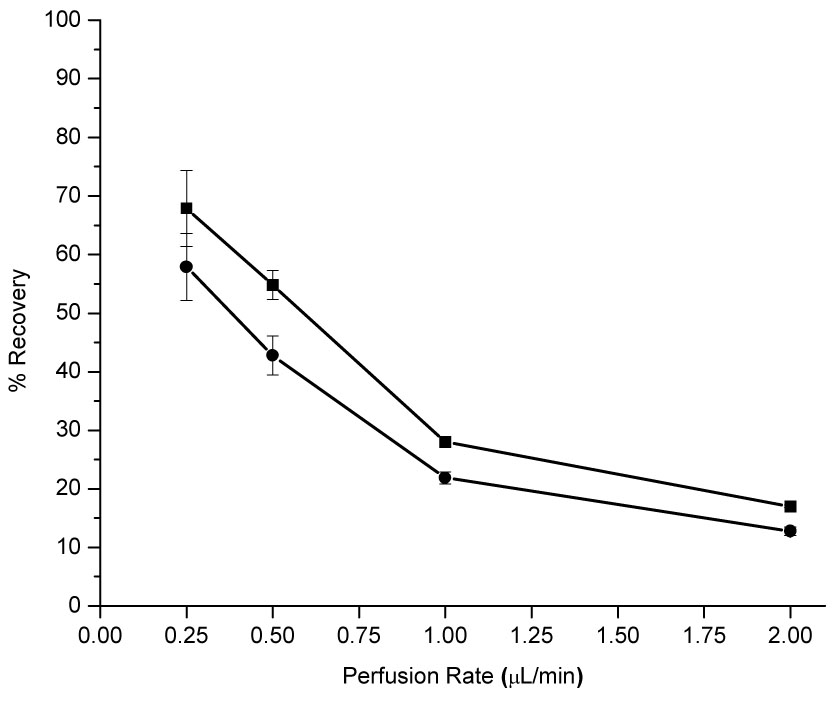
8oxoG and 8OHdG Recoveries as a Function of Perfusion Rate. Conditions: BAS BR-4 brain microdialysis probe, 4 mm window, perfused with Ringer’s solution; 100 nM 8oxoG (■) and 8OHdG (●) standards in Ringer’s at 37°C with stirring.
3.3 Microdialysis Sample Analysis by CEEC
Electropherograms of rat brain microdialysate collected at 0.25 µL/min are shown in Figure 7. At + 650 mV, there appears to be peaks for both 8oxoG and 8OHdG in basal dialysate as compared to dialysate spiked with 20 nM of each analyte. However, at + 450 mV, there does not appear to be a peak for 8OHdG in basal dialysate as compared to the spiked sample. 8oxoG does appear in the basal dialysate at + 450 mV. Table 3 presents the peak heights 8oxoG and 8OHdG in basal dialysate versus a 20nM standard in Ringer’s solution as well as the calculated peak height ratios. The current ratio for the peak in the dialysate with the same migration time as 8oxoG is not statistically different than the ratio for the 8oxoG standard, and therefore was determined to be 8oxoG. The peak in the dialysate with the same migration time as 8OHdG did not have the same current ratio, and therefore is not 8OHdG.
Figure 7.
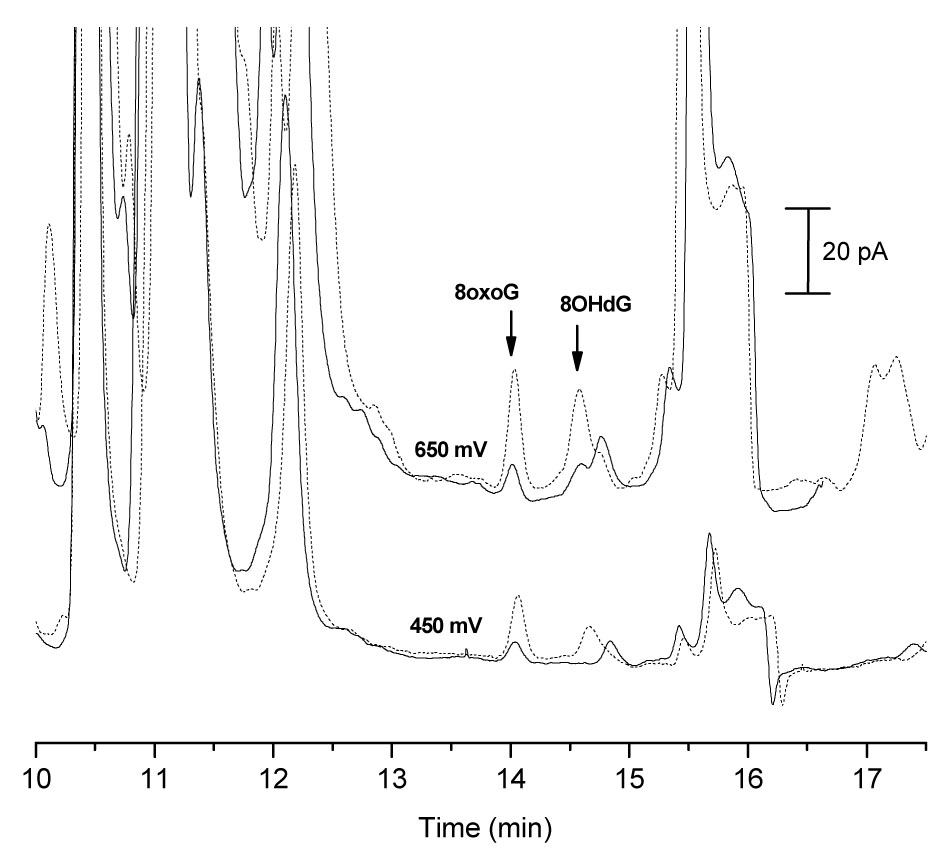
Identification of 8oxoG and 8OHdG in Rat Brain Microdialysate by CEEC. Microdialysate injected for 60 s followed by 15 s injection of 0.1 M NaOH; basal traces (solid line), spiked with 20 nM 8oxoG + 20 nM 8OHdG (dashed line). Conditions: 50 mM Tris, 40 mM borate BGE with 0.5 mM TTAB at pH 8.7, 50 µm i.d. capillary × 80 cm, separation and injection at −10 kV; detection potential vs. Ag/AgCl.
Table 3.
Current Ratios for “8oxoG” and “8OHdG” Peaks by CEEC
| Peak ID and Sample | Detection Potential (mV) | Peak Height (pA) | Current Ratio (450 / 650) |
|---|---|---|---|
| 8oxoG | |||
| Basal dialysate | 450 | 2.1 ± 0.1 | |
| 0.51 ± 0.01 | |||
| 650 | 4.3 ± 0.1 | ||
| 20 nM standard | 450 | 7.0 ± 0.1 | |
| 0.48 ± 0.02 | |||
| 650 | 13.8 ± 0.3 | ||
| 8OHdG | |||
| Basal dialysate | 450 | 0 | |
| 0 | |||
| 650 | 2.2 ± 0.4 | ||
| 20 nM standard | 450 | 3.6 ± 0.0 | |
| 0.38 ± 0.01 | |||
| 650 | 9.6 ± 0.3 | ||
Conditions: Sample or standard in Ringer’s injected for 60 s followed by 15 s injection of 0.1 M NaOH; Tris, borate BGE with 0.5 mM TTAB at pH 8.7, 50 µm i.d. capillary × 60 cm, separation and injection at −10 kV; detection potential vs. Ag/AgCl.
The basal 8oxoG concentration in rat brain microdialysate collected at a perfusion rate of 0.25 µL/min was measured in three rats using the CEEC method. A standard addition of +5, 10, and 15 nM was used for quantitation. In vivo delivery was also determined for one of the three brain probes, and was used to calculate the 8oxoG concentration in ECF of the rat cerebral cortex. The average concentration in the microdialysate was 3.2 ± 0.7 nM. With a recovery of 58.2 ± 4.9 %, the concentration of 8oxoG in the brain tissue was determined to be 5.5 ± 1.3 nM.
3.4 Microdialysis Sample Analysis by LCMSMS
LCMSMS was used as a secondary means of method validation. Samples were pooled and concentrated 10-fold, as the sample volume requirement and limits of detection for this technique are not adequate for routine analysis of the small-volume, low-concentration samples generated. Daughter ion spectra were first collected for 8oxoG and 8OHdG. The mass transitions chosen for MRM experiments were 168→111 m/z and 168→140 m/z for 8oxoG, and 284→168 m/z for 8OHdG. No significant difference in ionization was observed for standards in 10x Ringer’s solution compared to normal Ringer’s. The LCMSMS method was used to qualitatively identify the analytes in the sample and estimate their concentration. Concentrations were estimated by comparison with standard injections. Overlayed chromatograms of the 10x dialysate sample and a 10 nM 8oxoG standard reveal a peak with the exact retention time for 8oxoG for both mass transitions and is comparable in area to the 10 nM 8oxoG standard. Based on the comparison of these peak areas, it is reasonable to assume that 8oxoG was present in low nanomolar levels in the dialysate prior to sample concentration. The signal near the retention time of 8OHdG standards was not statistically different from the noise for a 10x dialysate sample or a blank Ringer’s sample. Since 8OHdG was not detected above the 10 nM limit of detection, the 8OHdG concentration in the sample was estimated as < 1 nM. This LCMSMS data supports the CEEC method findings that 8oxoG is present in low nanomolar concentrations in rat brain microdialysate, and 8OHdG is not present above ~ 0.5 –1 nM.
3.6 Critical Review of Reports of 8oxoG and/or 8OHdG Concentration in Microdialysates / ECF
Bogdanov et al. reported 8OHdG concentrations of ~ 150 pM in rat brain tissue (6 – 8 % recovery in vitro) [18,24]. The basal 8oxoG concentration in microdialysate determined by the CEEC method (3.2 nM) is an order of magnitude greater than the 8OHdG values reported by Bogdanov et al. in rat brain [18,24]. Bogdanov, however, does not report in vivo calibration. In addition, little detail is given about sample handling after sample collection. We have routinely noted, for example, that the 8oxoG and 8OHdG concentration in microdialysate decreases after the first 24 hours of refrigeration and upon freezing/thawing (data not shown). Without more specific information about recovery and sample handling, it is difficult to compare the CEEC results to this report.
Shigenaga et al. have stated that 8oxoG excretion rates are 10 times higher than for 8OHdG under normal conditions [23], which may explain why 8oxoG was detected and 8OHdG was not. Concentrations of 8oxoG and 8OHdG in human cerebrospinal fluid have also been reported. Rozalski et al. have measured 8oxoG and 8OHdG concentrations of ~ 1 nM by LCEC in cancer patients [54] and Lovell et al. found 8OHdG concentrations of over 500 nM in postmortem CSF [55]. Although not in rats, the results of Rozalski correlate with our CEEC results. The concentration of GTP in nucleotide pools is much greater than the amount of GMP in DNA, a fact that is largely overlooked in discussions about the number of “oxidative hits” sustained by cells. As more laboratories continue to focus on the involvement of the MutT enzyme in sanitation of nucleotide pools, a better estimate of the concentration of 8oxoG and/or 8OHdG in ECF may become available.
Microdialysis is a valuable sampling tool for measuring oxidative stress in vivo, assuming the concentrations of biomarkers are higher for ECF analysis than in DNA analysis. It is a viable alternative to DNA analysis to obtain site-specific information and does not involve harsh sample pretreatment. Coupled to CEEC, detection is selective and sensitive for 8oxoG, and will not cause artifactual oxidation if operated in reverse polarity. In addition, the CE separation for 8oxoG has added advantages over an LC separation. Our group has found that 8oxoG is poorly retained on reverse phase columns and its separation from dialysate matrix components is extremely difficult [56]. In fact, rarely does the determination of 8oxoG and 8OHdG in complex biological samples occur concomitantly in an analytical method. Because of their similar properties, misidentification of these two biomarkers can occur in the absence of a clear separation and secondary identification, as demonstrated here.
4 Conclusions
A CEEC method was successfully developed for the analysis of 8oxoG and 8OHdG in brain microdialysate. The 0.5 nM limit of detection achieved for 8oxoG and 8OHdG with this method is 100 times lower compared to our previously published CEEC method [42]. This limit of detection is attributed to on-line preconcentration by pH-mediated stacking and the effectiveness of the laser-etched decoupler in limiting noise at the working electrode. The concentration LOD for 8OHdG with this method is an order of magnitude higher than LC with coulometric detection [18], however, the mass LOD is over an order of magitude lower. The CEEC method also requires over an order of magnitude less sample volume, and requires no sample pretreatment. The concentration of 8oxoG in brain microdialysate was found to be 3.2 ± 0.7 nM at a perfusion rate of 0.25 µL/min, corresponding to an extracellular concentration of 5.5 ± 1.3 nM 8oxoG in the rat cerebral cortex. Microdialysis sampling of 8oxoG was also demonstrated for the first time. No 8OHdG was detected above 0.5 nM. The CEEC results for 8oxoG and 8OHdG were also supported by LCMSMS data. This method provides a clear separation of 8oxoG and 8OHdG in a biological sample and also provides a means of their qualitative identification. This method can be employed for the analysis of brain microdialysate samples during animal models of stroke, with superior time resolution compared to existing methods and will allow multiple analyses at a single time point. Furthermore, this method can be used to generate site-specific information about oxidative DNA damage while eliminating the need for harsh sample pretreatments and limiting the number of animals statistically required for data analysis.
Acknowledgements
This work was supported by the National Institutes of Health grant R01EB00247. SDA and SSV acknowledge the support of the National Cancer Institute from training grant T32CA09242.
References
- 1.Cirak B, Rousan N, Kocak A, Palaoglu O, Palaoglu S, Kilic K. Pediatr. Neurosurg. 1999;31:298. doi: 10.1159/000028879. [DOI] [PubMed] [Google Scholar]
- 2.Taoka Y, Okajima K. Prog. Neurobiol. 1998;56:341. doi: 10.1016/s0301-0082(98)00049-5. [DOI] [PubMed] [Google Scholar]
- 3.White BC, Sullivan JM, DeGracia DJ, O'Neil BJ, Neumar RW, Grossman LI, Rafols JA, Krause GS. J. Neurol. Sci. 2000;179:1. doi: 10.1016/s0022-510x(00)00386-5. [DOI] [PubMed] [Google Scholar]
- 4.Kasai H. Mutat. Res. 1997;387:147. doi: 10.1016/s1383-5742(97)00035-5. [DOI] [PubMed] [Google Scholar]
- 5.Kasai H, Nishimura S. Nucl. Acids Res. 1984;12:2137. doi: 10.1093/nar/12.4.2137. [DOI] [PMC free article] [PubMed] [Google Scholar]
- 6.Kuchino Y, Mori F, Kasai H, Inoue H, Iwai S, Miura K, Ohtsuka E. Nature. 1987;327:77. doi: 10.1038/327077a0. [DOI] [PubMed] [Google Scholar]
- 7.Lunec J, Holloway KA, Cooke MS, Faux S, Griffiths HR, Evans MD. Free Radical Biol. Med. 2002;33:875. doi: 10.1016/s0891-5849(02)00882-1. [DOI] [PubMed] [Google Scholar]
- 8.Wilson VL, Taffe BG, Shields PG, Povey AC, Harris CC. Environmental Health Perspectives. 1993;99:261. doi: 10.1289/ehp.9399261. [DOI] [PMC free article] [PubMed] [Google Scholar]
- 9.Fiala ES, Conaway CC, Mathis JE. Cancer Res. 1989;49:5518. [PubMed] [Google Scholar]
- 10.Loft S, Poulsen HE, Vistisen K, Knudsen LE. Mutat. Res. 1999;441:11. doi: 10.1016/s1383-5718(99)00034-0. [DOI] [PubMed] [Google Scholar]
- 11.Asami S, Manabe H, Miyake J, Tsurudome Y, Hirano T, Yamaguchi R, Itoh H, Kasai H. Carcinogenesis. 1997;18:1763. doi: 10.1093/carcin/18.9.1763. [DOI] [PubMed] [Google Scholar]
- 12.Tagesson C, Kallberg M, Klintenberg C, Starkhammar H. Eur. J. Cancer. 1995;31:934. doi: 10.1016/0959-8049(94)00490-0. [DOI] [PubMed] [Google Scholar]
- 13.Musarat J, Arezina-Wilson J, Wani AA. Eur. J. Cancer. 1996;32:1209. doi: 10.1016/0959-8049(96)00031-7. [DOI] [PubMed] [Google Scholar]
- 14.Erhola M, Toyokuni S, Okada K, Tanaka T, Hiai H, Ochi H, Uchida K, Osawa T, Nieman MM, Alho H, Kellokumpu-lehtinen P. FEBS Lett. 1997;409 doi: 10.1016/s0014-5793(97)00523-1. [DOI] [PubMed] [Google Scholar]
- 15.Baek S-H, Kim J-Y, Choi J-H, Park E-M, Han M-Y, Kim C-H, Ahn Y-S, Park Y-M. Brain Res. 2000;856:28. doi: 10.1016/s0006-8993(99)02376-8. [DOI] [PubMed] [Google Scholar]
- 16.Yamagami K, Yamamoto Y, Kume M, Ishikawa Y, Yamaoka Y, Hiai H, Toyokuni S. Antiox. Redox Signal. 2000;2:127. doi: 10.1089/ars.2000.2.1-127. [DOI] [PubMed] [Google Scholar]
- 17.An S-J, Kang T-C, Park S-K, Hwang I-K, Cho SS, Chung M-H, Won MH. Mol. Cells. 2002;13:476. [PubMed] [Google Scholar]
- 18.Bogdanov MB, Beal MF, McCabe DR, Griffin RM, Matson WR. Free Radic. Biol. Med. 2001;27:647. doi: 10.1016/s0891-5849(99)00113-6. [DOI] [PubMed] [Google Scholar]
- 19.Helbock HJ, Beckman KB, Ames BN. Methods Enzymol. 1999;300:156. doi: 10.1016/s0076-6879(99)00123-8. [DOI] [PubMed] [Google Scholar]
- 20.Loft S, Poulsen HE. Methods Enzymol. 1999;300:166. doi: 10.1016/s0076-6879(99)00124-x. [DOI] [PubMed] [Google Scholar]
- 21.Rehman A, Jenner A, Halliwell B. Methods Enzymol. 2000;319:401. doi: 10.1016/s0076-6879(00)19038-x. [DOI] [PubMed] [Google Scholar]
- 22.Lunec J, Griffiths HR, editors. Measuring in vivo Oxidative Damage: A Practical Approach. New York: John Wiley & Sons, Ltd.; 2000. [Google Scholar]
- 23.Shigenaga MK, Aboujaoude EN, Chen Q, Ames BN. Methods Enzymol. 1994;234:16. doi: 10.1016/0076-6879(94)34073-0. [DOI] [PubMed] [Google Scholar]
- 24.Bogdanov MB, Andreassen OA, Dedeoglu A, Ferrante RJ, Beal MF. J. Neurochem. 2001;79:1246. doi: 10.1046/j.1471-4159.2001.00689.x. [DOI] [PubMed] [Google Scholar]
- 25.Yang C-S, Tsai P-J, Chen W-Y, Kuo J-S. Redox Report. 1996;2:379. doi: 10.1080/13510002.1996.11747078. [DOI] [PubMed] [Google Scholar]
- 26.Yang C-S, Chen W-Y, Tsai P-J, Kuo J-S. Clin. Chim. Acta. 1999;285:163. doi: 10.1016/s0009-8981(99)00071-6. [DOI] [PubMed] [Google Scholar]
- 27.Floyd RA, Watson JJ, Wong PK, Altmiller DH, Rickard RC. Free Rad. Res. Commun. 1986;1:163. doi: 10.3109/10715768609083148. [DOI] [PubMed] [Google Scholar]
- 28.Kasai H, Crain PF, Kuchino Y, Nishimura S, Ootsuyama A, Tanooka H. Carcinogenesis. 1986;7:1849. doi: 10.1093/carcin/7.11.1849. [DOI] [PubMed] [Google Scholar]
- 29.Helbock HJ, Beckman KB, Shigenaga MK, Walter PB, Woodall AA, Yeo HC, Ames BN. Proc. Natl. Acad. Sci. USA. 1998;95:288. doi: 10.1073/pnas.95.1.288. [DOI] [PMC free article] [PubMed] [Google Scholar]
- 30.Claycamp HG. Carcinogenesis. 1992;13:1289. doi: 10.1093/carcin/13.7.1289. [DOI] [PubMed] [Google Scholar]
- 31.Ravanat JL, Turesky RJ, Gremund E, Trudel LJ, Stadler RH. Chem. Res. Toxicol. 1995;8:1039. doi: 10.1021/tx00050a007. [DOI] [PubMed] [Google Scholar]
- 32.ESCODD. Free Rad. Res. 2000;32:333. [Google Scholar]
- 33.ESCODD. Free Rad. Res. 2002;36:239. doi: 10.1080/10715760290019246. [DOI] [PubMed] [Google Scholar]
- 34.Riis B ESCODD. Free Rad. Res. 2002;36:649. doi: 10.1080/10715760290029047. [DOI] [PubMed] [Google Scholar]
- 35.ESCODD. Carcinogenesis. 2002;23:2129. doi: 10.1093/carcin/23.12.2129. [DOI] [PubMed] [Google Scholar]
- 36.Mayumi T, Schiller HJ, Bulkley GB. In: Free Radicals: From Basic Science to Medicine. Poli G, Albano E, Dianzani MU, editors. Basel: Birkhauser Verlag; 1993. [Google Scholar]
- 37.Nagayama T, Lan J, Henshall DC, Chen D, O'Horo C, Simon RP, Chen J. J. Neurochem. 2000;75:1716. doi: 10.1046/j.1471-4159.2000.0751716.x. [DOI] [PubMed] [Google Scholar]
- 38.Won MH, Kang T-C, Park S-K, Jeon G-S, Kim Y-W, Seo JH, Choi E-M, Chung M-H, Cho SS. Neurosci. Lett. 2001;301:139. doi: 10.1016/s0304-3940(01)01625-1. [DOI] [PubMed] [Google Scholar]
- 39.Lan J, Li W, Zhang F, Sun F-Y, Nagayama T, O'Horo C, Chen J. J. Cerebral Blood Flow Metabol. 2003;23:1324. doi: 10.1097/01.WCB.0000091540.60196.F2. [DOI] [PubMed] [Google Scholar]
- 40.Park E-M, Choi J-H, Park J-S, Han M-Y, Park Y-M. Brain Res. Prot. 2000;6:25. [Google Scholar]
- 41.Tsurya K, Furuichi M, Tominaga Y, Shinozaki M, Tokumoto M, Yoshimitsu T, Fukada K, Kanai H, Hirakata H, Iida M, Nakabeppu Y. DNA Repair. 2003;2:211. doi: 10.1016/s1568-7864(02)00214-8. [DOI] [PubMed] [Google Scholar]
- 42.Weiss DJ, Lunte CE. Electrophor. 2000;21:2768. doi: 10.1002/1522-2683(20000801)21:14<2768::AID-ELPS2768>3.0.CO;2-P. [DOI] [PMC free article] [PubMed] [Google Scholar]
- 43.Zhao Y, Lunte CE. Anal. Chem. 1999;71:3985. doi: 10.1021/ac990242l. [DOI] [PMC free article] [PubMed] [Google Scholar]
- 44.Arnett SD, Lunte CE. Electrophoresis. 2003;24:1745. doi: 10.1002/elps.200305399. [DOI] [PMC free article] [PubMed] [Google Scholar]
- 45.Park S. Ph.D. Thesis. Lawrence, KS: University of Kansas; 1996. [Google Scholar]
- 46.Osbourn DM, Lunte CE. Anal. Chem. 2001;73:5961. doi: 10.1021/ac010496i. [DOI] [PMC free article] [PubMed] [Google Scholar]
- 47.Park S, Lunte SM, Lunte CE. Anal. Chem. 1995;67:911. [Google Scholar]
- 48.Hamberg M, Zhang LY. Anal. Biochem. 1995;229:336. doi: 10.1006/abio.1995.1422. [DOI] [PubMed] [Google Scholar]
- 49.Weimann A, Belling D, Poulsen HE. Nucl. Acids Res. 2002;30:e7. doi: 10.1093/nar/30.2.e7. [DOI] [PMC free article] [PubMed] [Google Scholar]
- 50.Olechno JD, Nolan JA. In: Handbook of Capillary Electrophoresis. Landers JP, editor. New York: CRC Press; 1997. [Google Scholar]
- 51.Goyal RN, Dryhurst G. J. Electroanal. Chem. 1982;135:75. [Google Scholar]
- 52.Oliveira Brett AM, Piedale JAP, Serrano SHP. Electroanalysis. 2000;12:969. [Google Scholar]
- 53.Langmaier J, Samec Z, Samcova E. Electroanalysis. 2003;15:1555. [Google Scholar]
- 54.Rozalski R, Winkler P, Gackowski D, Paciorek T, Kasprzak H, Olinski R. Clin. Chem. 2003;49:1218. doi: 10.1373/49.7.1218. [DOI] [PubMed] [Google Scholar]
- 55.Lovell M, Gabbita P, Markesbery WR. J. Neurochem. 1999;72:771. doi: 10.1046/j.1471-4159.1999.0720771.x. [DOI] [PubMed] [Google Scholar]
- 56.Charbonnet AT. Ph.D. Thesis. Lawrence, KS: University of Kansas; 2004. [Google Scholar]


