Abstract
Capillary electrophoresis (CE) has become a useful analytical tool for the analysis of microdialysis samples. However, CE with UV detection (CE-UV) is not sensitive enough to quantify glutathione (GSH) and glutathione disulfide (GSSG) in high ionic strength sample matrices such as microdialysates, because of the small optical path length in the capillary. To overcome this limitation, an on-column preconcentration technique, pH-mediated base stacking, was used in this study to improve the sensitivity of CE-UV. In pH-mediated base stacking, sample injection is followed by the injection of sodium hydroxide to achieve on-column preconcentration of analytes. This stacking technique allowed large volumes of high ionic strength samples to be injected without deterioration of the separation efficiency and resolution. The limit of detection for GSH and GSSG was found to be 0.75 µM (S/N = 6) and 0.25 µM (S/N = 6), respectively. A 26-fold increase in sensitivity was achieved for both GSH and GSSG using the pH-mediated base stacking, relative to normal injection without stacking. The developed method was used to analyze GSH and GSSG in liver microdialysates of anesthetized Sprague Dawley male rats. The basal concentrations of GSH and GSSG in the liver microdialysates of male rats were found to be 4.73 ± 2.08 µM (n = 7) and 5.52 ± 3.66 µM (n = 7), respectively.
Keywords: Capillary electrophoresis, Glutathione, glutathione disulfide, pH-mediated stacking, On-column preconcentration, Microdialysis samples
1 Introduction
Glutathione is a thiol found intracellularly at high concentrations (1–10 mM) [1] and is also present in small amounts in the extracellular fluid. Glutathione exists as reduced glutathione (GSH) and in an oxidized form as glutathione disulfide (GSSG). GSH is a tripeptide of glycine, glutamate, and cysteine and GSSG is a dimer of GSH, where two GSH molecules are linked through a disulfide bond. A deficiency of glutathione is thought to be associated with a variety of diseases, such as cancer, neurodegenerative disorders, cystic fibrosis, lung diseases, HIV, and aging [1, 2]. One of the important functions of GSH in biological systems is antioxidant activity where GSH is oxidized to GSSG as it scavenges reactive oxygen species [2–4]. Therefore, the simultaneous determination of GSH and GSSG in biological fluids, such as microdialysates, is important since the ratio of GSH to GSSG concentration may be used as a biomarker of oxidative stress [2, 5].
High performance liquid chromatography (HPLC) has been used widely for the analysis of thiols and disulfides in biological samples [6–10], but this separation technique requires a sample volume in the microliter range. Capillary electrophoresis (CE), however, uses only a few nanoliters of sample and is therefore a good choice to couple to microdialysis sampling which produces samples of only a few microliters total volume. A few papers have reported the analysis of biologically important thiols in microdialysis samples using CE with fluorescence and electrochemical (EC) detection [11, 12].
UV detection is widely used in CE since it is easy to operate and assemble to the CE system. However, it has poor concentration sensitivity because of the small optical path length (25–75 µm) limited by the inner diameter of the capillary and small sample injection volumes (~ nL). To improve the sensitivity of UV detection, the analytes can be chemically derivatized by UV labeling agents with strong UV absorption [13]. EC detection is more sensitive, but the integration of an EC detection cell with an electrophoretic separation system can be problematic because the separation current has to be separated effectively from the detection circuit [14, 15]. Laser-induced fluorescence (LIF) detection is highly sensitive, but requires chemical derivatization with fluorescent labels when the analytes do not have native fluorescence.
A simple way to improve the sensitivity of CE with UV detection (CE-UV) without using any chemical derivatization is to use an on-column preconcentration technique so that a larger sample volume may be injected onto the capillary without losing separation efficiency and resolution. To make UV detection more sensitive without using any chemical derivatization, various on-column preconcentration techniques [16– 19] have been used such as, field-amplified stacking [20, 21], large-volume sample stacking [22, 23], pH-mediated stacking [24–27], transient isotachophoresis (t-ITP) [28– 30], transient pseudo-isotachophoresis (tp-ITP) [31, 32], and dynamic pH junction [33, 34].
pH-mediated stacking has proven to be a simple and useful on-column preconcentration technique for the analysis of high ionic strength samples, such as microdialysates[24–27]. Using this technique, a large volume of high ionic strength sample can be injected directly into the CE capillary without prior dilution or any sample pretreatment. Acid stacking is used for cationic analytes and base stacking for anionic analytes. Both stacking techniques have been used successfully to increase the sensitivity of CE-UV for a variety of analytes in high ionic strength matrices [24–27]. A 66-fold enhancement in sensitivity has been reported using the pH-mediated base stacking method for the analysis of anions, such as p-hydroxybenzoic acid, vanillic acid, p-coumaric acid, and syringic acid [25].
Both GSH and GSSG are anions at physiological pH, hence, base stacking was used in this study. In base stacking, the EOF is reversed using a cationic surfactant in the BGE and the separation is performed with reverse polarity in order to obtain electromigration of anions and EOF in the same direction. The background electrolyte consists of salt of a weak base (e.g. NH4+). A large volume sample injection is followed by the injection of a strong base. This results in the titration of BGE cations (e.g. ammonium ions in NH4+/NH3 buffer) by hydroxyl ions and creates a low conductivity sample zone where anions move faster and stack at the interface of the sample and highly conductive background electrolyte [25, 27].
This paper describes the optimization of a CE-UV method with pH-mediated base stacking for the simultaneous analysis of GSH and GSSG in high ionic strength sample matrix and the application of the developed method to quantify GSH and GSSG in the liver microdialysates of anesthetized male Sprague Dawley rats.
2 Materials and methods
2.1 Materials
Reduced glutathione (~98%), glutathione disulfide (~98%), and tetradecytrimethylammonium bromide (99%) were purchased from Sigma-Aldrich Company (St. Louis, MO). All other compounds were reagent grade or better. Distilled-deionized-water (Water Pro Ps, Labconco, Kansas City, MO) was used in the preparation of all solutions. The anesthetics (Isoflurene, Xylazine, and Ketamine) used for the animal studies were supplied by the Animal Care Unit at the University of Kansas.
2.2 Sample Preparation
The CE background electrolyte (BGE) was ammonium buffer and consisted of 100 mM ammonium chloride with 0.5 mM tetradecytrimethylammonium bromide (TTAB) adjusted to pH 8.4 with 0.1M sodium hydroxide solution. The Ringer’s solution was composed of 155 mM NaCl, 5.5 mM KCl, and 2.3 mM CaCl2 at pH 7.4. Both GSH (10 mM) and GSSG (5 mM) stock solutions were prepared in BGE. GSH stock solution was prepared daily and GSSG stock solution was prepared weekly and stored in the refrigerator. Standard solutions of GSH and GSSG were prepared daily from their stock solutions by multiple dilutions with Ringer’s solution. Buffer and Ringer’s solutions were bubbled with Argon gas for 20 min to remove dissolved oxygen. All solutions were filtered through a 0.22 µm pore size syringe filter (Millipore Millex™GP, Fisher Scientific) prior to use. The microdialysis samples were analyzed without any pretreatment.
2.3 CE-UV Apparatus
A lab-built CE system with a SpectraPhysics UV1000 (Thermoseparation, San Jose, CA) was used as the UV detector was used for this study. Polyimide coated fused silica capillary (Polymicro Technologies, Phoenix, AZ) with 50 µm ID and 360 µm OD was cut to a total length of 60 cm long with a 45 cm effective length. The analysis was performed in reversed EOF mode using a cationic surfactant, TTAB, in the background electrolyte. Both GSH and GSSG were detected on-column by UV absorbance at a wavelength of 214 nm. A voltage of −10 kV was applied across the capillary using a high voltage power supply unit (CZE1000R, Spellman High Voltage Electronics, Hauppauge, NY, USA) to drive the electrophoresis. All sample injections into the capillary were made electrokinetically at −10 kV, and analyses were performed at ambient temperature. Data acquisition was through an PCI-MIO-16XE-50 A/D computer card and programming was performed in-house using LabView software (National Instruments, Austin, TX).
2.4 Microdialysis Sampling
A CMA/100 microinjection pump purchased from CMA/Microdialysis AB, (Stockholm, Sweden) was used to deliver Ringer’s solution at a flow rate of 1 µL/min flow rate through the microdialysis probe. Linear probes of 10 mm active length were made from polyimide tubing with 127 µm OD and 100 µm ID (MicroLumen Inc., Tampa, FL) and Spectra/Por® in vivo microdialysis hollow fibers of regenerated cellulose (Spectrum, Rancho Dominguez, CA) with a 216 µm OD, a 200 µm ID, and a molecular weight cut-off of 18,000 Daltons. Probe calibration was performed by no net flux (NNF) experiment in vivo [35].
2.5 Surgical Procedure
Prior to the surgery, male Sprague-Dawley rats (350 – 400 g weight) were pre-anesthetized using Isoflurene and then fully anesthetized by intra-muscular injection of ketamine (100 mg/kg dose) and xylazine (10 mg/kg dose) mixture. Additional doses of ketamine (1/4 of original dose) were injected as needed to keep the rats anesthetized throughout the entire experiment. The anesthetized rats were placed on top of a heated pad to maintain body temperature during the surgery and sampling. The liver was exposed after the abdominal incision. The linear probe was implanted in the liver and perfused with Ringer’s solution at a flow rate of 1 µL/min in all experiments. The implanted probe was flushed with Ringer’s solution for 30 min before collecting microdialysate at 10 min intervals. The concentrations of GSH and GSSG in collected microdialysates were monitored for 60 to 120 min to achieve steady basal levels.
3 Results and discussion
3.1 Optimization of sample and base injection length
One way to improve the sensitivity of UV detection is to inject a large volume sample. However, this leads to peak broadening or destacking unless employing an on-column preconcentration technique. Figure 1 shows that both sensitivity and resolution are very low for GSH and GSSG with 3 s and 30 s sample injections for samples in Ringer’s solution. Normal injection without stacking does not provide sufficient detection limits for the analysis of GSH and GSSG in biological samples even when injecting large volume samples (e.g. 30 s sample injection). The poor sensitivity and separation efficiency are the results of the small optical path length (50 µM) in the capillary and the destacking phenomena of high ionic strength samples. Sample destacking occurs when the sample zone has a higher conductivity than that of the BGE. The high ionic strength samples have high conductivity and charged analytes migrate slowly in the sample zone. During the CE separation, the analytes migrate faster when they enter the BGE zone from the sample zone, thus resulting in sample destaking or band broadening. The extent of destacking is higher with the longer sample injection times and higher ionic strength samples [24, 25, 27].
Figure 1.
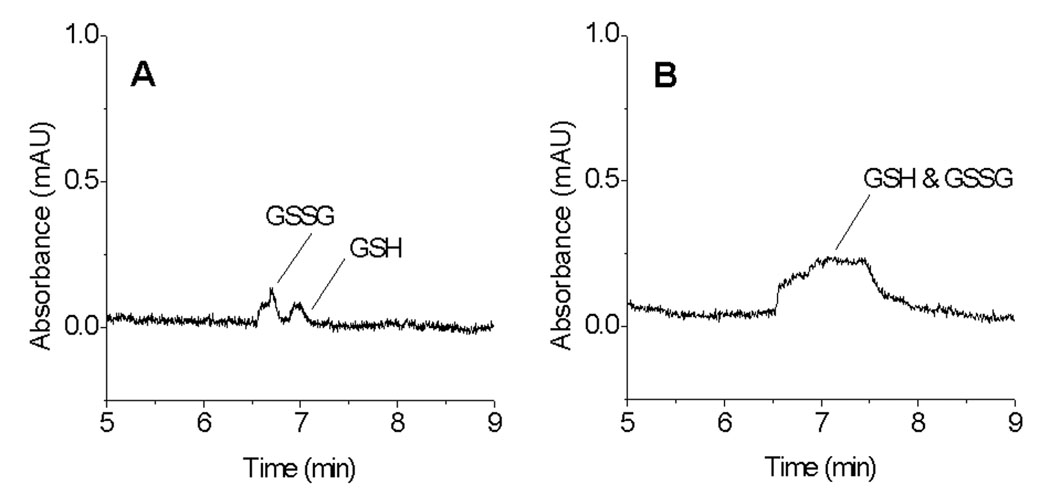
GSH and GSSG detection without pH-mediated stacking. (A) 3 s electrokinetic (EK) injection of sample (mixture of 10 µM GSH and 10 µM GSSG in Ringer’s solution), (B) 30 s EK injection of sample. Conditions: 50 µm ID capillary × 60 (45) cm, 100 mM NH4Cl BGE with 0.5 mM TTAB at pH 8.4, EK injection at −10 kV, separation at −10 kV, and detection at 214 nm.
Sample injection followed by 0.1 M NaOH injection (pH-mediated base stacking) increased the sensitivity and efficiency of both GSH and GSSG (Figures 2 and Table 1). The amount of base to be injected into the capillary is dependent on the amount of sample injected. Hence, sensitivity increases as a function of base injection time until the base amount reaches an optimum. The electrokinetic injection of OH- results in the titration of NH4+ to NH3, creating a low conductivity sample zone through which the analyte anions migrate faster and stack at the interface of the titrated sample and BGE zones. Peak tailing is the result of incomplete titration of the sample zone as an insufficient amount of base relative to sample is injected. It has been shown that too long of a base injection results in the deterioration of the separation resolution because most of the capillary length is used for stacking and only a small portion of the capillary is left for the separation [25].
Figure 2.
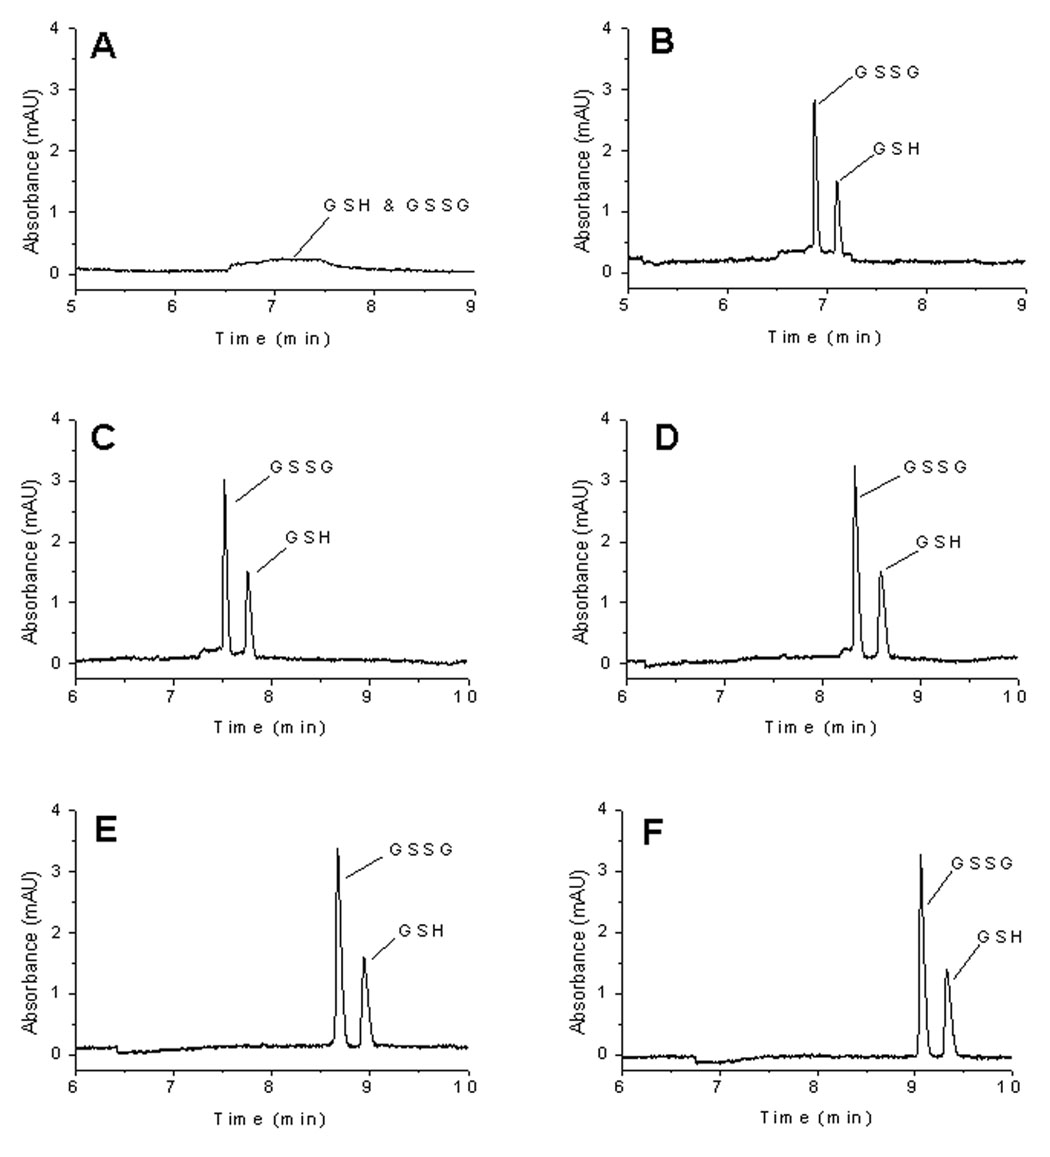
Optimization of injection ratio with ammonium buffer system. (A) 30 s EK injection of sample (mixture of 10 µM GSH and 10 µM GSSG in Ringer’s solution)/0 sEK injection of NaOH, (B) 30 s EK sample /30s EK NaOH, (C) 30 s EK sample/40 s EK NaOH, (D) 30 s EK sample /50 s EK NaOH, (E) 30 s EK sample /60 s EK NaOH, (F) 30 s EK sample /70 s EK NaOH. Conditions: same as in Figure 1.
Table 1.
Separation Efficiency as a Function of Injection Ratio
| Injection Ratio (Sample/NaOH) | S/N | Efficiency (x 1000) | ||
|---|---|---|---|---|
| GSH | GSSG | GSH | GSSG | |
| 30 s/0 s | A broad unresolved peak (Figure 2A) | |||
| 30 s/30 s | 28 | 56 | 130 | 189 |
| 30 s/40 s | 30 | 62 | 107 | 236 |
| 30 s/50 s | 30 | 66 | 90 | 208 |
| 30 s/60 s | 31 | 69 | 97 | 224 |
| 30 s/70 s | 30 | 70 | 103 | 201 |
It has been shown that the optimum base injection time is a function of capillary length, the ionic strengths of sample and BGE, and the analyte electrophoretic mobility [25, 27]. Using the ammonium buffer system (100 mM NH4Cl with 0.5 mM TTAB, pH 8.4) and a 30 s sample injection, sensitivity and efficiency increased with an increase in base injection time up to 60 s. Base injections longer than 60 s did not improve the separation. Analysis of 10 µM GSH and 10 µM GSSG standard in Ringer’s solution using the optimized injection protocol of a 30 s sample injection followed by a 60 s injection of 0.1 M NaOH (30 s/60 s) showed a 26-fold increase in sensitivity for both GSH (Figures 3A and 3B) and GSSG (Figures 3C and 3D) in comparison to normal electrokinetic injection (3 s injection without stacking).
Figure 3.
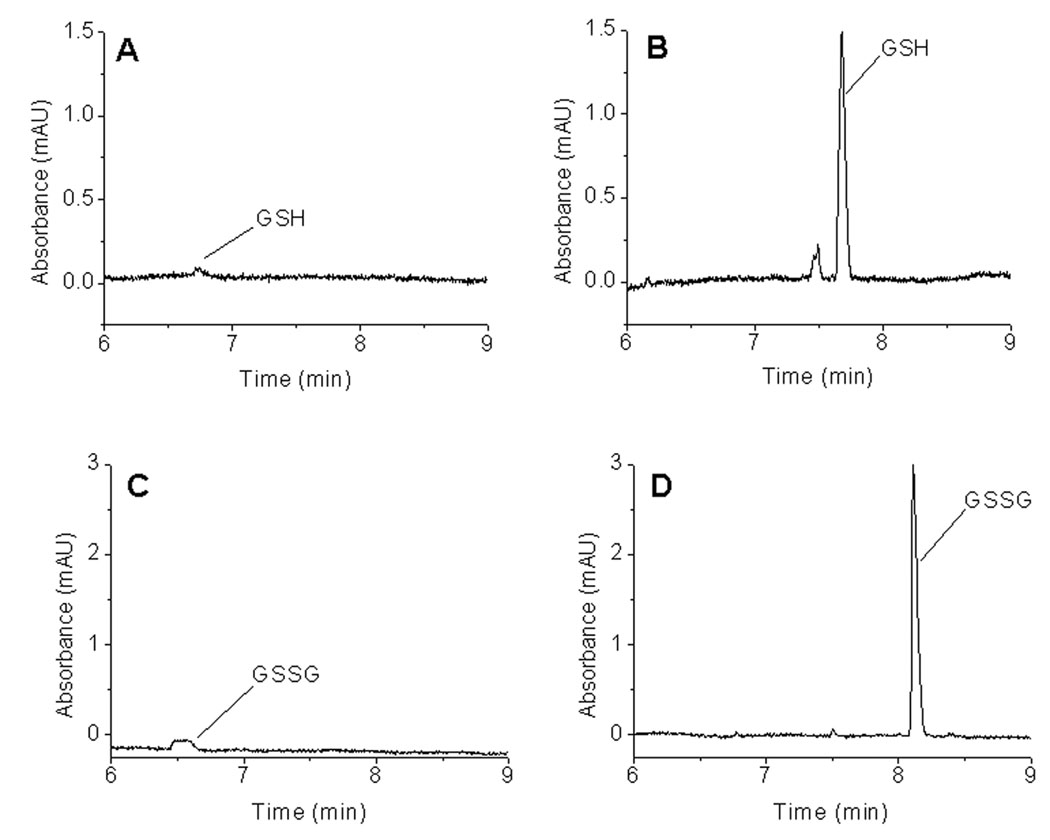
Effect of pH-mediated base stacking on sensitivity. (A) GSH without stacking; 3 s EK injection of 10 µM GSH in Ringer’s solution/0 s EK injection of NaOH, (B) GSH with stacking, 30 s EK 10 µM GSH in Ringer’s solution/60s EK NaOH, (C) GSSG without stacking; 3 s EK 10 µM GSSG in Ringer’s solution/0 s EK NaOH, (D) GSSG with stacking; 30 s EK 10 µM GSSG in Ringer’s solution/60 s EK NaOH. Conditions: same as in Figure 1.
3.2 Method Validation
The performance of the method in terms of reproducibility of migration time and sensitivity was evaluated by comparing migration time and sensitivity between analyses of 10 µM GSSG standard solutions in the same capillary. The reproducibility of migration time (7.17 ± 0.082 min) and sensitivity (0.257 ± 0.008 mAU/µM) was acceptable, with RSDs below 5% (1.14% and 3.08%, respectively and n = 12) for the analysis within the same day. The resolution of GSH and GSSG was found to be 2.53 ± 0.171 (n = 12).
The limits of detection for the analysis of GSH and GSSG were found to be 0.75 µM (S/N = 6) and 0.25 µM (S/N = 6), respectively. Electropherograms near the limits of detection of GSH and GSSG are shown in Figure 4.
Figure 4.
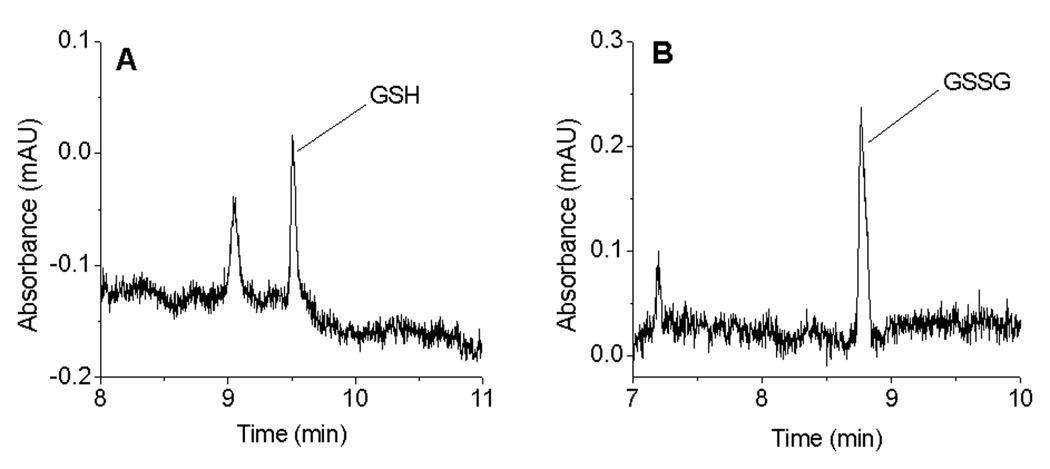
Electropherograms of GSH and GSSG near the detection limit. Conditions: same as in Figure 1.
The relationship between peak height (mAU) and concentration (µM) for standards prepared in Ringer’s solution was evaluated by linear regression analysis. The response for GSH was linear over the range of 0.75 µM to 40 µM (n = 6). The response for GSSG was linear over the range of 0.75 µM to 50 µM (n = 7). The equations for the regression lines were y = 0.130x + 0.012 (R2 = 0.995) for GSH and y = 0.252x + 0.127 (R2 = 0.997) for GSSG.
4 Determination of GSH and GSSG in microdialysis samples
The optimized CE-UV method with pH-mediated base stacking was used to determine the basal concentrations of GSH and GSSG in liver microdialysates of anesthetized Sprague Dawley male rats. A typical electropherogram of basal rat liver microdialysate is shown in Figure 5A. The identity of the GSH and GSSG peaks in the electropherogram were confirmed by spiking with standards (Figure 5). To perform spiking experiments, 10 µL of microdialysate was spiked with 2 µL of 100 µM GSH and GSSG standard solution. The concentrations of GSH and GSSG were determined from GSH and GSSG calibration curves. The recoveries of GSH and GSSG determined by in vivo no net flux experiments were 49.5 ± 13.4 % (n = 2) and 47.0 ± 2.83% (n = 2), respectively. The concentrations of GSH and GSSG in the extracellular space of the liver varied from rat to rat (Table 2). Based on probe calibration results, the average basal concentrations of GSH and GSSG in the liver microdialysates of male rats were found to be 4.73 ± 2.08 µM (n = 7) and 5.52 ± 3.66 µM (n = 7), respectively.
Figure 5.
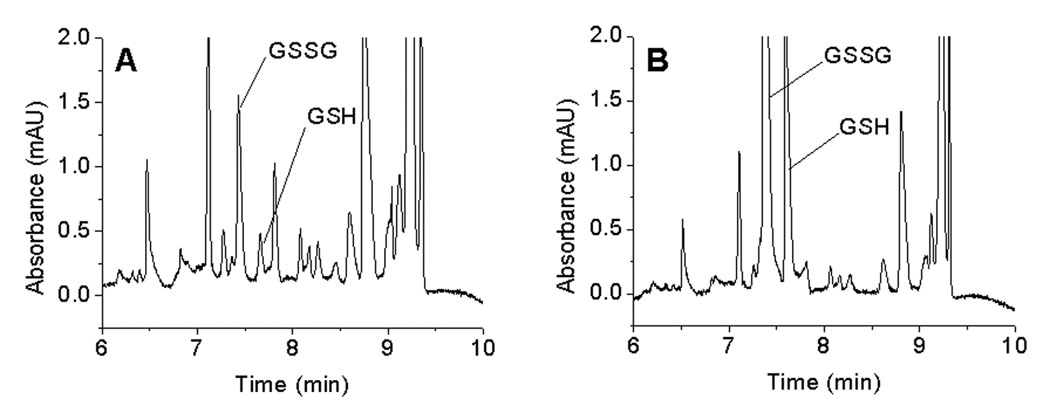
Electropherograms of unspiked and spiked liver microdialysates. (A) liver microdialysate, (B) spiked liver microdialysate. Conditions: same as in Figure 1.
Table 2.
Concentration of GSH and GSSH in Rat Liver Microdialysate
| Rat | GSH (µM) | GSSG (µM) |
|---|---|---|
| 1 | 7.37 ± 2.04 | 9.06 ± 0.24 |
| 2 | 2.62 ± 1.37 | 9.78 ± 1.65 |
| 3 | 5.14 ± 0.24 | 8.54 ± 3.35 |
| 4 | 3.59 ± 0.25 | 1.86 ± 0.06 |
| 5 | 3.93 ± 0.10 | 1.53 ± 0.13 |
| 6 | 7.66 ± 2.21 | 5.70 ± 1.95 |
| 7 | 2.79 ± 0.11 | 2.14 ± 0.05 |
This variation may be due to the variation in the stress levels of different rats. In a previous study using CE with electrochemical detection, the basal concentration of GSH in liver microdialysates of anesthetized male Sprague Dawley rats was found to be 4.7 ± 1.6 µM [12]. In another study using HPLC with fluorescence detection, the concentration of GSH in rat liver microdialysates was found to be in the range of 4.16 to 76.5 µM [39].
5 Concluding remarks
A CE-UV method with pH-mediated base stacking has been developed to analyze glutathione and glutathione disulfide simultaneously in high ionic strength sample matrices. This method provides a simple and effective way for the on-column preconcentration and detection of analytes in a single run, and sensitivity to GSH and GSSG detection was increased by a 26-fold relative to normal sample injection without stacking. The limits of detection for GSH and GSSG in high ionic strength sample matrices were 0.75 µM (S/N = 6) and 0.25 µM (S/N = 6), respectively. The method was successfully used to determine GSH and GSSG in liver microdialysates of Sprague-Dawley male rats, and could be employed in the future to monitor the GSH and GSSG concentration change during oxidative stress (e.g. ischemia and reperfusion) for the better understanding of antioxidant activity of GSH.
Acknowledgements
This work was supported by the National Institutes of Health grant R01EB00247. SDA and SSV acknowledge the support of the National Cancer Institute from training grant T32CA09242.
References
- 1.Townsend DM, Tew KD, Tapiero H. The importance of glutathione in human disease. Biomed. Pharmacother. 2003;57:145–155. doi: 10.1016/s0753-3322(03)00043-x. [DOI] [PMC free article] [PubMed] [Google Scholar]
- 2.Kidd PM. Glutathione: Systemic protectant against oxidative and free radical damage. Altern. Med. Rev. 1997;2(1):155–176. [Google Scholar]
- 3.Lu SC. Regulation of hepatic glutathione synthesis: Current concepts and controversies. FASEB J. 1999;13:1169–1183. [PubMed] [Google Scholar]
- 4.Sen CK. Nutritional biochemistry of cellular glutathione. J. Nutr. Biochem. 1997;8:660–672. [Google Scholar]
- 5.Carru C, et al. Optimization of the principal parameters for the ultrarapid electrophoretic separation of reduced and oxidized glutathione by capillary electrophoresis. J. Chromatogr. A. 2003;1017:233–238. doi: 10.1016/j.chroma.2003.08.020. [DOI] [PubMed] [Google Scholar]
- 6.Camera E, Picardo M. Analytical methods to investigate glutathione and related compounds in biological and pathological processes. J. Chromatogr. B. 2002;781:181–206. doi: 10.1016/s1570-0232(02)00618-9. [DOI] [PubMed] [Google Scholar]
- 7.Pastore A, et al. Analysis of glutathione: Implication in redox and detoxification. Clin. Chim. Acta. 2003;333:19–39. doi: 10.1016/s0009-8981(03)00200-6. [DOI] [PubMed] [Google Scholar]
- 8.Ducros V, et al. Methods for homocysteine analysis and biological relevance of the results. J. Chromatogr. B. 2002;781:207–226. doi: 10.1016/s1570-0232(02)00497-x. [DOI] [PubMed] [Google Scholar]
- 9.Lock J, Davis J. The determination of disulphide species within physiological fluids. TrAC. 2002;21(12):807–815. [Google Scholar]
- 10.Paul CW, et al. Electrochemical determination of thiols: A perspective. Electroanalysis. 2002;14:89–98. [Google Scholar]
- 11.Lada MW, Kennedy RT. In vivo monitoring of glutathione and cysteine in rat caudate nucleus using microdialysis online with capillary zone electrophoresis-laser induced fluorescence detection. J. Neurosci. Methods. 1997;72(2):153–159. doi: 10.1016/s0165-0270(96)02174-7. [DOI] [PubMed] [Google Scholar]
- 12.Reyes MG. Ph.D. Thesis. Lawrence, KS: University of Kansas; 1997. Capillary Electrophoresis with Electrochemical Detection for the Determination of Glutathione in Biological Samples. [Google Scholar]
- 13.Bald E, et al. Analysis of plasma thiols by high performance liquid chromatography with ultraviolet detection. J. Chromatogr. A. 2004;1032(1–2):109–115. doi: 10.1016/j.chroma.2003.11.030. [DOI] [PubMed] [Google Scholar]
- 14.Matysik F. End-column electrochemical detection for capillary electrophoresis. Electroanalysis. 2000;12(17):1349–1355. [Google Scholar]
- 15.Osbourn DM, Lunte CE. Cellulose acetate decoupler for on-column electrochemical detection in capillary electrophoresis. Anal. Chem. 2001;73:5961–5964. doi: 10.1021/ac010496i. [DOI] [PMC free article] [PubMed] [Google Scholar]
- 16.Hempel G. Strategies to improve the sensitivity in capillary electrophoresis for the analysis of drugs in biological fluids. Electrophoresis. 2000;21:691–698. doi: 10.1002/(SICI)1522-2683(20000301)21:4<691::AID-ELPS691>3.0.CO;2-U. [DOI] [PubMed] [Google Scholar]
- 17.Beckers JL, Bocek P. Sample stacking in capillary zone electrophoresis: Principles, advantages and limitations. Electrophoresis. 2000;21:2747–2767. doi: 10.1002/1522-2683(20000801)21:14<2747::AID-ELPS2747>3.0.CO;2-Z. [DOI] [PubMed] [Google Scholar]
- 18.Osbourn DM, Weiss DJ, Lunte CE. On-line preconcentration methods for capillary electrophoresis. Electrophoresis. 2000;21:2768–2779. doi: 10.1002/1522-2683(20000801)21:14<2768::AID-ELPS2768>3.0.CO;2-P. [DOI] [PMC free article] [PubMed] [Google Scholar]
- 19.Simonet BM, Valcarcel ARM. Enhancing sensitivity in capillary electrophoresis. TrAC. 2003;22(10):605–614. [Google Scholar]
- 20.Chien RL, Burgi DS. On-column sample concentration using field amplification in CZE. Anal. Chem. 1992;64(8):489A–496A. [Google Scholar]
- 21.Ho Y-H, et al. Field-amplified sample stacking in capillary electrophoresis for the determination of clozapine, clozapine N-oxide, and desmethylclozapine in schizophrenics' plasma. J. Chromatogr. B. 2004;809(1):111–116. doi: 10.1016/j.jchromb.2004.06.011. [DOI] [PubMed] [Google Scholar]
- 22.Chien R-L, Burgi DS. Sample stacking of an extremely large injection volume in high performance capillary electrophoresis. Anal. Chem. 1992;64:1046–1050. [Google Scholar]
- 23.Macia A, et al. Improved sensitivity by large-volume sample stacking using the electroosmotic flow pump to analyze some nonsteroidal anti-inflammtory drugs by capillary electrophoresis in water samples. Electrophoresis. 2003;24(16):2779–2787. doi: 10.1002/elps.200305542. [DOI] [PubMed] [Google Scholar]
- 24.Park S, Lunte CE. On-column sample concentration of high-ionic-strength samples in capillary electrophoresis. J. Microcolumn Sep. 1998;10(6):511–517. [Google Scholar]
- 25.Zhao Y, Lunte CE. pH-mediated field amplified on-column preconcentration of anions in physiological samples for capillary electrophoresis. Anal. Chem. 1999;71(18):3985–3991. doi: 10.1021/ac990242l. [DOI] [PMC free article] [PubMed] [Google Scholar]
- 26.Weiss DJ, Saunders K, Lunte CE. pH-mediated field-amplified sample stacking of pharmaceutical cations in high ionic strength samples. Electrophoresis. 2001;22:59–65. doi: 10.1002/1522-2683(200101)22:1<59::AID-ELPS59>3.0.CO;2-U. [DOI] [PMC free article] [PubMed] [Google Scholar]
- 27.Arnett SD. Investigation of the mechanism of pH mediated stacking of anions for the analysis of physiological samples by capillary electrophoresis. Electrophoresis. 2003;24:1745–1752. doi: 10.1002/elps.200305399. [DOI] [PMC free article] [PubMed] [Google Scholar]
- 28.Krivankova L, Pantuckova P, Bocek P. Isotachophoresis in zone electrophoresis. J. Chromatogr. A. 1999;838:55–70. doi: 10.1016/s0021-9673(99)00114-4. [DOI] [PubMed] [Google Scholar]
- 29.Gebauer P, Bocek P. Recent application and developments of capillary isotachophoresis. Electrophoresis. 1997;18:2154–2161. doi: 10.1002/elps.1150181206. [DOI] [PubMed] [Google Scholar]
- 30.Gebauer P, Bocek P. Recent progress in capillary isotachophoresis. Electrophoresis. 2000;21:3898–3904. doi: 10.1002/1522-2683(200012)21:18<3898::AID-ELPS3898>3.0.CO;2-B. [DOI] [PubMed] [Google Scholar]
- 31.Shihabi ZK. Transient pseudo-isotachophoresis for sample concentration in capillary electrophoresis. Anal. Chem. 2002;23:1612–1617. doi: 10.1002/1522-2683(200206)23:11<1612::AID-ELPS1612>3.0.CO;2-3. [DOI] [PubMed] [Google Scholar]
- 32.Kong Y, et al. Optimization stacking by transient pseudo-isotachophoresis for capillary electrophoresis. J. Chromatogr. B. 2003;(795):9–15. doi: 10.1016/s1570-0232(03)00475-6. [DOI] [PubMed] [Google Scholar]
- 33.Britz-McKibbin P, Chen DDY. Selective focusing of catecholamines and weakly acidic compounds by capillary electrophoresis using a dynamic pH junction. Anal. Chem. 2000;72(6):1242–1252. doi: 10.1021/ac990898e. [DOI] [PubMed] [Google Scholar]
- 34.Britz-McKibbin P, Bebault GM, Chen DDY. Velocity-difference induced focusing of nucleotides in capillary electrophoresis with a dynamic pH junction. Anal. Chem. 2000;72(8):1729–1735. doi: 10.1021/ac991104z. [DOI] [PubMed] [Google Scholar]
- 35.Song Y, Lunte CE. Comparison of calibration by delivery versus no net flux for quantitative in vivo microdialysis sampling. Anal. Chem. Acta. 1999;379:252–262. [Google Scholar]
- 36.O'Shea TJ, Lunte SM. Selective detection of free thiols by capillary electrophoresis-electrochemistry using a gold/mercury amalgam microelectrode. Anal. Chem. 1993;65:247–250. [Google Scholar]
- 37.Rabenstein DL, Saetre R. Analysis for glutathione in blood by high performance liquid chromatography. Clin. Chem. 1978;24(7):1140–1143. [PubMed] [Google Scholar]
- 38.Watzig H, Degenhardt M, Kunkel A. Strategies for capillary electrophoresis: Method development and validation for pharmaceutical and biological application. Electrophoresis. 1998;19:2695–2752. doi: 10.1002/elps.1150191603. [DOI] [PubMed] [Google Scholar]
- 39.Yang CS, et al. Determination of extracellular glutathione in livers of anaesthetized rats by microdialysis with on-line high performance liquid chromatography. J. Chromatogr. B. 1995;667:41–48. doi: 10.1016/0378-4347(94)00590-2. [DOI] [PubMed] [Google Scholar]


