

Abstract
The combined influence of primary-level differences (L1-L2) and primary-frequency ratio (f2/f1) on distortion product otoacoustic emission (DPOAE) level was investigated in 20 normal-hearing subjects. DPOAEs were recorded with continuously varying stimulus levels for the following stimulus conditions: f2 = 1, 2, 4, and 8 kHz and f2/f1 = 1.05 to 1.4; various L1-L2, including one individually optimized to produce the largest DPOAE. For broadly spaced primary frequencies at low L2 levels, the largest DPOAEs were recorded when L1 was much higher than L2, with L1 remaining relatively constant as L2 increased. As f2/f1 decreased, the largest DPOAEs were observed when L1 was closer to L2 and increased as L2 increased. Optimal values for L1-L2 and f2/f1 were derived from these data. In general, average DPOAE levels for the new L1-L2 and f2/f1 were equivalent to or larger than those observed for other stimulus combinations, including the L1-L2 described by Kummer et al. (1998) and those defined by Neely et al. (2005) in which L1-L2 was evaluated, but f2/f1 was fixed at 1.2.
I. INTRODUCTION
Distortion product otoacoustic emissions (DPOAEs) have been used to assess normal and impaired cochlear function in humans (e.g., Stover et al., 1996; Janssen et al., 1998; Kummer et al., 1998; Abdala 2000, 2003; Dorn et al., 2001; Gorga et al., 1993, 2002, 2003; Abdala and Fitzgerald, 2003; Neely et al., 2003) and are commonly used as a clinical tool for the objective prediction of auditory status (e.g., Gorga et al., 1997; Norton et al., 2000). The level of the DPOAE recorded in the ear canal depends on the frequency and level characteristics of the stimuli used to elicit the DPOAE. The choice of stimulus parameters, therefore, may influence the success with which DPOAEs can be used to assess cochlear function and predict auditory status. It may be more important to focus on maximizing DPOAE level rather than other DPOAE measures such as signal-to-noise ratio (SNR) on the assumption that DPOAE level is correlated with cochlear function. Additionally, while DPOAE phase may be important for basic research applications (e.g., Shera and Guinan, 1999), current clinical applications of DPOAE measures depend on DPOAE level (or SNR), but largely ignore phase measurements.
A number of previous investigations have examined the influence of stimulus parameters on the DPOAE (e.g., Harris et al., 1989; Brown and Gaskill, 1990; Gaskill and Brown, 1990; Hauser and Probst, 1991; Whitehead et al., 1995a, c) resulting in recommendations for stimulus conditions likely to yield robust emissions in human ears. A constant level relation of L1-L2 = 10 or 15 dB has been used in some cases (Gorga et al., 1993; 1997), although recent work reported by Kummer et al. (1998) suggests that setting L1 = 0.4 · L2 + 39 results in the largest DPOAE level at each L2, independent of frequency (Kummer et al., 2000). A primary-frequency ratio of 1.22 has been recommended as optimal (Harris et al., 1989; Gaskill and Brown, 1990; Brown et al., 1994), although variability in the frequency ratio producing the largest DPOAE across stimulus frequency has been reported (Harris et al., 1989).
The majority of previous parametric investigations of the DPOAE stimulus space, especially those involving humans, have focused on a restricted region of the level and/or frequency space. Although Mills (2002) described a comprehensive investigation of the four-dimensional stimulus space in gerbil, similar investigations have not been completed in humans. This is due, in part, to the time involved in recording DPOAEs in response to a large number of stimulus combinations.
Neely et al. (2005) described a novel method of recording DPOAE responses using continuously varying stimulus levels, which was validated by comparing results with it to more traditional measurements in which L1 and L2 were set to discrete values. Using this new method, Neely et al. were able to more fully explore the two-dimensional L1, L2 space in a group of normal-hearing subjects and were able to determine an individually optimized primary-level difference (L1-L2). Larger DPOAE levels were recorded when the individually optimized L1-L2 was used, as compared to DPOAE levels obtained with the relation recommended by Kummer et al. (1998). Furthermore, in contrast to the findings reported by Kummer et al. (2000), where the optimal L1-L2 was found to be independent of f2, Neely et al. found a systematic effect of f2 on the optimal L1-L2. Specifically, the optimal L1-L2 for low-level stimuli increased with f2. When f2 = 8 kHz, the optimal L1-L2 resulted in DPOAE levels that were approximately 10-dB higher than those observed with the approach to setting stimulus level recommended by Kummer et al. (1998). These differences decreased as f2 decreased and, on average, were only 2 dB when f2 = 1 kHz.
Although the reason for the discrepancy between the Neely et al. (2005) results and the results reported by Kummer et al. (1998, 2000) is not clear (it may be due, in part, to differences in recording paradigms), a question arising from the Neely et al. data is whether the variation in optimal L1-L2 with f2 can be attributed to differences in cochlear frequency selectivity along the length of the basilar membrane. Direct observation of basilar-membrane motion in lower animals suggests that the spatial distribution of excitation patterns is more localized at the base of the cochlea than at the apex (e.g., Robles and Ruggero, 2001). The observation in Neely et al. (2005) that the L1-L2 for maximum DPOAE level is larger for f2 = 8 kHz than for f2 = 1 kHz is consistent with the idea that excitation patterns for the eliciting stimuli (i.e., the two primaries) are more spatially separated when f2 = 8 kHz than when f2 = 1 kHz, requiring an increase in the level of f1 in order to generate “optimized” overlap at the f2 place.
The purpose of the present study was to provide a more complete investigation of the stimulus parametric space in humans and to further investigate the trends observed by Neely et al. (2005). We hypothesized that differences in frequency resolution as a function of f2 might underlie the effect of f2 on the primary-level difference producing the largest DPOAE. Stated another way, more sharply defined representation of high-frequency primaries at the cochlear base might result in less effective overlap between f2 and f1, requiring an increase in L1 relative to L2 in order to maximize the interaction between primaries and the generation of distortion. In contrast, broader cochlear representation for lower frequencies might result in greater overlap (for the same f2/f1); under these conditions, maximum distortion might be produced when there was less difference between L1 and L2, compared to high-frequency conditions. Furthermore, we predicted that, for any stimulus frequency, a broader cochlear representation would occur as level increased; thus, we hypothesized that an interaction might occur among f2/f1, L1 - L2, and L2. A related goal was to determine the stimulus parameters producing the largest DPOAE levels in a group of normal-hearing subjects, with the expectation that those conditions might have use in the clinical application of DPOAEs.
II. METHODS
A. Subjects
Twenty normal-hearing subjects participated in this project. Normal hearing was defined as thresholds ≤ 10 dB HL (ANSI, 1996) for the octave frequencies from 0.25 through 8 kHz. Normal 226-Hz tympanograms were required just prior to each session in which DPOAE data were collected.
B. Procedures
All DPOAE data were collected using custom-designed software (SYSRES, Neely and Stevenson, 2002) that controlled a 24-bit soundcard (CardDeluxe, Digital Audio Labs) housed in a PC. An ER-10C probe-microphone system was used to present stimuli and record DPOAE responses. Stimuli were calibrated in-situ in sound pressure level at the plane of the probe. While concerns exist for pressure calibrations in the ear canal (Siegel, 1994; Siegel and Hirohata, 1994; Neely and Gorga, 1998), those same concerns apply for other approaches to selecting stimulus conditions for DPOAE measurements. In-situ pressure calibration represents one of the sources of variability in our DPOAE measurements. The variability associated with in-situ pressure calibration is acknowledged and accepted as inherent in current standard calibration methods. This variability is addressed in our study by including subjects (N = 20) with a range of different ear canal dimensions.
DPOAEs were recorded in response to pairs of primary tones (f1, f2) whose levels (L1, L2) varied continuously. The frequency of f2 varied in octave steps from 1 to 8 kHz. Responses for a total of 8 primary-frequency ratios (f2/f1), ranging from 1.05 to 1.40 in steps of 0.05, were recorded for each subject. The continuous-level method has been described previously (Neely et al., 2005). Briefly, the levels of f1 and f2 are continuously amplitude modulated in dB. The DPOAE level is extracted using a frequency-domain, heterodyne technique (Kim et al., 2001). As in our previous work with the continuous-level method (e.g., Neely et al., 2005), DPOAE responses were recorded using two different stimulus paths, a Lissajous path and a linear path, each of which is described below.
In the Lissajous-path condition, the levels of the primary stimuli were continuously amplitude modulated over a 33-s time course, which was repeated. L2 ranged from 17 to 69 dB SPL and L1 ranged from 43 to 76 dB SPL. In each half of the 66-s stimulus buffer, 23 cycles of L1 modulation and 17 cycles of L2 modulation were presented. Stimulus and DPOAE levels were determined by summing the two halves of the buffer. Noise levels (at the 2f1-f2 frequency) were determined by subtracting the halves. These stimulus conditions allowed us to rapidly record DPOAE responses for stimulus conditions representing a broad L1, L2 space. The rapid collection of data for the Lissajous-path stimulus results in a smoothing of the DPOAE response levels. As a consequence, the DPOAE levels obtained with this stimulus can be compared in relative terms across L1, L2 combinations; however, as will be seen below, DPOAE levels obtained with this stimulus cannot be compared to those obtained with more traditional stimulus and recording parameters. The reader is referred to Neely et al. (2005) for more information regarding the Lissajous-path stimuli.
The responses to the Lissajous-path stimuli were used to determine the optimal, linear L1, L2 relationship for each subject and each f2/f1 combination (as described below). The DPOAE levels recorded for the Lissajous-path stimuli also were used to compare the responses obtained for a variety of linear L1, L2 paths, including the frequency-independent relation recommended by Kummer et al. (1998) and the frequency-dependent paths described in Neely et al. (2005).
Each individual’s optimal path was determined from the response to Lissajous-path stimuli by identifying the L1 producing the largest DPOAE for each L2. A linear function was fit to the subset of these L1, L2 values producing responses with a signal-to-noise ratio (SNR) ≥ 12 dB. Pilot data suggested that a 12-dB SNR represented a reasonable compromise between the need to fit a function over a range of L2 levels and the desire to minimize the influence of noise on the line fits. The resulting equation describes the optimal, linear path through L1, L2 space. This procedure was repeated for each f2 and f2/f1 combination, resulting in a total of 32 optimal linear paths for each subject (4 f2 × 8 f2/f1).
For each subject, DPOAE I/O functions were recorded along these 32 optimal linear L1, L2 paths. The optimal linear-path I/O functions were recorded using continuously varying stimulus levels, in a manner similar to that used to record responses to the Lissajous-path stimuli. However, these I/O functions were obtained with more slowly varying stimulus levels such that only one cycle of L1 and L2 modulation was presented in each half of the 66-s stimulus buffer. As for the Lissajous-path stimuli, the stimulus and DPOAE levels were obtained by summing the two halves of the buffer and the noise was obtained from the difference. L2 varied continuously from -20 to 80 dB SPL and L1 varied according to each individual’s optimal linear path. For certain conditions (typically the smallest and largest frequency ratios) in several subjects, we were unable to determine an optimal L1, L2 relationship because the DPOAE levels were too small to fit a valid linear function to the Lissajous-path responses (i.e., points with ≥ -12 dB SNR extended over less than a 10-dB L2 range). For these conditions in these subjects, the optimal linear L1, L2 path condition was not tested.
All data were collected in a sound-treated room. During data collection, subjects relaxed or slept in a reclining chair. They were asked to remain quiet throughout the test session and breaks were provided as needed. These data were typically collected in three test sessions, with each session lasting two hours.
III. RESULTS
A. Responses to Lissajous-path stimuli
DPOAE levels in L1, L2 stimulus space for each f2 and f2/f1 are shown as contour plots in Fig. 1. These data represent the DPOAE levels obtained for the Lissajous-path stimuli averaged across all 20 subjects. Each column represents data for a different f2, from f2 = 1 kHz (left column) to f2 = 8 kHz (right column). Each row represents data for a different f2/f1, with f2/f1 = 1.40 in the top row, decreasing to f2/f1 = 1.05 in the bottom row. The contours are spaced in 2-dB increments of DPOAE level, with the maximum DPOAE level represented by the contours in the upper right portion of each panel. As a reference, the contours corresponding to a DPOAE level of -6 dB SPL (a level that exists in all but three panels) are indicated with a thicker line than the other contours. There is no reference line for the conditions where f2 = 8 kHz and f2/f1 = 1.40, 1.35, or 1.05. Here, the maximum DPOAE level was -8 dB SPL. Also shown as solid sloping lines in each panel are the average optimal linear L1, L2 stimulus paths obtained by averaging the coefficients for each subject’s optimal path for each f2 and f2/f1 combination. The length of the average optimal-path line in each panel indicates the L2 range over which the SNR was ≥ 12 dB, the minimum SNR requirement for points included in our optimal-line fit. For certain conditions, typically the largest and smallest frequency ratios, the average optimal-path line includes data from less than 20 subjects because not every subject produced DPOAEs with SNRs exceeding 12 dB.
Figure 1.

Contour plots representing DPOAE level in L1, L2 stimulus space. Each column represents data for a different f2 and each row represents a different f2/f1, as indicated on the figure. The contours are spaced in 2-dB increments of DPOAE level. As a reference, the contour corresponding to -6 dB SPL is indicated with a thicker line. The maximum DPOAE level in panels without a reference (f2 = 8 kHz, f2/f1 = 1.40, 1.35, 1.05) is -8 dB SPL. The slanting, straight lines in each panel describe the L1, L2 relationship producing the largest DPOAE level at each L2. Our approach for fitting this line is described in the text.
In general, the slope of the optimal path becomes steeper as the primaries are more closely spaced at each f2. When the primaries are broadly spaced (f2/f1 = 1.35 or 1.40), the largest DPOAE levels were obtained when L1 was much bigger than L2 at low levels of L2 and increased slowly as L2 increased. For more closely spaced primaries, the largest DPOAE levels were obtained when L1 was more similar in level to L2 and increased more rapidly with L2.
The slope of the optimal path and its relation to f2/f1 and f2 is summarized in Fig. 2. Here, the slope of the average optimal path is plotted as a function of f2/f1 with f2 as the parameter. As shown in Fig. 1, the slope of the average optimal path decreases as f2/f1 increases at each f2. This change in slope is consistent with expected changes in relative response growth at the f2 place as the spacing between the two primaries increases. Additionally, for frequency ratios greater than 1.15, the slope of the optimal path tends to decrease as f2 increases from 1 to 8 kHz, suggesting that, for a given frequency ratio, the overlap between the primaries at the f2 place decreases as f2 increases.
Figure 2.

The slope of the average, optimal path as a function of f2/f1. The parameter is f2.
B. Responses to linear-path stimuli
DPOAE I/O functions, averaged across subjects, are shown in Fig. 3. Each panel represents data for a different f2 with f2/f1 as the parameter. These data were obtained with L1 set according to each subject’s optimal path for each f2/f1 at each f2. Data were included in Fig. 3 only for those conditions on the averaged I/O function where the SNR was ≥ 6 dB. This SNR criterion was invoked in this and subsequent figures (Figs 4-6), in order to plot only those points that were reliably measured with minimal influence from noise. The solid, thick line represents the I/O function for f2/f1 = 1.20. The longer dashed lines are for f2/f1 < 1.20 and the shorter dashes are for f2/f1 > 1.20. The thickness of the dashed lines indicates the distance the frequency ratio is from 1.20, with the dashed lines becoming progressively thinner as f2/f1 approaches either 1.05 or 1.40. The thinnest lines are for frequency ratios of 1.05 and 1.40. For f2 = 4 and 8 kHz, the maximum DPOAE level for essentially all L2 was achieved when f2/f1 = 1.20. Both increases and decreases in f2/f1 resulted in reductions in DPOAE level relative to the levels observed when f2/f1 = 1.20. However, for f2 = 1 and 2 kHz, there was an interaction between optimal f2/f1 and L2. For L2 < 40 dB SPL, maximum DPOAE level occurred when f2/f1 = 1.20; for L2 > 40 dB SPL, frequency ratios greater than 1.20 resulted in an increase in DPOAE level, achieving a maximum increase of approximately 5 dB.
Figure 3.
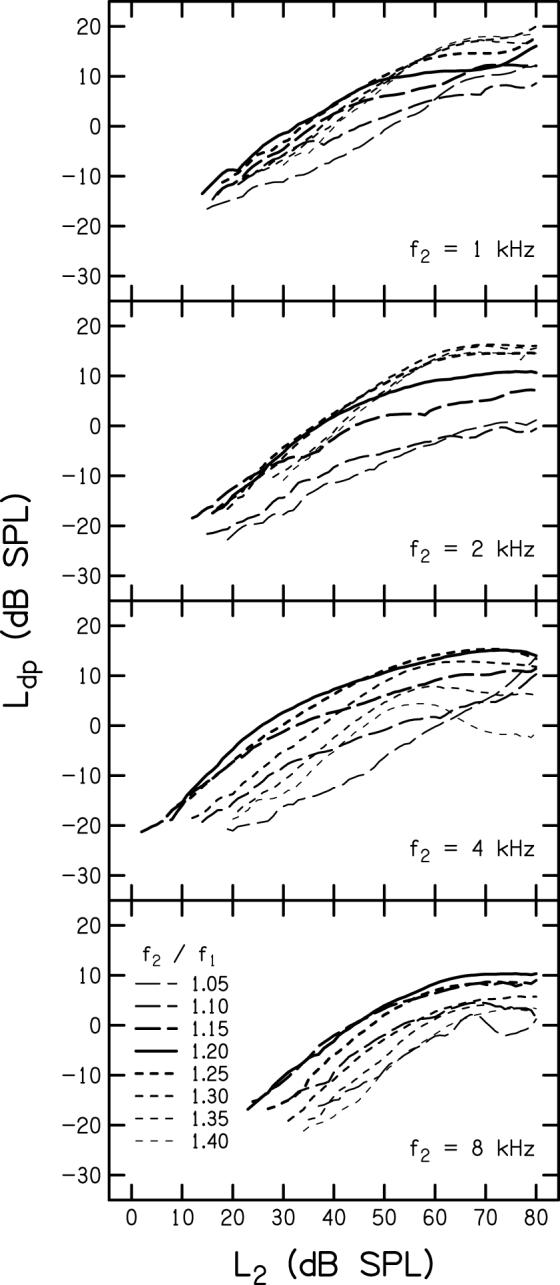
DPOAE level (Ldp) is plotted as a function of L2 with primary-frequency ratio as a parameter. Each panel represents a different f2, as indicated. The solid line in each panel represents DPOAE level for f2/f1 = 1.20. Shorter dashes correspond to f2/f1 > 1.20 and longer dashes correspond to f2/f1 < 1.20. The line thickness represents the distance the frequency ratio is from 1.20, with f2/f1 = 1.05 and 1.40 indicated by the thinnest dashed lines.
Figure 4.

Mean DPOAE level (Ldp) as a function of frequency ratio. Each panel represents data for a different f2. Here, the parameter is L2, with decreasing line thickness indicating increasing L2 in 10-dB increments of L2. When f2 = 8 kHz, data for L2 = 30 to 80 dB SPL are plotted, for all other f2 frequencies data are plotted for L2 ranging from 20 to 80 dB SPL.
Figure 6.

Our approach to specifying optimal stimulus parameters. The upper panel plots L1 as a function of L2 while the lower panel plots f2/f1 as a function of L2. The parameter is f2, as indicated within the upper panel. The symbols shown in each panel correspond to the L1 (upper panel) or f2/f1 (lower panel) producing the largest DPOAE at each L2. The lines in each panel represent the best fit to the stimulus conditions producing the maximum DPOAE according to the approach described in the text. The equations describing these lines are shown as an inset in each panel.
An alternative view of the effect of frequency ratio as stimulus level is varied is shown in Fig. 4. Here, the DPOAE I/O functions shown in Fig. 3 are replotted as DPOAE-level versus f2/f1 functions with L2 as the parameter. Plots like these have sometimes been referred to as DPOAE frequency or filter functions (e.g., Stover et al., 1999). Each panel represents data for a different f2, with line thickness decreasing as L2 increases. As in Fig. 3, only points where the SNR was 6 dB or greater are plotted. The lines are shown for 10-dB increments of L2. For f2 = 1, 2, and 4 kHz, L2 ranges from 20 to 80 dB SPL. L2 ranges from 30 to 80 dB SPL for f2 = 8 kHz, a consequence of the reduced range over which reliable measurements were possible at this f2. For f2 = 8 kHz, f2/f1 = 1.20 resulted in the maximum DPOAE levels for all L2’s except 40 dB SPL. For all other f2 frequencies, the f2/f1 producing the largest DPOAE increased with L2. These data suggest that it is possible to obtain larger DPOAE levels if f2/f1 is varied with L2, in addition to varying L1 (e.g., Kummer et al., 1998; Neely et al., 2005), although the size of the effect is small, compared to the influence of L1 variation.
Data describing the inter-subject variability in DPOAE level are plotted in Fig. 5. Here, a portion of the data shown in Fig. 4 (f2 = 4 kHz, L2 = 20, 50, and 80 dB SPL) have been replotted with the addition of error bars representing ± 1 standard deviation. In general, the variability across subjects is less for the high-level stimuli (L2 = 50 and 80 dB SPL) and for frequency ratios between 1.15 and 1.30. Standard deviations for other stimulus conditions (i.e., the complete set of f2 and L2 shown in Fig. 4) are comparable to those shown in Fig. 5, suggesting similar inter-subject variability across stimulus condition.
Figure 5.

Mean DPOAE level (Ldp) as a function of frequency ratio when f2 = 4 kHz and L2 = 20, 50, and 80 dB SPL (indicated with decreasing line thickness). Errors bars represent ± 1 standard deviation.
C. Optimal stimulus parameters
Figure 6 summarizes our approach for specifying stimulus conditions that (on average) elicit larger DPOAE levels than those obtained when only L1-L2 is varied. The upper panel plots L1 as a function of L2, while the lower panel plots f2/f1 as a function of L2. The parameter in each panel is f2, shown with different symbols as indicated in the upper panel. Data points are plotted at values that represent the maximum responses to the Lissajous-path stimuli shown in Fig. 1. As in previous figures, data are included only if the SNR ≥ 6 dB. The values of L1 and f2/f1 at which each symbol in Fig. 6 is plotted can be viewed as the stimulus conditions resulting in the maximum average DPOAE level for each L2 and f2. However, using the stimulus conditions described by the individual data points limits the degree to which these data can be used to generalize to stimulus conditions for f2 frequencies other than those tested in this study. Therefore, equations describing the relations among stimulus parameters were developed.
In specifying the form of these equations, emphasis was placed on developing as simple a model as possible that also provided a reasonable fit to the data. Changes in f2/f1 with L2 and f2 were motivated by data shown in Fig. 4, where larger frequency ratios produced bigger DPOAE levels as either f2 decreased or L2 increased. An additional constraint on the model was that the relationship between L1 and L2 be described by a straight line in the same manner as previous descriptions of the relationship between L1 and L2 (e.g., Kummer et al., 1998, 2000; Neely et al., 2005). For a particular f2 and L2 combination, L1 is set according to:
Likewise, f2/f1 is set according to:
The equation parameters were determined first by constraining L1 = 80 dB SPL when L2 = 80 dB SPL. The 5 additional parameters (a-e) were determined by minimizing the sum of the squared deviations between the DPOAE levels obtained with freely varying stimulus parameters (which we refer to as Ldmax) and the DPOAE levels obtained for stimulus parameters specified by the equations shown in each panel (which we refer to as Ldpar). The final parameter values are shown in the equations plotted on Fig. 6. These parameters represent the values resulting in the smallest squared deviation between Ldmax and Ldpar. Functions derived from these equations are shown as solid (1 kHz) and dashed (2, 4, 8 kHz) lines in the figure, the shorter the dash, the higher the f2.
In Fig. 6, the fit between the solid/dashed lines and the individual data points suggests that the stimulus parameters recommended by these two equations deviate from the stimulus parameters associated with Ldmax, and that perhaps these equations do not provide a good representation of the stimulus conditions producing the largest DPOAEs. However, the method by which we determined the equation parameters placed an emphasis on equating DPOAE levels for Ldmax and Ldpar rather than fitting the freely varying stimulus parameters. The extent to which Ldmax and Ldpar differ is shown in Fig. 7, which, in the final analysis, probably represents a better test of the appropriateness of using these equations to select stimulus conditions that optimize response level.
Figure 7.

DPOAE level (Ldp) as a function of L2. Each panel represents a different f2. The parameter is the stimulus condition used to record the DPOAE, as indicated in the legend. The nearly horizontal lines near the bottom of each panel represent the corresponding noise levels.
DPOAE I/O functions for Ldmax and Ldpar are plotted in Fig. 7, along with I/O functions using the L1, L2 relations described by Kummer et al. (1998) and Neely et al. (2005). For these latter two functions, the frequency ratio is fixed at 1.20, which is the frequency ratio used in the two previous studies. The horizontal lines between -10 and -20 dB SPL represent the noise level. Again, only points with SNR ≥ 6 dB are shown. Data obtained with the Kummer et al. stimulus conditions are shown as solid lines. The corresponding response levels for the Neely et al. stimulus conditions are shown as the longest dashed lines. The DPOAE levels for the Ldmax condition are represented by the shortest dash and the DPOAE levels for the Ldpar condition are shown as dashed lines intermediate in length to those used for Ldmax and those used to depict the DPOAE levels for the Neely et al. stimulus conditions. For all conditions, the DPOAE and noise levels were taken from the response to the Lissajous-path stimuli. Recall that because these data were collected rapidly with associated smoothing of the response, the DPOAE levels are not directly comparable to levels obtained with more traditional stimulus and response conditions. Therefore, the I/O functions shown in Fig. 7 should be evaluated in relative terms and not in relation to those shown in Fig. 3 or elsewhere in the DPOAE literature.
If we use the Kummer et al. levels as the reference point (measured under conditions in which both f2/f1 and L1-L2 were independent of f2), the other I/O functions describe the extent to which it is possible to increase the DPOAE level by adjusting only the L1-L2 (Neely et al.) or by varying both L1-L2 and f2/f1 (Ldmax, Ldpar) as a function of f2. In general, the DPOAE levels for the Kummer et al. condition are equivalent to or less than those recorded for any of the other three conditions. For f2 = 8 kHz, Neely et al., Ldpar, and Ldmax all produce equivalent DPOAE levels, which might be expected given the similarity in stimulus conditions for Neely et al., Ldpar, and Ldmax. This observation also provides further validation of the results observed in Neely et al. (2005) regarding the optimal relationship between L1 and L2 when f2 = 8 kHz. As f2 decreases from 4 to 1 kHz, Ldpar and Ldmax produce increasingly larger DPOAE levels relative to Neely et al. While the stimulus conditions for Ldmax (as expected) always produce responses that are equal to or greater than those produced by the stimulus conditions for Ldpar, the differences seldom exceed a few dB. When f2 = 4 kHz and L2 < 40 dB HL, DPOAE levels associated with Ldpar are less than those associated with the other three sets of stimulus conditions, suggesting that Ldpar may not be a good choice for specifying stimulus conditions for this f2 and L2. This observation also suggests that it might be possible to improve our approach to specifying stimulus parameters for Ldpar. However, even with the Ldpar stimulus conditions at f2 = 4 kHz, DPOAEs were recorded with a positive SNR for L2 = 17 dB SPL. Furthermore, for all other combinations of f2 and L2, the response levels for Ldpar exceeded the levels achieved with the approach recommended by Kummer et al. (1998), were equal to or greater than the levels achieved by Neely et al. (2005), and were only slightly less than the maximum levels achieved by freely varying stimulus conditions (Ldmax). We, therefore, view the stimulus conditions associated with Ldpar as representing an acceptable compromise between achieving the maximum possible DPOAE levels (Ldmax) and specifying a simple stimulus model that can be generalized to other f2 frequencies.
When f2 = 2 kHz, the noise levels associated with Ldmax and Ldpar increase as stimulus levels increase, which can be attributed to changes in DPOAE frequency with changes in f2/f1. As f2/f1 increases, the frequency at which the DPOAE is measured decreases. When f2 = 1 and 2 kHz, frequency ratios exceeding 1.25 are recommended for the highest stimulus levels. For these conditions, the DPOAE was recorded at lower frequencies (because 2f1-f2 decreases as f2/f1 increases). Noise levels increase as 2f1-f2 decreases (Gorga et al., 1993), which occurs when either f2 decreases or f2/f1 increases. At 2 kHz, the shift in the DPOAE frequency appears to be associated with larger increases in noise level than for other f2 frequencies.
Data in support of this interpretation are shown in Fig.8, where the noise level averaged across the entire DPOAE I/O function is plotted as a function of frequency ratio. Each panel represents data for a different f2 with the noise levels for each primary-level path as the parameter. The triangles represent the noise levels when the Kummer et al. (1998) primary-level relation is used at each frequency ratio (recall that this level ratio is the same for all f2 frequencies). The circles represent the corresponding noise levels when the Neely et al. (2005) primary-level relations are used; in this case, a different primary-level relation is specified at each f2, but the same level relation is used for each frequency ratio within an f2. Finally, the squares represent the case when the average optimal paths are used to specify the L1, L2 relationship. These paths correspond to the average optimal paths plotted on the contour plots in Fig. 1; in this case, a different primary-level relation is used at each f2 and f2/f1.
Figure 8.
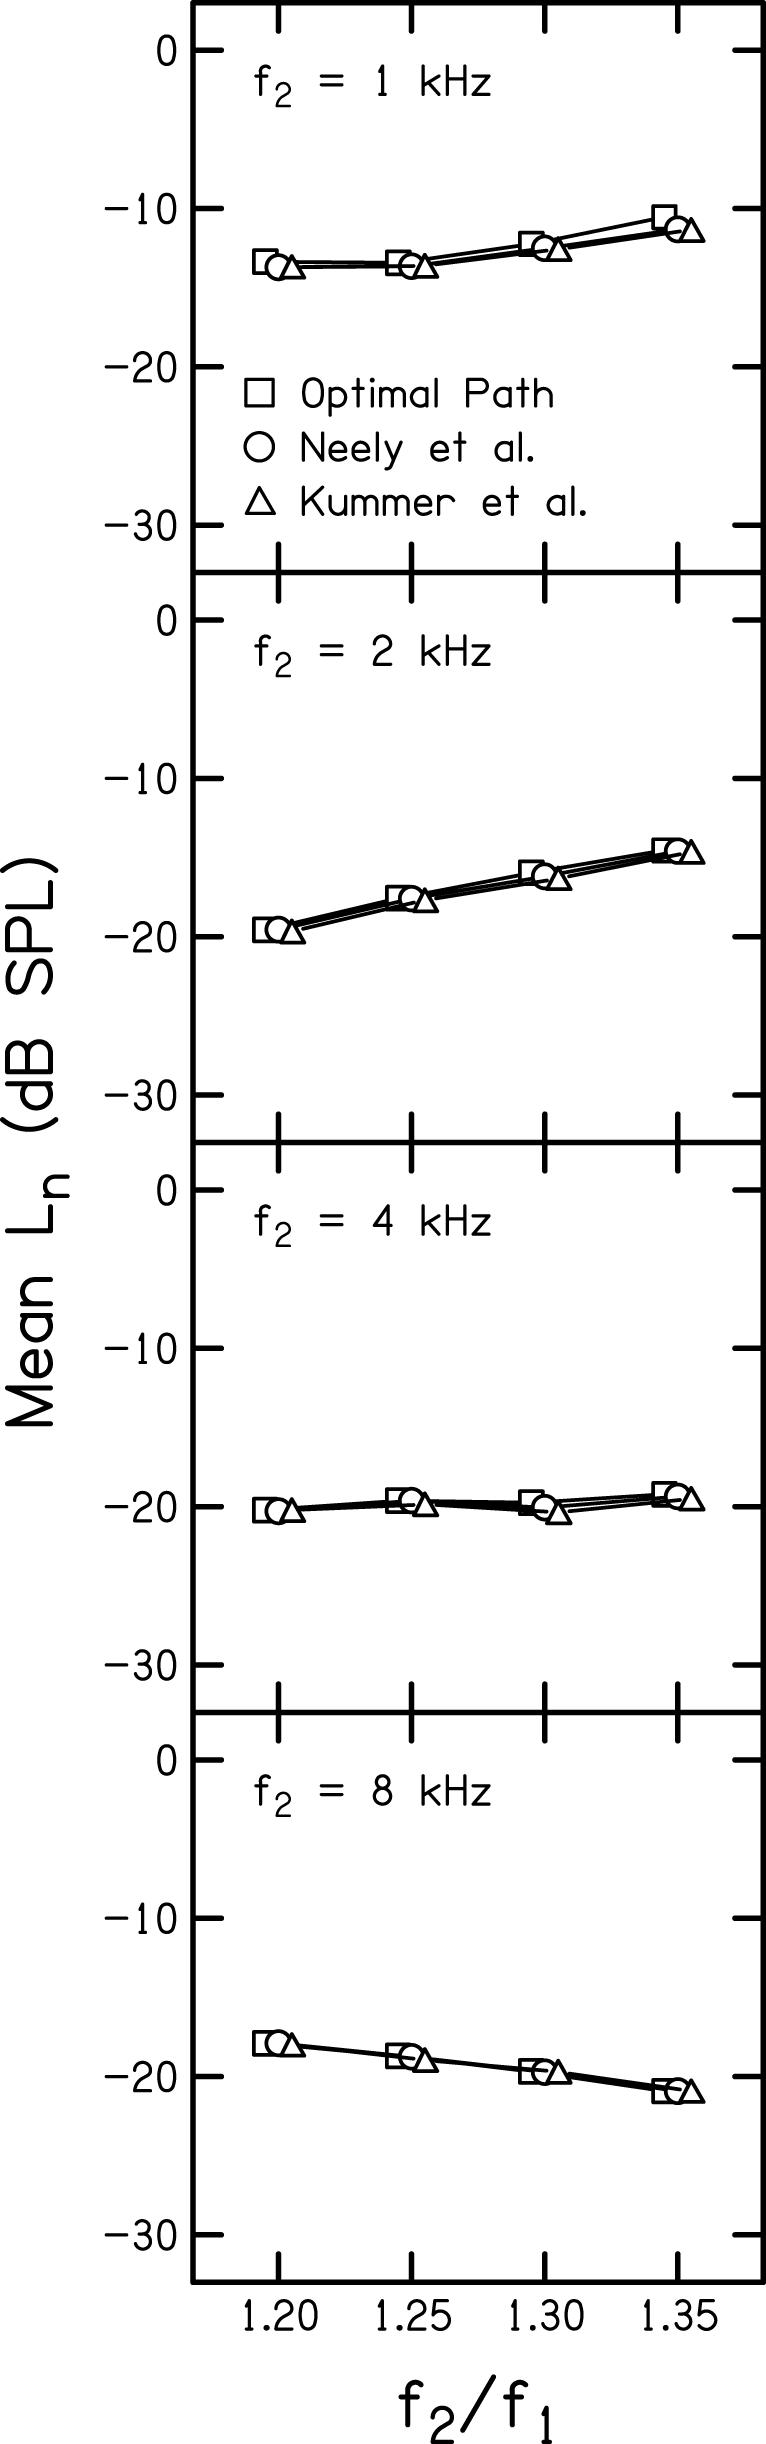
DPOAE noise levels (Ln) as a function of frequency ratio with each panel corresponding to a different f2. Each symbol corresponds to a different L1, L2 path as indicated in the legend.
As expected, there is a tendency for overall noise levels to increase as f2 decreases (going from bottom to top in Fig. 8). Within each panel, the primary determining factor for noise level is the frequency ratio; within a given frequency ratio, there is no difference in noise level across the three primary-level paths. For f2 = 1 and 2 kHz, the noise level increases as frequency ratio increases. When f2 = 4 kHz, the noise level remains relatively constant across frequency ratio. For f2 = 8 kHz, the noise level decreases by 2 - 3 dB between f2/f1 = 1.20 and f2/f1 = 1.35. The decrease in noise level with increases in f2/f1 for f2 = 8 kHz was unexpected given previous observations (e.g., Gorga et al., 1993), and the mechanism responsible for this change at 8 kHz is unclear. For f2 = 2 kHz, the increase is approximately 5 dB, which is a larger effect than was observed for the other frequencies.
IV. DISCUSSION
The results described above summarize a broad exploration of the DPOAE parametric space in humans. These results suggest that it is possible to record larger DPOAE levels in normal-hearing human ears if the L1, L2 and f2/f1 relations are allowed to vary with both L2 and f2. Extensive parametric investigations for individual subjects are impractical due to the significant time involved in collecting these data. However, we have described an approach to specifying optimal stimulus conditions that are expected, on average, to result in larger DPOAE levels in normal-hearing human subjects.
A. Frequency dependence of average, optimal L1, L2 difference
The data displayed in Figs. 1 and 2 demonstrate systematic variations in the average optimal L1, L2 stimulus path as both f2 and f2/f1 are varied. Two trends are apparent in these data. First, across f2, the slope of the optimal path decreases with increasing frequency ratio (which corresponds to broader frequency spacing of the primaries). Second, within a given frequency ratio, there is a trend for the optimal-path slope to increase with decreasing f2. These results suggest that if we increase the separation of the two primaries in the cochlea either by presenting high-frequency stimuli, for which we presume there is sharper frequency resolution, or by increasing the frequency ratio, an increase in L1 is necessary to produce “optimal” overlap of the primaries at the f2 place. The shallower optimal-path slope and higher intercept represent this compensation. The higher intercept is a result of the increase in L1 for low-level stimuli, which is necessary because of the increased separation in the cochlear representation of the primaries for large frequency ratios or high f2 frequencies. The shallow slope reflects a subsequent slow change in L1 as L2 increases.
The shallower optimal-path slope for broadly spaced primaries is also consistent with expected changes in growth of response to f1 at the f2 place. In the generation of DPOAEs, the primary nonlinear interaction is believed to occur near the f2 place (e.g., Brown and Kemp, 1984; Harris et al., 1992). Response growth for the f2 primary is, therefore, expected to be nonlinear. As the frequency ratio is increased, a larger L1 would be needed for low levels of L2 and response growth for the f1 primary at the f2 place would be expected to become increasingly more linear. This linearizing of the f1 response at the f2 place results in relatively little change in L1 for relatively large changes in L2. Stated another way, as frequency ratio increases, the response to the f1 primary grows increasingly more rapidly than the response to the f2 primary at the f2 place. This results in a smaller increase in f1 relative to f2 for the same relative representation at the f2 place. This interpretation is consistent with arguments made in the psychoacoustics literature to explain differences in growth of masking for on- versus off-frequency maskers (e.g., Stelmachowicz et al., 1987; Oxenham and Plack, 1997) and in the DPOAE suppression literature to explain differences in growth of suppression for on- versus off-frequency suppressors (e.g., Gorga et al., 2002).
Changes in the optimal-path slope across f2 also are consistent with expected variations in frequency resolution and cochlear nonlinearity as a function of frequency. Direct observation of basilar-membrane motion in lower animals suggests broader tuning at the cochlear apex as compared to its base (e.g., Cooper and Rhode, 1997; reviewed in Robles and Ruggero, 2001). While the extent to which cochlear nonlinearity differs between the base and the apex remains controversial (contrast, for example, the behavioral data of Oxenham and Plack, 2000 with behavioral data of Plack and Drga, 2003), more recent evidence points to similar cochlear nonlinearity at both the base and apex (e.g., Nelson and Schroder, 2004; Oxenham & Dau, 2004). Additionally, data from the chinchilla suggest nonlinear responses at the apex, but also suggest that they are more distributed and less sharply tuned than those observed at the base (Cooper and Rhode, 1997). In the present data, the lowest f2 frequency for which measurements were made was 1 kHz, so these data do not represent responses from extreme apical regions of the cochlea. However, the observation of consistently steeper optimal L1, L2 relationships for f2 = 1 kHz as compared to f2 = 8 kHz, suggest more similar growth of response for the f1 primary at the f2 place when f2 = 1 kHz than when f2 = 8 kHz. This would be expected if there were more broadly tuned responses with more distributed nonlinearity in the more apical regions of the cochlea.
B. Interactions between primary-level ratios and primary-frequency ratios
As discussed above, one hypothesis at the outset of this investigation was that differences in frequency resolution along the length of the cochlea might underlie the frequency dependence of the optimal L1-L2 observed in Neely et al. (2005). If this hypothesis was true, the optimal L1-L2 for each f2 might be more similar if the frequency ratio were adjusted to maintain more consistent overlap at the f2 place. The present results suggest that our hypothesis was too simplistic. If it were possible to compensate for differences in frequency resolution between the base and apex by varying either the primary-frequency or primary-level ratio, the optimal-path I/O functions in Fig. 3 would be superimposed. The horizontal and vertical offsets to these I/O functions suggest that it is not entirely possible to compensate for differences in basilar-membrane frequency selectivity by either decreasing f2/f1 or increasing L1.
We had anticipated that frequency ratios < 1.20 would be optimal for the higher frequency stimuli, particularly f2 = 8 kHz. However, frequency ratios less than 1.20 were rarely associated with maximum DPOAE level (see Figs. 3 and 4). Additionally, for frequency ratios < 1.20 there was a decrease in DPOAE level for all f2 frequencies except 1 kHz (see Fig. 4). This decrease in level for f2/f1 < 1.20 occurs despite optimizing the L1-L2 to produce the maximum DPOAE level. One possible mechanism for this observation is that the primaries may be suppressing each other and possibly the DPOAE component for frequency ratios less than 1.20, thus counterbalancing the increase in DPOAE level associated with more “optimal” overlap of the cochlear representation of the primaries. This explanation has been proposed in the modeling work of Kanis and de Boer (1997) and Lukashkin and Russell (2001). Experimental observations in support of this view also have been reported by Cooper and Rhode (1997), based on direct observations of basilar-membrane motion under conditions of single- and two-tone stimulation.
The observation of a less steep decline in DPOAE level for f2/f1 < 1.20 when f2 = 1 kHz (see Fig. 4), also may be consistent with the two-tone suppression interpretation. Cooper and Rhode (1997) observed an essentially flat frequency-ratio function for f2/f1 < 1.40 in mechanical responses in the apical region of chinchilla cochlea. This observation was in contrast to the more sharply tuned frequency-ratio function in the basal region of guinea pig cochlea. They attributed this difference in frequency-ratio tuning between the base and apex to the observation in their own work (Cooper and Rhode, 1996) and the work of Delgutte (1990), that two-tone suppression is stronger in the base than in the apex. The flatter frequency-ratio function when f2 = 1 kHz as compared to higher f2 frequencies in the present data suggest less suppression among the primaries and the DPOAE component when f2 = 1 kHz.
C. Optimal stimulus parameters
The stimulus conditions associated with the maximum DPOAE levels (see Fig. 6), as well as our model for describing them, are consistent with hypothesized interactions among f2/f1, L1-L2, and L2. As described above, frequency resolution is sharper for high frequencies than for low frequencies. However, for a given frequency, a broader cochlear representation is expected as level is increased. Therefore, larger frequency ratios were required for maximum DPOAE levels as either f2 decreased or L2 increased. Although the largest DPOAE levels were obtained using freely varying stimulus combinations (Ldmax), the time required to determine the stimulus conditions resulting in Ldmax for individual subjects may argue against its use. The DPOAE levels obtained from stimulus conditions described by the equations shown in Fig. 6 were less than Ldmax for some conditions, but were greater than those obtained by allowing only L1-L2 to vary (e.g., Kummer et al., 1998; Neely et al., 2005). These equations may have an added benefit, in that they could be used to specify stimulus conditions for f2 frequencies other than the ones used in this study.
The manner in which stimulus level is calibrated is expected to have an influence on the optimal stimulus parameters for recording DPOAEs. It has been shown that differences in sound pressure level exist at the tympanic membrane (TM) when stimuli are calibrated at the plane of the probe as compared to the plane of the TM, or when using an isovoltage strategy (e.g., Siegel, 1994; Siegel and Hirohata, 1994; Whitehead et al., 1995b). These differences are most pronounced for frequencies exceeding 2-3 kHz and are variable across individuals. They are a consequence of the presence of standing waves in the ear canal, which vary with probe-insertion depth and ear-canal geometry for an individual ear. There is no simple method for accounting for these calibration errors, although Neely and Gorga (1998) suggest calibrating in acoustic intensity rather than acoustic pressure as a way to avoid standing-wave influences on stimulus level. Unfortunately, acoustic intensity calibrations have not been widely utilized. While the optimal stimulus parameters described here may not generalize to alternate calibrations strategies, they are expected to result, on average, in the largest DPOAE levels in subjects with normal hearing for applications where stimulus levels are calibrated at the plane of the measurement probe. Furthermore, it may be of value to note the calibration was the same, regardless of which stimulus paradigm (Kummer et al., 1998; Neely et al., 2005; the present approach) was used to set stimulus conditions.
Investigations of the complete DPOAE parametric space are rarely attempted in humans because of the time involved in recording DPOAE responses for the large number of stimulus conditions that are necessary to explore the stimulus space. Mills (2002) described results from a comprehensive investigation of the DPOAE parametric space in Mongolian gerbil. Similarly comprehensive investigations in humans are impractical. Parametric investigations in humans typically focus on a restricted region of the primary level or frequency space (e.g., Harris et al., 1989; Gaskill & Brown, 1990; Kummer et al., 1998; Neely et al., 2005). The equations shown in Fig. 6, however, may obviate the need for comprehensive evaluations of stimulus conditions in individual subjects. Although the fits of these equations to the data shown in Fig. 6 may not appear compelling, the more important observation is how close the DPOAE levels were for the Ldmax and Ldpar stimulus conditions. Thus, the stimulus conditions defined by Ldpar may be a good compromise, in that they do not require a complete exploration of the primary-level and primary-frequency-ratio space with every subject and they can be used with f2 frequencies other than the ones used in the present study.
ACKNOWLEDGMENTS
Work supported by the NIH NIDCD R01-DC02251, T32-DC00013, P30-DC04662. Manuscript preparation was also supported by NIH NIDCD F32 DC007536. The authors would like to thank Darcia Dierking for her assistance with data collection and Hongyang Tan for her assistance with the analyses of these data.
Footnotes
Portions of this work were presented at the 28th Midwinter Meeting of the Association for Research in Otolaryngology, New Orleans, LA, February, 2005.
REFERENCES
- Abdala C. Distortion product otoacoustic emission (2f1-f2) amplitude growth in human adults and neonates. J. Acoust. Soc. Am. 2000;107:446–456. doi: 10.1121/1.428315. [DOI] [PubMed] [Google Scholar]
- Abdala C. A longitudinal study of distortion product otoacoustic emission ipsilateral suppression and input/output characteristics in human neonates. J. Acoust. Soc. Am. 2003;114:3239–3250. doi: 10.1121/1.1625930. [DOI] [PubMed] [Google Scholar]
- Abdala C, Fitzgerald TS. Ipsilateral distortion product otoacoustic emission (2f1-f2) suppression in children with sensorineural hearing loss. J. Acoust. Soc. Am. 2003;114:919–31. doi: 10.1121/1.1587147. [DOI] [PubMed] [Google Scholar]
- ANSI . Specifications for audiometers. American National Standards Institute; New York: 1996. ANSI 3.6-1996. [Google Scholar]
- Brown AM, Gaskill SA. Measurement of acoustic distortion reveals underlying similarities between human and rodent mechanical responses. J. Acoust. Soc. Am. 1990;88:840–849. doi: 10.1121/1.399733. [DOI] [PubMed] [Google Scholar]
- Brown AM, Kemp DT. Suppressibility of the 2f1-f2 stimulated acoustic emissions in gerbil and man. Hear. Res. 1984;13:29–37. doi: 10.1016/0378-5955(84)90092-3. [DOI] [PubMed] [Google Scholar]
- Brown AM, Sheppard SL, Russell PT. Acoustic distortion products (ADP) from the ears of term infants and young adults using low stimulus levels. B. J. Audiol. 1994;28:273–280. doi: 10.3109/03005369409086577. [DOI] [PubMed] [Google Scholar]
- Cooper NP, Rhode WS. Two-tone suppression in apical cochlear mechanics. Auditory Neurosci. 1996;3:123–134. [Google Scholar]
- Cooper NP, Rhode WS. Mechanical responses to two-tone distortion products in the apical and basal turns of the mammalian cochlea. J. Neurophysiol. 1997;78:261–270. doi: 10.1152/jn.1997.78.1.261. [DOI] [PubMed] [Google Scholar]
- Delgutte B. Two-tone rate suppression in auditory-nerve fibers: Dependence on suppressor frequency and level. Hear. Res. 1990;49:225–246. doi: 10.1016/0378-5955(90)90106-y. [DOI] [PubMed] [Google Scholar]
- Dorn PA, Konrad-Martin D, Neely ST, Keefe DH, Cyr E, Gorga MP. Distortion product otoacoustic emission input/output functions in normal-hearing and hearing-impaired human ears. J. Acoust. Soc. Am. 2001;110:3119–3131. doi: 10.1121/1.1417524. [DOI] [PubMed] [Google Scholar]
- Gaskill SA, Brown AM. The behavior of the acoustic distortion product, 2f1-f2, from the human ear and its relation to auditory sensitivity. J. Acoust. Soc. Am. 1990;88:821–839. doi: 10.1121/1.399732. [DOI] [PubMed] [Google Scholar]
- Gorga MP, Neely ST, Bergman B, Beauchaine KL, Kaminski JR, Peters J, Jesteadt W. Otoacoustic emissions from normal-hearing and hearing-impaired subjects: Distortion product responses. J. Acoust. Soc. Am. 1993;93:2050–2060. doi: 10.1121/1.406691. [DOI] [PubMed] [Google Scholar]
- Gorga MP, Neely ST, Dierking DM, Dorn PA, Hoover BM, Fitzpatrick DF. Distortion product otoacoustic emission suppression tuning curves in normal-hearing and hearing-impaired human ears. J. Acoust. Soc. Am. 2003;114:263–278. doi: 10.1121/1.1575751. [DOI] [PubMed] [Google Scholar]
- Gorga MP, Neely ST, Dorn PA, Konrad-Martin D. The use of distortion product otoacoustic emission suppression as an estimate of response growth. J. Acoust. Soc. Am. 2002;111:271–284. doi: 10.1121/1.1426372. [DOI] [PubMed] [Google Scholar]
- Gorga MP, Neely ST, Ohlrich B, Hoover B, Redner J, Peters J. From laboratory to clinic: A large scale study of distortion product otoacoustic emissions in ears with normal hearing and ears with hearing loss. Ear Hear. 1997;18:440–455. doi: 10.1097/00003446-199712000-00003. [DOI] [PubMed] [Google Scholar]
- Harris FP, Lonsbury-Martin BL, Stagner BB, Coats AC, Martin GK. Acoustic distortion products in humans: Systematic changes in amplitude as a function of f2/f1 ratio. J. Acoust. Soc. Am. 1989;85:220–229. doi: 10.1121/1.397728. [DOI] [PubMed] [Google Scholar]
- Harris FP, Probst R, Xu L. Suppression of the 2f1-f2 otoacoustic emission in humans. Hear. Res. 1992;64:133–141. doi: 10.1016/0378-5955(92)90175-m. [DOI] [PubMed] [Google Scholar]
- Hauser R, Probst R. The influence of systematic primary-tone level variation L2 - L1 on the acoustic distortion product emission 2f1 - f2 in normal human ears. J. Acoust. Soc. Am. 1991;89:280–286. doi: 10.1121/1.400511. [DOI] [PubMed] [Google Scholar]
- Janssen T, Kummer P, Arnold W. Growth behavior of the 2 f1-f2 distortion product otoacoustic emission in tinnitus. J. Acoust. Soc. Am. 1998;103:3418–3430. doi: 10.1121/1.423053. [DOI] [PubMed] [Google Scholar]
- Kanis LJ, de Boer E. Frequency dependence of acoustic distortion products in a locally active model of the cochlea. J. Acoust. Soc. Am. 1997;101:1527–1531. doi: 10.1121/1.418173. [DOI] [PubMed] [Google Scholar]
- Kim DO, Dorn PA, Neely ST, Gorga MP. Adaptation of distortion product otoacoustic emission in humans. J. Assoc. Res. Otolaryngol. 2001;2:31–40. doi: 10.1007/s101620010066. [DOI] [PMC free article] [PubMed] [Google Scholar]
- Kummer P, Janssen T, Arnold W. The level and growth behavior of the 2f1-f2 distortion product otoacoustic emission and its relationship to auditory sensitivity in normal hearing and cochlear hearing loss. J. Acoust. Soc. Am. 1998;103:3431–3444. doi: 10.1121/1.423054. [DOI] [PubMed] [Google Scholar]
- Kummer P, Janssen T, Hulin P, Arnold W. Optimal L1-L2 primary tone level separation remains independent of test frequency in humans. Hear. Res. 2000;146:47–56. doi: 10.1016/s0378-5955(00)00097-6. [DOI] [PubMed] [Google Scholar]
- Lukashkin AN, Russell IJ. Origin of the bell-like dependence of the DPOAE amplitude on primary frequency ratio. J. Acoust. Soc. Am. 2001;110:3097–3106. doi: 10.1121/1.1417525. [DOI] [PubMed] [Google Scholar]
- Mills DM. Interpretation of standard distortion product otoacoustic emission measurements in light of the complete parametric response. J. Acoust. Soc. Am. 2002;112:1545–1560. doi: 10.1121/1.1505021. [DOI] [PubMed] [Google Scholar]
- Neely ST, Gorga MP. Comparison between intensity and pressure as measures of sound level in the ear canal. J. Acoust. Soc. Am. 1998;104:2925–2934. doi: 10.1121/1.423876. [DOI] [PubMed] [Google Scholar]
- Neely ST, Stevenson R. Tech. Memo. Vol. 19. Boys Town National Research Hospital; Omaha, NE: 2002. SYSRES. [Google Scholar]
- Neely ST, Gorga MP, Dorn PA. Cochlear compression estimates from measurements of distortion-product otoacoustic emissions. J. Acoust. Soc. Am. 2003;114:1499–1507. doi: 10.1121/1.1604122. [DOI] [PubMed] [Google Scholar]
- Neely ST, Johnson TA, Gorga MP. Distortion-product otoacoustic emission measured with continuously varying stimulus level. J. Acoust. Soc. Am. 2005;117:1248–1259. doi: 10.1121/1.1853253. [DOI] [PMC free article] [PubMed] [Google Scholar]
- Nelson DA, Schroder AC. Peripheral compression as a function of stimulus level and frequency region in normal-hearing listeners. J. Acoust. Soc. Am. 2004;115:2221–2233. doi: 10.1121/1.1689341. [DOI] [PubMed] [Google Scholar]
- Norton SJ, Gorga MP, Widen JE, Folsom RC, Sininger Y, Cone-Wesson B, Vohr BR, Mascher K, Fletcher K. Identification of neonatal hearing impairment: Evaluation of transient evoked otoacoustic emission, distortion product otoacoustic emission, and auditory brain stem response test performance. Ear Hear. 2000;21:508–528. doi: 10.1097/00003446-200010000-00013. [DOI] [PubMed] [Google Scholar]
- Oxenham AJ, Dau T. Masker phase effects in normal-hearing and hearing-impaired listeners: Evidence for peripheral compression at low signal frequencies. J. Acoust. Soc. Am. 2004;116:2248–2257. doi: 10.1121/1.1786852. [DOI] [PubMed] [Google Scholar]
- Oxenham AJ, Plack CJ. A behavioral measure of basilar-membrane nonlinearity in listeners with normal and impaired hearing. J. Acoust. Soc. Am. 1997;101:3666–3675. doi: 10.1121/1.418327. [DOI] [PubMed] [Google Scholar]
- Oxenham AJ, Plack CJ. Effects of masker frequency and duration in forward masking: Further evidence for the influence of peripheral nonlinearity. Hear. Res. 2000;150:258–266. doi: 10.1016/s0378-5955(00)00206-9. [DOI] [PubMed] [Google Scholar]
- Plack CJ, Drga V. Psychophysical evidence for auditory compression at low characteristic frequencies. J. Acoust. Soc. Am. 2003;113:1574–1586. doi: 10.1121/1.1538247. [DOI] [PubMed] [Google Scholar]
- Robles L, Ruggero MA. Mechanics of the mammalian cochlea. Physiol. Rev. 2001;81:1305–1352. doi: 10.1152/physrev.2001.81.3.1305. [DOI] [PMC free article] [PubMed] [Google Scholar]
- Shera CA, Guinan JJ., Jr. Evoked otoacoustic emissions arise by two fundamentally different mechanisms: a taxonomy for mammalian OAEs. J. Acoust. Soc. Am. 1999;105:782–798. doi: 10.1121/1.426948. [DOI] [PubMed] [Google Scholar]
- Siegel JH. Ear-canal standing waves and high-frequency sound calibration using otoacoustic emission probes. J. Acoust. Soc. Am. 1994;95:2589–2597. [Google Scholar]
- Siegel JH, Hirohata ET. Sound calibration and distortion product otoacoustic emissions at high frequencies. Hear. Res. 1994;80:146–152. doi: 10.1016/0378-5955(94)90106-6. [DOI] [PubMed] [Google Scholar]
- Stelmachowicz PG, Lewis DE, Larson LL, Jesteadt W. Growth of masking as a measure of response growth in hearing-impaired listeners. J. Acoust. Soc. Am. 1987;81:1881–1887. doi: 10.1121/1.394752. [DOI] [PubMed] [Google Scholar]
- Stover L, Gorga MP, Neely ST, Montoya D. Toward optimizing the clinical utility of distortion product otoacoustic emission measurements. J. Acoust. Soc. Am. 1996;100:956–967. doi: 10.1121/1.416207. [DOI] [PubMed] [Google Scholar]
- Stover LJ, Neely ST, Gorga MP. Cochlear generation of intermodulation distortion revealed by DPOAE frequency functions in normal and impaired ears. J. Acoust. Soc. Am. 1999;106:2669–2678. doi: 10.1121/1.428097. [DOI] [PubMed] [Google Scholar]
- Whitehead ML, McCoy MJ, Lonsbury-Martin BL, Martin GK. Dependence of distortion-product otoacoustic emissions on primary levels in normal and impaired ears. I. Effects of decreasing L2 below L1. J. Acoust. Soc. Am. 1995a;97:2346–2358. doi: 10.1121/1.411959. [DOI] [PubMed] [Google Scholar]
- Whitehead ML, Stagner BB, Lonsbury-Martin BL, Martin GK. Effects of ear-canal standing waves on measurements of distortion-product otoacoustic emissions. J. Acoust. Soc. Am. 1995b;98:3200–3214. doi: 10.1121/1.413810. [DOI] [PubMed] [Google Scholar]
- Whitehead ML, Stagner BB, McCoy MJ, Lonsbury-Martin BL, Martin GK. Dependence of distortion-product otoacoustic emissions on primary levels in normal and impaired ears. II. Asymmetry in L1,L2 space. J. Acoust. Soc. Am. 1995c;97:2359–2377. doi: 10.1121/1.411960. [DOI] [PubMed] [Google Scholar]