

Abstract
Q-space imaging (QSI), a diffusion MRI technique, can provide quantitative tissue architecture information at cellular dimensions not amenable by conventional diffusion MRI. By exploiting regularities in molecular diffusion barriers, QSI can estimate the average barrier spacing such as the mean axon diameter in white matter (WM). In this work, we performed ex vivo QSI on cervical spinal cord sections from healthy C57BL/6 mice at 400MHz using a custom-designed uniaxial 50T/m gradient probe delivering a 0.6 µm displacement resolution capable of measuring axon diameters on the scale of 1 µm. After generating QSI-derived axon diameter maps, diameters were calculated using histology from seven WM tracts (dorsal corticospinal, gracilis, cuneatus, rubrospinal, spinothalamic, reticulospinal, and vestibulospinal tracts) each with different axon diameters. We found QSI-derived diameters from regions drawn in the seven WM tracts (1.1 to 2.1 µm) to be highly correlated (r2 = 0.95) with those calculated from histology (0.8 to 1.8 µm). The QSI-derived values overestimated those obtained by histology by approximately 20%, which is likely due to the presence of extra-cellular signal. Finally, simulations on images of synthetic circular axons and axons from histology suggest that QSI-derived diameters are informative despite diameter and axon shape variation and the presence of intra-cellular and extra-cellular signal. QSI may be able to quantify nondestructively changes in WM axon architecture due to pathology or injury at the cellular level.
Keywords: q-space imaging, white matter, C57BL/6 mice, axon diameter, axonal architecture
Introduction
The ability to assess regional axonal architecture has applications ranging from studying brain connectivity and maturation, to the study of white matter (WM) diseases such as multiple sclerosis. Diffusion magnetic resonance imaging (MRI) techniques, primarily diffusion weighted imaging (DWI) and diffusion tensor imaging (DTI), provide a non-invasive means to provide indirectly, that is without explicitly resolving the structures, estimates of WM tract orientation and axon integrity (Horsfield and Jones, 2002; Le Bihan, 2003). The concept of diffusion MRI techniques is to measure the microscopic displacement from self-diffusion of molecules endogenous to WM, typically water. These molecules serve as probes of axon architecture as cell membranes and myelin affect how far molecules diffuse within WM.
While DWI and DTI are both valuable clinical tools, neither has been demonstrated to provide specific information on axonal architecture such as mean axon diameter or extra-cellular and intra-cellular space (ECS and ICS, respectively) volume fractions, which could potentially provide insight into brain maturation or pathology. Such limitations may arise from the simplistic approach of DWI and the erroneous assumption of free diffusion, i.e. absence of barriers to molecular diffusion, in the analysis of DTI. An alternative diffusion MRI technique used in this paper, q-space imaging (QSI), as proposed by Callaghan (Callaghan, 1993; Callaghan, 1996) and by Cory and Garroway (Cory and Garroway, 1990), does not assume any model of diffusion. As such, QSI more accurately describes water diffusion in biological tissues and thus has the potential to provide information on axonal architecture not amenable by conventional diffusion MRI techniques.
QSI allows assessment of microarchitecture by exploiting the regularity of restrictions to molecular diffusion in porous systems as applied to determine pore geometry in porous solids (Callaghan et al., 1991), the study of packed erythrocytes (Torres et al., 1998), and the assessment of axonal architecture (Chin et al., 2004; Cohen and Assaf, 2002; Malmborg et al., 2006). In WM tracts, the porous system consists of water diffusion restricted by axon membranes and myelin sheaths (Beaulieu, 2002). The application of QSI to assess axonal architecture, where one extracts information such as mean axon diameter, should not be confused with the application of QSI to estimate axon fiber orientation in tractography, as used in techniques such as diffusion spectrum imaging (DSI) and q-ball imaging (QBI) (Tuch et al., 2003; Wedeen et al., 2005) in which multiple fiber orientations within a single voxel can be differentiated, in contrast to DTI.
Similar to conventional diffusion MRI techniques, QSI experiments utilize two magnetic field gradient pulses of amplitude G and duration δ, which are separated by a diffusion time Δ, to sensitize the magnetic resonance signal to molecular displacements due to molecular diffusion (Stejskal and Tanner, 1965). Any molecular displacement along the gradient direction during the diffusion time results in a loss of signal, which will depend on both the sensitivity of the gradient pulses to molecular displacements, which is expressed by the wave number q (q = (2π)−1γGδ, where γ is the gyromagnetic ratio), and the diffusion time, Δ. In QSI, attenuation of the signal, or echo, is recorded as a function of the q-value. A simple Fourier transform of the echo attenuation, E(q,Δ), where q is the q-value along an arbitrary gradient direction, results in a molecular displacement probability function, P(R,Δ), which defines the probability that a molecule at any initial position is displaced by R along an arbitrary gradient direction during the period Δ, as shown below:
| [1] |
It is important to note that the Fourier relationship between the echo attenuation and displacement probability function is only valid under the short-gradient pulse approximation, or SGPA, where the gradient pulse duration is much shorter than the diffusion time (δ≤Δ). If multiple gradient directions are used, a displacement probability function in three dimensions can be computed, as in DSI. If only one gradient direction is used, the one-dimensional displacement probability function may be referred to as the displacement profile, as in 1-D QSI.
The displacement probability function will be influenced by axonal architecture as axon membranes and myelin sheaths impede the motion of diffusing molecules such as water and hence affect its displacement probabilities, e.g. higher probability of displacement parallel as opposed to displacement perpendicular to WM fiber tracts. The 1D QSI displacement profile has a particularly simple interpretation as long as the gradients are applied perpendicular to the axon fibers, which can be thought of as having a tubular geometry (Avram et al., 2004). The width of the displacement profile, typically characterized by its full-width at half-maximum (FWHM), should correlate with the scale of restrictions which, in WM, is the mean axon diameter averaged over the imaging volume. Therefore, from the FWHM, it is possible to estimate mean axon diameters. Other metrics that are used to characterize the displacement profile include the peak value, otherwise known as the zero-displacement probability, which is inversely related to FWHM and reflects the fraction of molecules that diffuse short distance or not at all, and kurtosis, i.e. the fourth moment of the displacement profile, which is a measure of the degree of deviation from a Gaussian distribution and therefore reflects the degree of restriction to diffusion (Chin et al., 2004). Kurtosis may correlate with axon density and may provide insight to long-range diffusion behavior (Jensen et al., 2005).
The 1D QSI technique has been successfully applied to study neural tissues of mice, rats, and swine both in vivo and ex vivo (Assaf et al., 2002b; Assaf et al., 2000; Biton et al., 2005; King et al., 1997; King et al., 1994). In order to extend the 1D QSI technique to the tortuous WM tracts of the brain, Assaf et al. (Assaf et al., 2002a) incorporated a tensor analysis of 1D QSI experiments performed along seven gradient directions to produce rotationally invariant parameters analogous to DTI. The tensor analysis allows for extraction of the displacement profile metrics corresponding to water diffusing perpendicular to the axon fiber tracts. This QSI tensor technique has been used to study in vivo the brains of healthy and multiple sclerosis patients as well as patients with vascular dementia (Assaf et al., 2005; Assaf et al., 2002c; Nilsson et al., 2007; Nordh et al., 2007). Notably, QSI derived parameters were observed to be more sensitive to axon integrity than those derived from conventional MRI techniques. Very recently, QSI has also been applied to image in vivo human spinal cord (Farrell et al., 2007). In this case, due to the simple WM structure, no tensor analysis was necessary and the diffusion gradients were applied orthogonally to the spinal cord.
Despite such advances, the above prior QSI studies were limited by the capabilities of the gradient system available on commercial scanners. The displacement profile resolution is determined by the maximum q-value used due to its Fourier relationship with the echo attenuation. Imposition of the SGPA demands very high gradient amplitudes not commercially available even on micro-imaging systems. As a result, the QSI studies cited above either violated the SGPA or their displacement profile resolutions (ranging from 2 (Chin et al., 2004) to 20 (King et al., 1997) µm) exceeded typical axon diameters (1–2 µm). Mitra et al (Mitra and Halperin, 1995) predicted that as the gradient duration increased in relation to diffusion time, the displacement profile would artifactually narrow, which has been observed experimentally (Assaf et al., 2002a).
QSI of biological tissues is further complicated by the presence of water in the ECS and ICS and exchange between these compartments. Due to the lack of precise knowledge of parameters such as ECS and ICS T2 and membrane permeability, the consequences of these effects on the echo attenuation and displacement profile are poorly understood. Also, cells in biological tissues exhibit significant variations in size and shape, which tend to obscure cell geometry information obtained directly from the echo attenuation (Peled et al., 1999). However, their effect on the displacement profile has not been studied as extensively.
The main objective of the present work was to explore the potential of 1D QSI for non-destructively quantifying axonal architecture in terms of mean axon diameter with high accuracy and directly compare the results with histology. To facilitate interpretation of QSI data and comparison with histology, we used healthy adult mouse spinal cords as specimens due to their simple axonal structure. A custom built 50 T/m z-gradient coil (Wright et al., 2007) enabled QSI imaging experiments under optimal conditions allowing sub-millisecond diffusion gradient durations in order to fulfill the SGPA and, for the first time, considering that axon diameter is on the order of or less than one micrometer, sub-micrometer displacement resolution. Additionally, using a diffusion simulation program developed previously (Hwang et al., 2003), we investigated the effects of axon shape and diameter distribution, and the presence of ECS and ICS signal on QSI with ellipsoidal and circular axon models and histologic images from the specimens. Finally, with commercial gradient amplitude limitations in mind, we also experimentally investigated the errors in quantifying axonal architecture arising from failure to fulfill the SGPA and from low displacement profile resolution. Careful empirical comparison between experiments, simulations, and histology of the axonal architecture, provided new insight into the application of QSI to assess axonal architecture.
Materials and Methods
Animal Preparation
Five C57 BL6 mice (8–9 months, 25–30 mg, Charles River, Wilmington, MA) were anesthetized with an intraperitoneal injection of 10 mg ketamine/1 mg acepromazine per ml (0.5 ml per mouse; Abbot Laboratories, North Chicago, IL) and perfused through the heart with 20 ml of phosphate buffer solution, followed by 20 ml of fixing solution (4% glutaraldehyde and 2% paraformaldehyde in 10 mM PBS). Following fixation, the entire spinal cord was dissected out and postfixed for at least two weeks in a different fixing solution (2.5% glutaraldehyde and 2% paraformaldehyde in 0.1 M sodium cacodylate). Cervical C6/C7 sections (3–4 mm in length) were then cut from each spinal cord. After performing QSI experiments, cervical spinal sections that corresponded to the QSI slice were processed for optical histologic imaging (see below).
QSI Experiments
All QSI experiments on excised mouse cervical spinal cords were performed with a custom 50 T/m z-gradient coil/solenoidal RF coil (3 mm i.d. sample bore) set (Wright et al., 2007) designed for high-resolution QSI interfaced to a 9.4T spectrometer/microimaging system (Bruker DMX 400 with Micro2.5 gradients and BAFPA40 amplifiers, Karlsruhe, Germany). The design was based on one proposed by Callaghan et al (Callaghan et al., 1998) and consisted of an elongated Maxwell pair and a 3-turn solenoidal RF coil that accommodated a 3.0/2.4 mm (o.d./i.d.) sample tube.
A diffusion-weighted stimulated-echo imaging sequence was used with the following parameters: 64 × 64 matrix, spectral width = 25 KHz, TR = 2 s, averages = 6, TE = 17.4 ms, Δ = 10 ms, δ = 0.4 ms, mixing time = 9 ms, FOV = 4 mm, slice thickness = 1.0 mm, and the experiments were conducted at an ambient temperature of 19 °C. Images were zero-filled to 256 × 256. The diffusion gradients were applied along the z-axis, which is perpendicular to the spinal cord longitudinal axis, in 63 increments in steps of 0.013 µm−1 yielding qmax = 0.82 µm−1 (48 T/m gradient strength). The q-values were numerically calculated from the actual z-gradient amplifier output as monitored on an oscilloscope with LabView (National Instruments, Austin, TX) (Wright et al., 2007). When investigating the effects of failing to fulfill the SGPA, the above imaging parameters were used except: δ = 5 ms (Δ remained 10 ms), and the diffusion gradients were again applied along the z-axis in 63 increments in steps of 0.013 µm−1 yielding qmax = 0.82 µm−1 (3.84 T/m gradient strength).
QSI Data Analysis
All data analysis was performed in IDL (Interactive Data Language, Research Systems, Boulder, CO). As each image corresponded to a specific q-value, QSI data set can be thought of as a 3D matrix with two spatial and one q-value dimension. An echo attenuation plot for one pixel can be generated by selecting one location in the spatial dimensions and then recording the echo attenuation along the q-value dimension.
Once the single pixel echo attenuation plot is recorded, it is normalized to the maximum value at the zero q-value. In order to compute a purely real Fourier transform in accordance with Fourier transform theory, the echo attenuation plot was reflected about the origin (q = 0) to fill in the negative q-value, resulting in 127 total q-values (1 zero q-value, 63 positive, and 63 negative q-values). A displacement profile was computed by applying a 1D Fourier transform of the modified echo attenuation plot. FWHM was measured with linear interpolation. After calculating the displacement profiles for each pixel, displacement profile FWHM, zero-displacement probability, and kurtosis maps are generated.
In order to compare differences between WM tracts, a region-of-interest (ROI) analysis was performed on the FWHM, zero-displacement probability, and kurtosis maps. ROIs of 20 pixels were manually drawn in each of the seven WM tracts. ROI locations were chosen to match the histologic ROI location (as discussed below) as closely as possible. For each ROI, average q-space attenuation plots, displacement profiles, FWHM, zero-displacement probability, and kurtosis values were recorded.
To investigate the effects of low displacement resolution, we took the existing experimental data, truncated the q-space dimension by retaining the first 16 q-values and setting the remaining 48 q-values to zero, and performed the same data processing described above. We chose to retain the first 16 q-values, because that seemed to be the limit below which we could no longer differentiate between WM tracts.
Synthetic Axon Images and Optical Images of Mouse Spinal Cord
In order to investigate the effect of axon size distribution on QSI derived parameters such as displacement profile FWHM, zero-displacement probability, and kurtosis, several images of randomly packed circular axons (256 × 256 matrix, pixel size 0.75 × 0.75 µm2) with varying Gaussian distribution of diameters were generated using a custom IDL program (Interactive Data Language, Research Systems, Boulder, CO) as input for the q-space simulation program (Figure 1a–d). In order to investigate the effect of axon shape distribution on QSI derived parameters, images of packed ellipsoidally shaped axons (256 × 256 matrix, pixel size 0.75 × 0.75 µm2) were drawn in Powerpoint (Microsoft Office, Microsoft, Seattle, WA) with varying major axis over minor axis lengths ratios as input for the q-space simulation program (Figure 1e–g).
Figure 1.

Synthetic circular axon images generated with a Gaussian distribution of diameters (mean and standard deviation are µ and σ respectively): a) σ/µ = 0.0, b) σ/µ = 0.1, c) σ/µ = 0.25, d) σ/µ = 0.5. The white rings signify myelin. The mean axon diameter (excluding myelin) was held constant at 14.48 µm. Synthetic ellipsoidal axon images generated with different ratios (R) of major axis over minor axis lengths e) R = 1.25, f) R = 1.5, g) R = 2.0. The mean axon diameter (excluding myelin) was held constant at ~25 µm.
To investigate the effect of ECS and ICS signal on QSI, light microscopic images of fixed mouse spinal cord sections embedded in epoxy (C6–C7) at seven WM tract locations were obtained after staining for myelin with toluidine blue (Figure 2). These locations as defined in (Schwartz et al., 2005a) were selected to reflect a range of characteristic axonal architecture. Each image was digitized with a CUE-2 image analyzer (Olympus American, Melville, NY), in which a region of interest (ROI) was selected as input to the simulation program. This ROI size approximated the pixel size of the experimental data before zero-filling.
Figure 2.
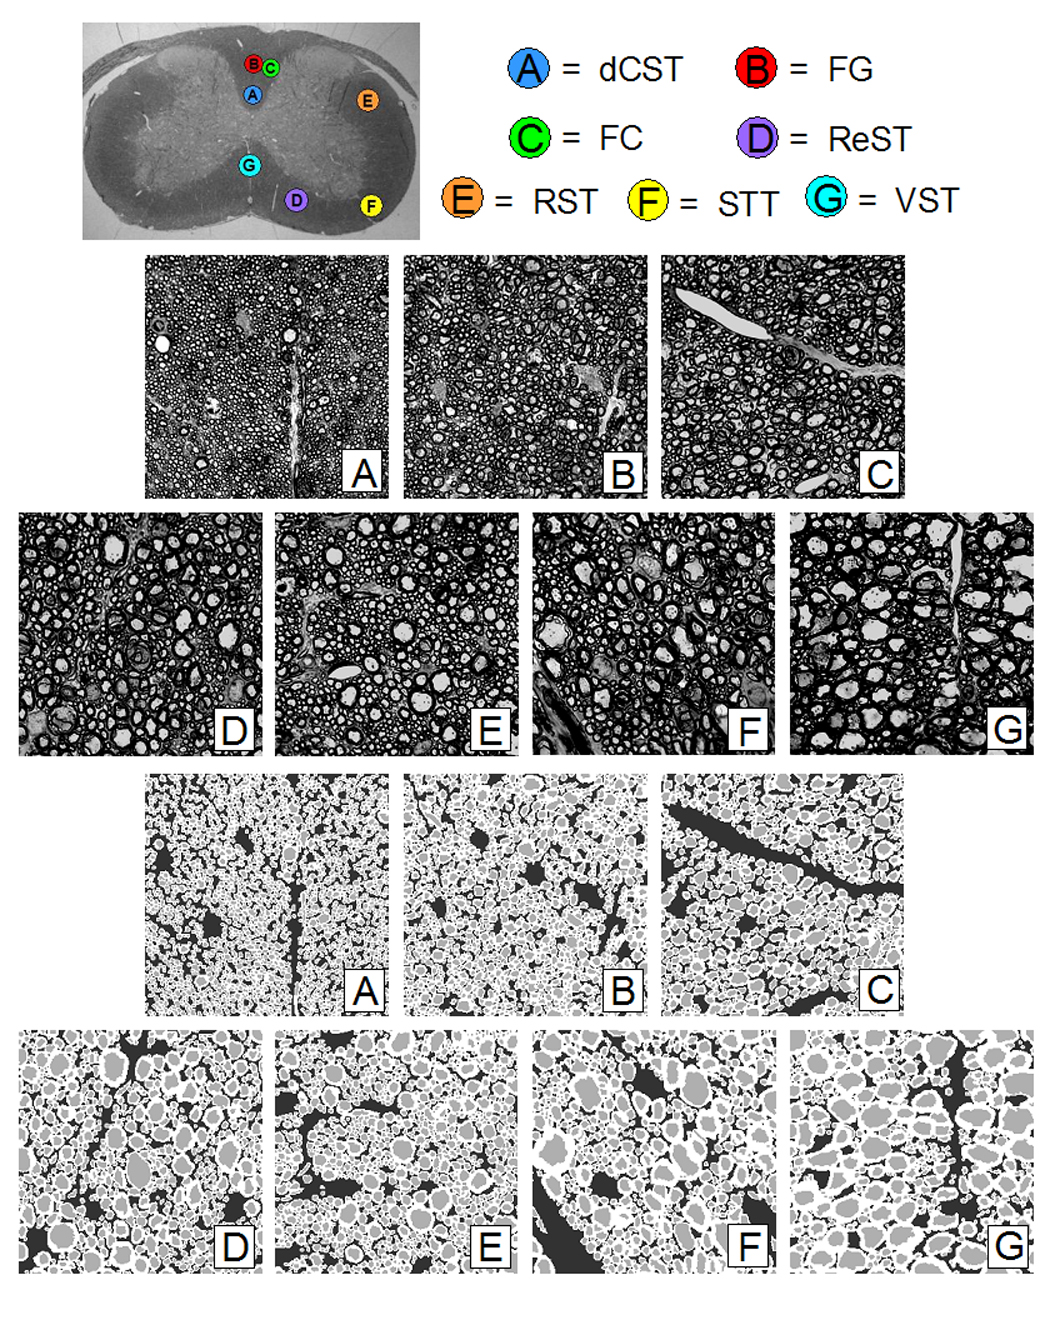
Top Image: Optical image of C6/C7 mouse cord section showing WM tract locations: A) dorsal corticospinal (dCST), B) gracilis (FG), C) cuneatus (FC), D) rubrospinal (RST), E) spinothalamic (STT), F) reticulospinal (ReST), G) vestibulospinal (VST). The spinal cord is approximately 3 mm wide. Middle Images: Optical images of WM tracts from mouse spinal cord C6/C7 section. Each image is 700 × 700 with a pixel resolution of 0.1 × 0.1 µm. Bottom Images: Segmented down-sampled images of WM tracts from mouse spinal cord C6/C7 section. Each image is 256 × 256 with a pixel resolution of 0.27 × 0.27 µm.
Subsequently, these images were segmented into ECS, ICS, and myelin compartments using a program written in Matlab (Mathworks, Natick, MA). First, seed points were placed within the axons to initiate a watershed-based segmentation (Beucher and Lantuejoul, 1979; Meyer and Beucher, 1990) of the ICS. The myelin was then segmented using an interactive profile-based boundary detection algorithm (Pal and Pal, 1993). After manual correction, the ECS was determined by subtracting the union of the axon and the myelin regions from the entire image space. The segmented images were then used to calculate mean axon diameter (equating each ICS axon area to a circle, excluding the myelin), fractional areas of ECS, ICS, and myelin, and axon count (Table 1). Finally, the segmented images were down-sampled to 256 × 256 (Figure 2) to serve as input for the q-space simulations.
Table 1.
Average Regional White Matter Tract Histologic Characteristic
| dCST | FG | RST | ReST | FC | STT | VST | |
|---|---|---|---|---|---|---|---|
| Axon Diameter | 0.81 ± 0.06 | 0.99 ± 0.06 | 1.16 ± 0.04 | 1.36 ± 0.09 | 1.40 ± 0.14 | 1.44 ± 0.11 | 1.82 ± 0.26 |
| Axon Diameter Std. Dev. | 0.31 ± 0.08 | 0.47 ± 0.06 | 0.71 ± 0.10 | 0.89 ± 0.10 | 0.88 ± 0.10 | 0.98 ± 0.18 | 1.40 ± 0.13 |
| ICS Fraction | 0.21 ± 0.04 | 0.22 ± 0.03 | 0.25 ± 0.04 | 0.27 ± 0.04 | 0.27 ± 0.01 | 0.23 ± 0.04 | 0.28 ± 0.06 |
| ECS Fraction | 0.35 ± 0.10 | 0.31 ± 0.07 | 0.31 ± 0.07 | 0.32 ± 0.06 | 0.27 ± 0.05 | 0.35 ± 0.11 | 0.31 ± 0.12 |
| Myelin Fraction | 0.45 ± 0.07 | 0.47 ± 0.05 | 0.43 ± 0.04 | 0.41 ± 0.04 | 0.46 ± 0.06 | 0.42 ± 0.08 | 0.41 ± 0.06 |
| Axon Count | 1670 ± 267 | 1101 ± 146 | 791 ± 122 | 574 ± 79 | 591 ± 97 | 436 ± 68 | 289 ± 78 |
As we are comparing our experimental QSI data acquired with a slice thickness of 1 mm (to obtain sufficient signal-to-noise ratio) to histology with a slice thickness of 0.5 µm, we investigated how much axon diameter variation occurred through a 1 mm slice. Toward this goal, we obtained from a single specimen six sections spaced 200 microns apart such that they spanned the 1 mm slice thickness used in the imaging experiments. Seven WM tract ROIs (20 pixels each) were imaged from each section, segmented, and the mean axon diameter was calculated.
QSI Simulations and Analysis
Q-space simulations were performed by numerically solving the diffusion equation using a 3D finite-difference model developed by Hwang et al (Hwang et al., 2003) for a pulsed-gradient spin-echo (PGSE) sequence. This method had previously been validated for restricted diffusion bounded by cylindrical pores and diffusion within hexagonal array of cylinders, where the simulated data agreed well with existing analytical solutions (Hwang et al., 2003). The simulation program, written in C language (CodeWarrior, Metrowerks, Austin, TX), was run on a custom-built Linux PC (Suse Linux v2.6.11) with four AMD Opteron™ 852 processors (2.5 GHz) with 32 GB of memory. A simulation on a single 256 × 256 image took 5–10 minutes depending on the simulation parameters.
Two sets of q-space simulations were run: first on the previously described synthetic axon images and subsequently on the segmented histologic images of WM tracts. For the former, the PGSE sequence parameters were: TR = 1 s, TE = 65 ms, Δ = 60 ms, δ = 2 ms, and the diffusion gradients were applied in 63 increments in steps of 0.009 µm−1 yielding qmax = 0.54 µm−1. The ECS and ICS T2 were both assigned to be 300 ms and the corresponding diffusion coefficients were both assigned to be 2.5 × 10⁻⁵ cm2/s. Simulations did not include signal from myelin. The T2 values were chosen to match the long T2 component of neural tissues reported in literature (Chin et al., 2004). The diffusion coefficients were chosen to match those of water at room temperature as it was assumed that it would be an upper limit for the diffusion coefficients found in axonal tissue. Simulations on the circular axons with permeability p = 0 (i.e. perfectly reflecting boundaries) were run with signal occupying only the ICS and only the ECS. Simulations on the ellipsoidal axons were performed with signal occupying only the ICS and with p = 0.
For the segmented histologic images, the PGSE sequence parameters were: TR = 2 s, TE = 17.4 ms, Δ = 10 ms, δ = 0.4 ms, and the diffusion gradients were applied in 63 increments in steps of 0.013 µm−1 yielding qmax = 0.82 µm−1 along the dorsal-ventral axis to approximate the direction of the applied diffusion gradients in our experiments. The following T2, permeability and diffusion coefficients were chosen from literature values (Chin et al., 2004). The ECS, ICS and myelin diffusion coefficients were assigned values of 1.65, 1.12 and 1.12 µm2/s, respectively. The myelin T2 was set to 19 ms and the myelin water concentration to 15%. Due to the uncertainties in ECS and ICS T2 values (Peled et al., 1999), i.e. whether ECS or ICS had the longer T2 value, both cases were simulated: the ECS-weighted case where ECS and ICS T2s were 300 and 78 ms, respectively, and the ICS-weighted case where ECS and ICS T2s were 78 and 300 ms respectively; the ECS and ICS water concentrations were both set to 85% and the myelin/membrane permeability to 0.01 µm/ms.
Each simulation outputs the echo attenuation as a function of q-value, which is then normalized to the maximum value at zero q-value. Subsequently, the echo attenuation was modified (described above) in order to obtain a purely real Fourier transform and a displacement profile was computed by applying a 1D Fourier transform of the modified echo attenuation plot. After calculating the displacement profiles, FWHM, zero displacement probability, and kurtosis values were recorded.
Results
QSI of Mouse Spinal Cords
Figure 3 shows typical magnitude images acquired with q-values of 0 and 0.12 µm−1. Note the inversion in contrast between WM and GM due to the restriction of water diffusion in WM at the higher q-value. SNR values, calculated as the ratio of the mean value of an ROI in the dorsal column divided by the mean value of an ROI in the background, were 60 and 2 for q = 0 µm−1 qmax = 0.82 µm−1, respectively.
Figure 3.
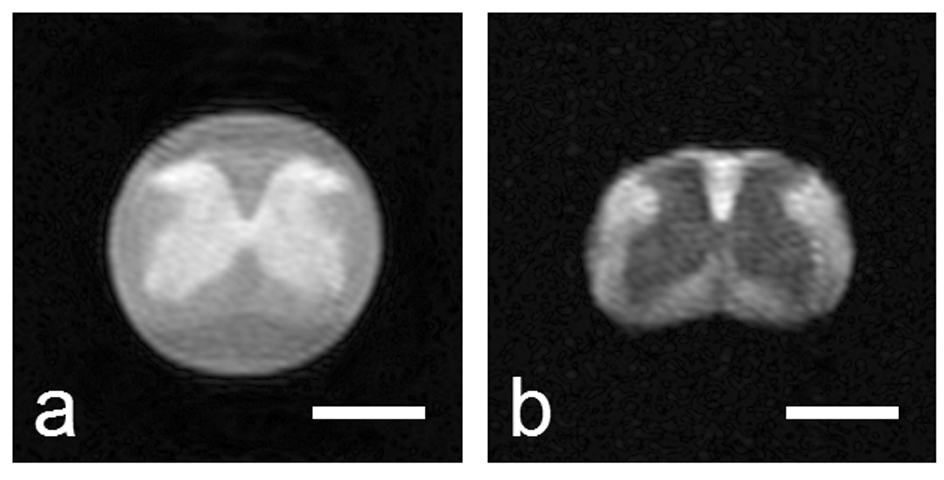
Sample diffusion-weighted stimulated echo magnitude images (Δ/δ = 10/0.4 ms) at two different q-values: 0 and 0.12 µm−1. The white bar represents a length of 1 mm. Note the fluid surrounding the spinal cord, which exhibits free diffusion, is attenuated to background intensity in b).
In the following images, the same color scale was used to highlight differences observed under different experimental conditions. Figure 4 shows typical q-space echo attenuations and displacement profiles for various WM tract ROIs, displacement profile FWHM, zero-displacement and kurtosis maps for one specimen for varying experimental parameters. Note the clear discrimination of WM tracts on the FWHM, zero-displacement probability, and kurtosis maps under conditions of high displacement resolution and fulfilling the SGPA (Figure 4a). However, failure to fulfill the SGPA (Figure 4b), increased zero-displacement probability and kurtosis while decreasing FWHM, as predicted. When simulating low displacement resolution (Figure 4c), the displacement profiles exhibited severe ringing due to zero-filling.
Figure 4.
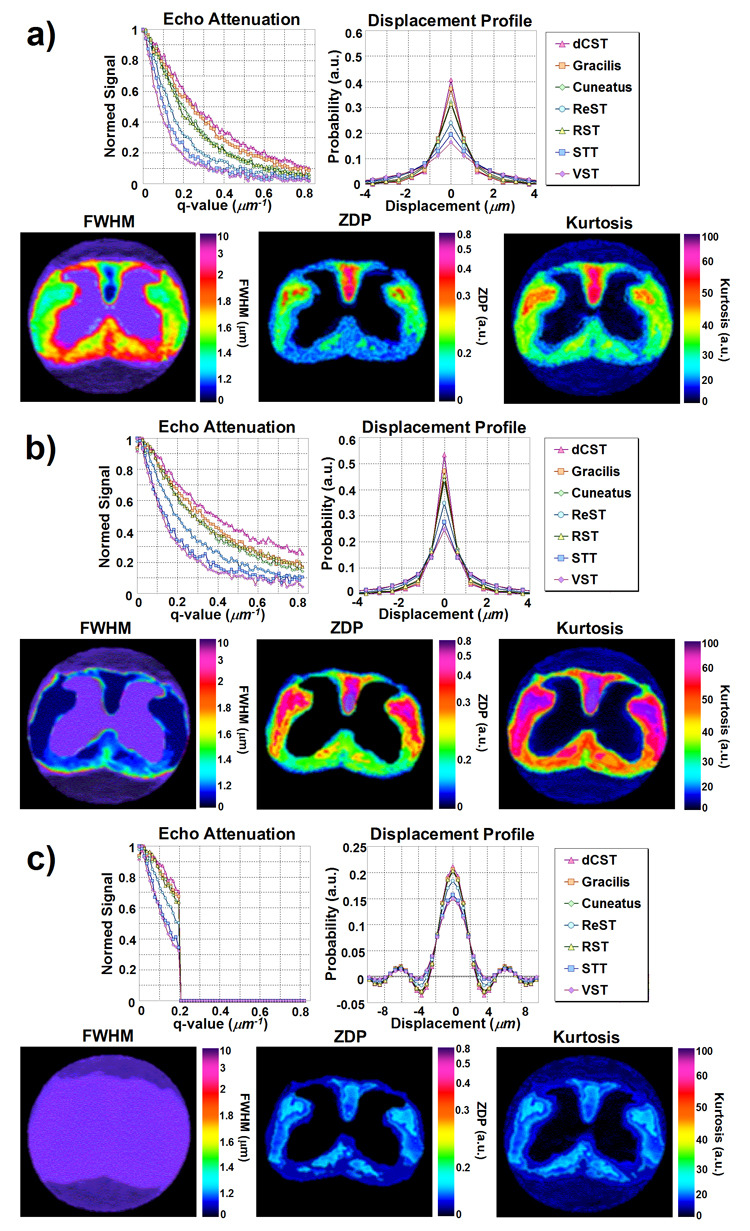
Sample q-space echo attenuation plots and displacement profiles for seven WM tract ROIs, alongside with sample FWHM, zero-displacement probability (ZDP), and kurtosis maps under experimental parameters with a) high displacement resolution (qmax = 0.82 µm−1) and fulfilling the narrow gradient pulse condition (Δ/δ = 10/0.4 ms), b) high displacement resolution (qmax = 0.82 µm−1) and failing to fulfill the narrow gradient pulse condition (Δ/δ = 10/5 ms), and c) low displacement resolution (qmax = 0.21 µm−1) and failing to fulfill the narrow gradient pulse condition (Δ/δ = 10/5 ms). The fourth case of low displacement resolution (qmax = 0.21 µm−1) and fulfilling the narrow gradient pulse condition (Δ/δ = 10/0.4 ms) was excluded to its similarity with c).
Figure 5 illustrates the variation in mean axon diameter that occurred across a 1 mm slice. Figure 5a shows, for one specimen, the calculated mean axon diameters of seven WM tract ROIs from six equally spaced sections spanning 1 mm. Figure 5b compares the mean axon diameters for each WM tract averaged over all six sections with parameters derived from QSI and histology. There was significant correlation between the average axon diameters calculated from all six sections and displacement profile FWHM (r2 = 0.86, p = 0.0025, slope = 0.86), average axon diameters calculated from one section and displacement profile FWHM (r2 = 0.95, p = 0.0002, slope = 0.76), and the average axon diameters calculated from all six sections and average axon diameters calculated from one section (r2 = 0.92, p = 0.0006, slope = 0.81). The data therefore shows that the axonal structure is maintained over our imaging slice thickness and that a histologic section is representative of the average structure.
Figure 5.
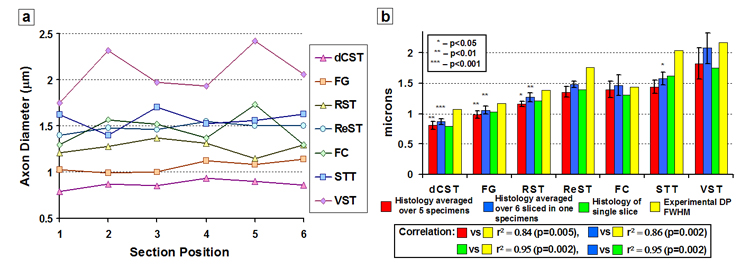
Results of our investigation into how much axon diameter variation occurred through a 1 mm slice. a) Calculated mean axon diameters from seven 20-pixel ROIs of WM tracts from six equally spaced sections spanning 1 mm. Section positions 1 and 6 define the edges of the slice. b) WM tract average axon diameters calculated from all 5 specimens, the WM tract average axon diameters calculated from all six sections in one specimen, the WM tract average axon diameters calculated from one section from the same specimen, and the measured FHWM of the displacement profile (DP) from the same specimen. Each asterisk represents the p-value of a paired t-test comparison with the next similar colored bar to the right.
Figure 6 shows experimental data for each WM tract averaged over all five specimens under experimental conditions fulfilling and not fulfilling the SGPA, as a function of displacement resolution. Note again that FWHM increases, and zero-displacement probability and kurtosis decrease with increasing mean axon diameter in all plots. Under conditions fulfilling the SGPA and high displacement resolution, there was positive correlation between the average axon diameter calculated from histology and FWHM (r2 = 0.95, p = 0.0002, slope = 1.02). Negative correlations were found between the average axon diameter and zero-displacement probability (r2 = 0.89, p = 0.0015, slope = −0.22) and kurtosis (r2 = 0.91, p = 0.0009, slope = −38). The correlations remained significant, albeit less strong, under conditions not fulfilling the SGPA and low displacement resolution.
Figure 6.
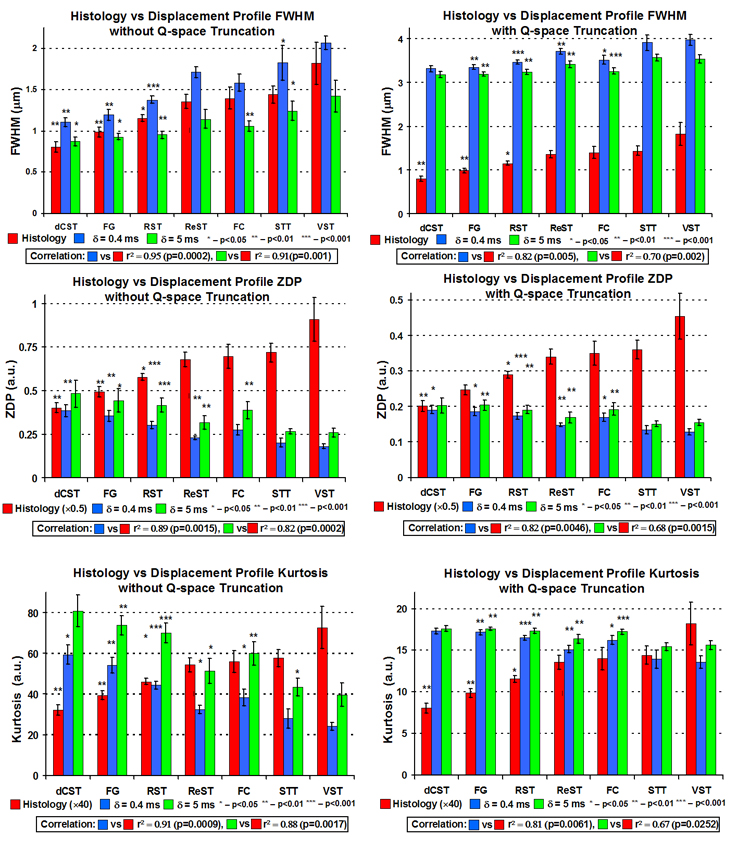
Summary plots of q-space experiments showing mean axon diameter calculated from histology, FHWM, zero-displacement probability (ZDP), and kurtosis values for each WM tract averaged over all five specimens under experimental conditions fulfilling and not fulfilling the SPGA and with and without q-space truncation (to simulate low displacement profile resolution). Each asterisk represents the p-value of a paired t-test comparison with the next similar colored bar to the right.
To the best of our knowledge, our QSI results are the first with a displacement resolution low enough to resolve axon diameters while fulfilling the SGPA. The displacement profile metrics correlated well with the axon diameters measured from histology, suggesting that the echo attenuation is dominated by the ICS signal. It is noted that the displacement profile FWHMs were generally larger than the measured axon diameters (0.27±0.07 µm under ideal conditions of high displacement resolution and fulfilling the SGPA), which may be a consequence of several factors (see Discussion).
Simulation of Synthetic Circular Axons
Figure 7 summarizes the simulation results of the synthetic circular axons. For circles of constant diameter and impermeable walls, the ICS-only simulations showed the expected diffraction minima for cylindrical pores (Callaghan, 1995) located at q·a ~ 1.22, where a is the axon mean diameter, but this diffraction minimum is gradually smeared out with increasing diameter variance. Diffraction minima correspond to the situation of maximal phase dispersion, which occurs at a specific q value that depends on pore size and shape. The ECS-only simulations never showed any diffraction pattern as expected. Figure 8 summarizes the simulation results of the synthetic ellipsoidal axons. A weak q-space diffraction pattern is visible as the ellipsoidal axon shape and area is constant in each input image. However, due to the random orientation of the ellipse axes, the diffraction pattern is not as pronounced as compared to the circular axons shown in Figure 7.
Figure 7.
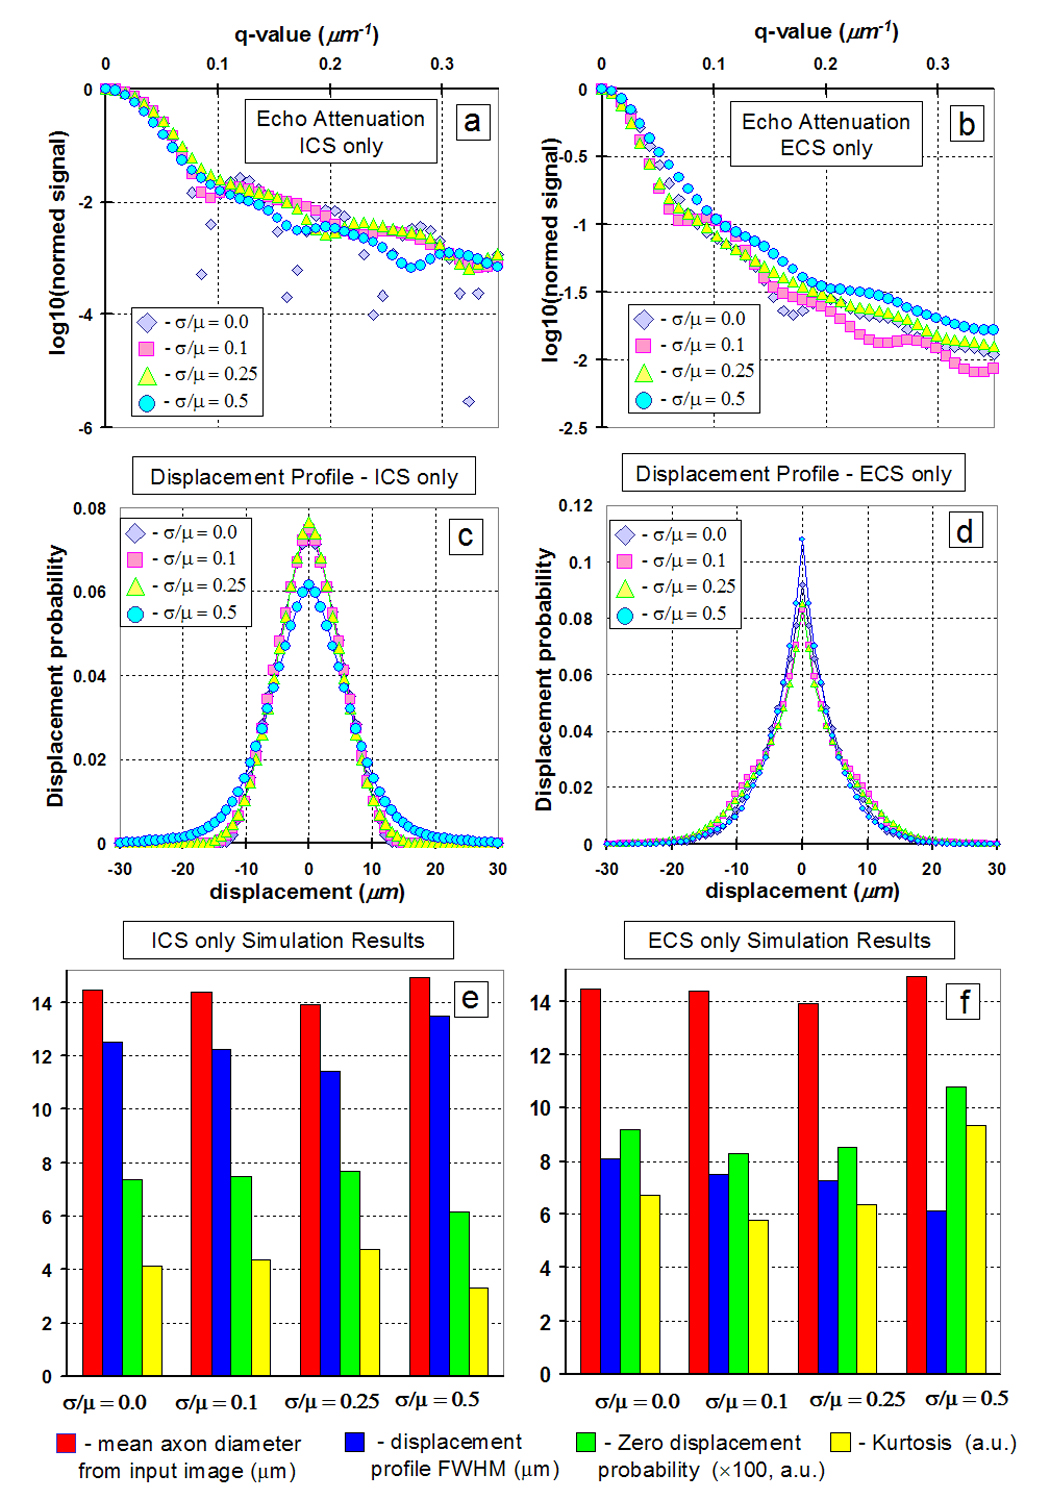
Summary of simulation results for synthetic circular axons of varying diameter mean and standard deviation ratios (µ and σ respectively). a) Echo attenuation for signal from ICS only. b) Echo attenuation for signal from ECS only. c) Displacement profile for signal from ICS only. d) Displacement profile for signal from ECS only. Mean axon diameter, FWHM, zero displacement probability, and kurtosis for e) signal from ICS only and f) signal from ECS only.
Figure 8.
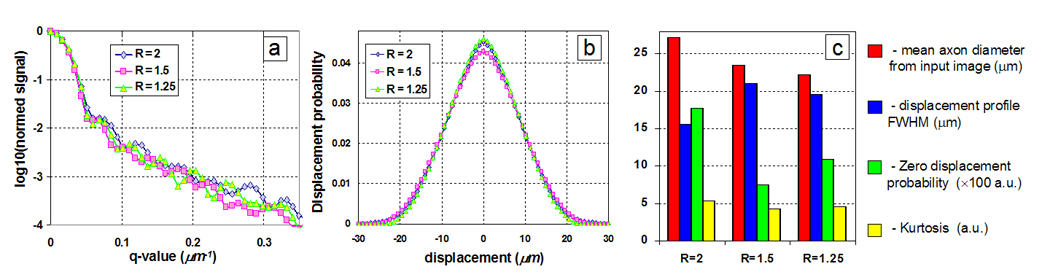
Summary of simulation results for synthetic ellipsoidal axons of varying diameter major and minor axis ratios (R). a) q-space echo attenuations and b) displacement profiles for synthetic c) Mean axon diameter, FWHM, zero displacement probability, and kurtosis.
As expected, with increasing axon size and shape distribution, the q-space diffraction pattern was smeared out. Supporting our experimental results, the axon geometry information seems to be exclusively captured by the ICS signal. Only the ICS-only displacement profile metrics correlated with the expected mean axon diameter (FWHM: r2 = 0.99, p = 0.0047, slope = 2.08; and kurtosis: r2 = 0.95, p = 0.027, slope = −2.89). This result suggests that, as long as the diffusion gradients are orthogonal to the WM tracts, QSI displacement profiles containing both ICS and ECS signals still retain information on axonal architecture.
Simulation of Histologic Images
Figure 9 summarizes the simulations results on the histologic images with axon diameters derived from histology. The FWHM increases, and zero-displacement probability and kurtosis decrease with increasing mean axon diameter in all plots, in excellent agreement with our experimental results. Note that simulated FWHM, zero-displacement probability and kurtosis showed the expected positive (r2 = 0.88, p = 0.0019, slope = −0.6, and r2 = 0.84, p = 0.0036, slope = −0.66 for ECS and ICS weighted simulations, respectively) and negative correlations (zero-displacement probability: r2 = 0.73, p = 0.0132, slope = −0.19 and r2 = 0.76, p = 0.01, slope = −0.23, for ECS and ICS weighted simulations, respectively; Kurtosis: r2 = 0.79, p = 0.0079, slope = −46 and r2 = 0.83, p = 0.0042, slope = −58, for ECS and ICS weighted simulations, respectively) with the average axon diameters calculated histology. Note further that simulated FWHM, zero-displacement probability and kurtosis showed high correlation between ICS weighted and ECS weighted simulations (r2 = 0.99, p < 0.0001, slope = 0.89, r2 = 0.996, p < 0.0001, slope = 0.84, and r2 = 0.99, p < 0.0001, slope = −0.81, respectively).
Figure 9.
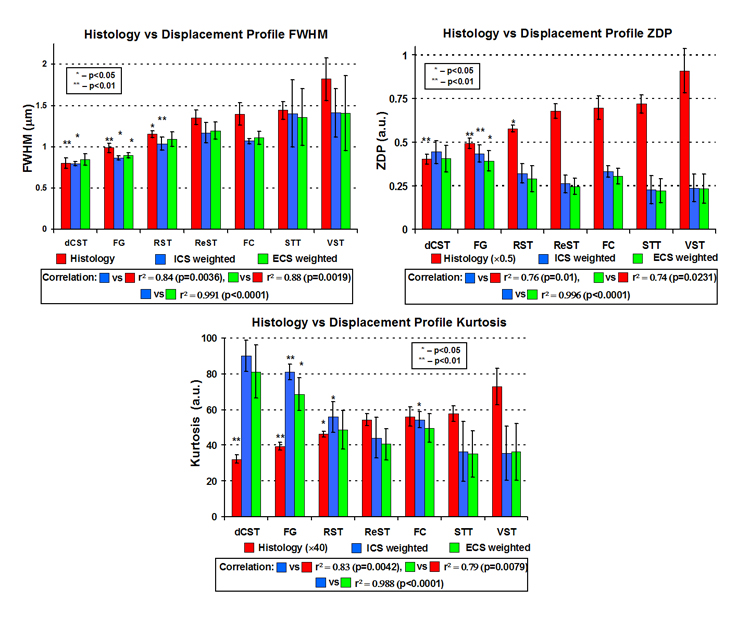
Summary plots of q-space simulations based on histologic images showing mean axon diameter calculated from histology, FHWM, zero-displacement probability (ZDP), and kurtosis values for each WM tract averaged over all five specimens under simulation conditions of ICS weighted signal and ECS weighted signal. Each asterisk represents the p-value of a paired t-test comparison with the next similar colored bar to the right.
Displacement profile metrics from both ECS-weighted and ICS-weighted simulations correlated with each other and showed virtually no difference between them. This result suggests that the QSI displacement characteristics dominated by the ICS signal, not because it has a longer T2, but rather because the ICS is more restricted than the ECS as it is believed (Assaf et al., 2004). In our work simulation and experimental results paralleled one another and any differences are probably due to uncertainties in our simulation parameters.
Discussion
Estimating Mean Axon Diameter with QSI
In highly regular porous structures, such as packed beads, the echo attenuation will exhibit diffraction peaks and pore geometry information can be directly read from the peaks (Callaghan et al., 1991). However, diffraction patterns in biological systems have only been observed in packed erythrocytes and not in tissues such as multi-axonal systems, possibly due to structural heterogeneity as our simulations suggest. Nevertheless, the displacement profile has provided insight into axonal architecture (Assaf et al., 2000; Chin et al., 2004; King et al., 1997). It is important to consider that the displacement profile is an empirical measurement. In order to interpret the features of the displacement profile, one must compare it with the underlying tissue structure as seen with histology in order to understand how the structures impede water diffusion.
Even though no attempt was made to separate ECS and ICS signals, our results showed excellent agreement with axon diameters calculated from histology. The displacement profile FWHMs overestimated the mean axon diameters by about 20% under optimal experimental conditions with respect to histology, except for the case of failing to fulfill the SGPA with high displacement resolution in which the FWHM is artifactually narrowed. Such an overestimation may result from insufficient displacement resolution. Our displacement resolution was 0.6 µm compared to axon diameters of 0.81–1.82 µm. Examination of the displacement profiles with high displacement resolution and fulfilling the SGPA shows that the central peak is, in most WM tracts, described by about five points and the true displacement profile shape may be hidden. The linear interpolation used to calculate the FWHM may not represent the true FWHM. Another possibility is that ECS diffusion, which is assumed to be Gaussian (Assaf et al., 2004), may broaden the displacement profiles as it is a superposition of both the ECS and ICS displacement profiles due to the linearity of the Fourier transform (Chin et al., 2004). We are currently investigating bi-modal fitting algorithms to separate the ECS and ICS displacement profiles. Finally, while membrane and myelin permeability will lead to a broader FWHM, there is evidence to suggest that exchange between the ECS and ICS compartments is virtually non-existent at the diffusion time of 10 ms (Meier et al., 2003; Sehy et al., 2002). Furthermore, our previous simulations on histologic images (Ong et al., 2006) indicated that the displacement profile FWHM remained stable over the range of permeability values reported for lipid bilayers (Disalvo, 1995).
Other investigators have used the root-mean-squared (RMS) displacement instead of the displacement profile FWHM to estimate the mean axon diameter (Assaf et al., 2002a; Assaf et al., 2000; Biton et al., 2005). The RMS displacement is calculated easily from the displacement profile FWHM by multiplying it by a factor of 0.425 (Cory and Garroway, 1990). However, this calculation is only valid under Gaussian diffusion. Following from our previous work (Chin et al., 2004), we use only the FWHM to estimate the mean axon diameter because the ICS water should be restricted (i.e. non-Gaussian) at our diffusion time.
Mean axon diameter information by itself would be of limited value. However, if it were coupled with information on ECS and ICS volume fractions, new insights into axonal architecture can be gained such as an estimate of the axon count, an important parameter in determining function after spinal cord injury (Schwartz et al., 2005b) or quantification of axon loss, which would affect the ECS and ICS volume fractions, and demyelination, which would increase the displacement profile FWHM, both of which are hallmarks of spinal cord injury and a variety of WM diseases from multiple sclerosis to Alzheimer’s disease (Budde et al., 2007; Horsfield and Jones, 2002). FWHM and zero-displacement probability have been observed to increase and decrease, respectively, in the presence of axon loss and demyelination (Assaf et al., 2002a), which we have also observed in ICS-weighted simulations of synthetic circular axons exhibiting only 10% axonal loss (data not shown). However, such metrics do not give a direct measurement of ECS and ICS volume fraction. ECS and ICS volume fraction estimates can be computed by fitting the echo attenuation curves to mathematical models (Assaf et al., 2006; Assaf et al., 2004). In another approach, Malmborg et al. recently proposed a model-free method of ECS and ICS volume fraction estimation based on varying the duration of the diffusion gradients (Malmborg et al., 2006). Such an approach sidesteps imposing model assumptions a priori and our laboratory is actively assessing this technique’s accuracy in estimating ECS and ICS volume fractions.
Comparison to Conventional Diffusion MRI Techniques
Recent work has used DWI to investigate regional axon architecture (Schwartz et al., 2005a; Schwartz et al., 2005b). Schwartz et al. performed ex vivo DWI of normal adult rat cervical spinal cords and computed transverse ADC (tADC) maps and longitudinal ADC (lADC) maps, i.e. ADC perpendicular and parallel to the WM fiber tract. Selecting several ROIs corresponding to different WM tracts, they compared the tADC and lADC values to parameters such as axon diameter, and ECS and ICS fractions derived from histology of the same WM tracts. Interestingly, in contrast to our QSI results, no correlation was found between tADC and axon diameter. Rather a positive correlation was found between tADC with ECS fraction and axon spacing, and negative correlations with axon count and myelin volume fraction. Such correlations are indicative of extra-cellular water mobility as the primary determinant of tADC, which is in agreement with the conjecture that signal attenuation at low diffusion encoding values (i.e. low b-values) is dominated by ECS water diffusion (Assaf et al., 2004).
Other studies also suggest that tADC is insensitive to the level of myelination. Takahashi et al. measured the tADC in vivo in the optic nerve of rats at various ages, as the level of myelination corresponds to maturity, and tADC was found to be constant across all ages (Takahashi et al., 2000). In contrast, Assaf et al. found that the displacement profile FWHM of rat spinal cords became smaller the more mature the rats were (Assaf et al., 2000). Furthermore, recent work (Budde et al., 2007) suggests that tADC and lADC, calculated from DTI, may not match the regional patterns of demyelination and axon loss as studied in vivo with spinal cords of mice induced with experimental autoimmune encephalomyelitis, an animal model for multiple sclerosis, as well as of mice with a contusion spinal cord injury.
Limitations and Further Applications of QSI
Although the advantages of QSI are many, we were able to construct specialized hardware that optimized signal acquisition for ex vivo imaging. In vivo QSI suffers from limitations of the signal to noise ratio (SNR), due to motion artifacts and scan time constraints, and maximum field gradient amplitude, leading to low displacement profile resolution that prevents satisfying the SGPA. Furthermore, in vivo spinal cord QSI of injury may be complicated by scar tissue deposition (Bilgen et al., 2007). While such drawbacks may limit the potential of QSI in vivo, QSI has nevertheless been applied successfully to image in vivo human brain and spinal cord (Assaf et al., 2002b; Farrell et al., 2007; Nilsson et al., 2007; Nordh et al., 2007). Our results suggest that, with current technology, QSI may estimate relative mean axon diameters, but be unable to estimate absolute mean axon diameters in vivo.
With our current hardware, QSI may also find applications in magnetic resonance microscopy (MRM) of neural tissues. Despite the need to image ex vivo, MRM could potentially provide information not available with destructive techniques due to its wide range of available contrasts including chemical shift, relaxation time, and dipolar coupling. It would be possible to compare those contrasts in images of neural tissues with axonal architecture as derived from QSI to evaluate their potential as indicators of axon integrity in order to find new contrasts to aid current in vivo work. A comparison with histology would have uncertainties due to its destructive nature. Contradictory reports suggest that histology has no affect (Schuz and Palm, 1989) and linearly decreases axon diameters (O'Kusky and Colonnier, 1982). However, tissue shrinkage is not expected for freshly excised or perfusion fixed tissues (Schuz and Palm, 1989). Comparison with QSI would therefore mitigate problems with tissue shrinkage and sample registration.
Conclusion
The present study has demonstrated the potential of QSI to assess variation in mean axon diameter in mouse spinal cord specimens non-destructively. Axon diameters calculated from ex vivo QSI show excellent agreement with diameters calculated from histology. Further experiments suggest that in vivo QSI may still detect relative mean axon diameter differences. Simulations on synthetic axons and histologic images showed that variations in axon size and shape as well as the presence of ECS and ICS signals did not affect the axon diameter measurements, thereby confirming our results. Furthermore, our simulations also suggest that the QSI experiment is weighted by the intra-cellular space signal, which contain the axon architecture information. QSI may serve as a tool to assess axonal architecture in both in vivo and MR microscopy applications and may lead to insights into WM pathology and injury. Future work will apply the current methodology to mice induced with experimental autoimmune encephalomyelitis in order to investigate the effects of demyelination and axon loss on QSI derived parameters.
Acknowledgements
The authors wish to thank Dr. Jeremy Magland and Dr. Qian-Chun Yu for their assistance in data analysis and histology preparation.
Footnotes
Publisher's Disclaimer: This is a PDF file of an unedited manuscript that has been accepted for publication. As a service to our customers we are providing this early version of the manuscript. The manuscript will undergo copyediting, typesetting, and review of the resulting proof before it is published in its final citable form. Please note that during the production process errors may be discovered which could affect the content, and all legal disclaimers that apply to the journal pertain.
References
- Assaf Y, Ben-Bashat D, Chapman J, Peled S, Biton IE, Kafri M, Segev Y, Hendler T, Korczyn AD, Graif M, Cohen Y. High b-value q-space analyzed diffusion-weighted MRI: application to multiple sclerosis. Magn Reson Med. 2002a;47:115–126. doi: 10.1002/mrm.10040. [DOI] [PubMed] [Google Scholar]
- Assaf Y, Blumenfeld T, Levin G, Yovel Y, Basser PJ. AxCaliber - a Method to Measure the Axon Diameter Distribution and Density in Neuronal Tissues. Proceedings of ISMRM 14th Scientific Meeting; Seattle, USA. 2006. p. 637. [Google Scholar]
- Assaf Y, Chapman J, Ben-Bashat D, Hendler T, Segev Y, Korczyn AD, Graif M, Cohen Y. White matter changes in multiple sclerosis: correlation of q-space diffusion MRI and 1H MRS. Magn Reson Imaging. 2005;23:703–710. doi: 10.1016/j.mri.2005.04.008. [DOI] [PubMed] [Google Scholar]
- Assaf Y, Freidlin RZ, Rohde GK, Basser PJ. New modeling and experimental framework to characterize hindered and restricted water diffusion in brain white matter. Magn Reson Med. 2004;52:965–978. doi: 10.1002/mrm.20274. [DOI] [PubMed] [Google Scholar]
- Assaf Y, Kafri M, Shinar H, Chapman J, Korczyn AD, Navon G, Cohen Y. Changes in axonal morphology in experimental autoimmune neuritis as studied by high b-value q-space (1)H and (2)H DQF diffusion magnetic resonance spectroscopy. Magn Reson Med. 2002b;48:71–81. doi: 10.1002/mrm.10183. [DOI] [PubMed] [Google Scholar]
- Assaf Y, Mayk A, Cohen Y. Displacement imaging of spinal cord using q-space diffusion-weighted MRI. Magn Reson Med. 2000;44:713–722. doi: 10.1002/1522-2594(200011)44:5<713::aid-mrm9>3.0.co;2-6. [DOI] [PubMed] [Google Scholar]
- Assaf Y, Mayzel-Oreg O, Gigi A, Ben-Bashat D, Mordohovitch M, Verchovsky R, Reider G, II, Hendler T, Graif M, Cohen Y, Korczyn AD. High b value q-space-analyzed diffusion MRI in vascular dementia: a preliminary study. J Neurol Sci. 2002c;203–204:235–239. doi: 10.1016/s0022-510x(02)00297-6. [DOI] [PubMed] [Google Scholar]
- Avram L, Assaf Y, Cohen Y. The effect of rotational angle and experimental parameters on the diffraction patterns and micro-structural information obtained from q-space diffusion NMR: implication for diffusion in white matter fibers. J Magn Reson. 2004;169:30–38. doi: 10.1016/j.jmr.2004.03.020. [DOI] [PubMed] [Google Scholar]
- Beaulieu C. The basis of anisotropic water diffusion in the nervous system - a technical review. NMR Biomed. 2002;15:435–455. doi: 10.1002/nbm.782. [DOI] [PubMed] [Google Scholar]
- Beucher S, Lantuejoul C. International Workshop on Image Processing (Real-time Edge and Motion Detection/Estimation) France: Rennes; 1979. Use of Watersheds In Contour Detection. [Google Scholar]
- Bilgen M, Al-Hafez B, Alrefae T, He YY, Smirnova IV, Aldur MM, Festoff BW. Longitudinal magnetic resonance imaging of spinal cord injury in mouse: changes in signal patterns associated with the inflammatory response. Magn Reson Imaging. 2007;25:657–664. doi: 10.1016/j.mri.2006.10.009. [DOI] [PubMed] [Google Scholar]
- Biton IE, Mayk A, Kidron D, Assaf Y, Cohen Y. Improved detectability of experimental allergic encephalomyelitis in excised swine spinal cords by high b-value q-space DWI. Exp Neurol. 2005;195:437–446. doi: 10.1016/j.expneurol.2005.06.011. [DOI] [PubMed] [Google Scholar]
- Budde MD, Kim JH, Liang HF, Schmidt RE, Russell JH, Cross AH, Song SK. Toward accurate diagnosis of white matter pathology using diffusion tensor imaging. Magn Reson Med. 2007;57:688–695. doi: 10.1002/mrm.21200. [DOI] [PubMed] [Google Scholar]
- Callaghan P. Principles of Nuclear Magnetic Resonance Microscopy. New York: Oxford University Press; 1993. [Google Scholar]
- Callaghan PT. Pulsed-Gradient Spin-Echo NMR for Planar, Cylindrical, and Spherical Pores under Conditions of Wall Relaxation. Journal of Magnetic Resonance, Series A. 1995;113:53–59. [Google Scholar]
- Callaghan PT. NMR imaging, NMR diffraction and applications of pulsed gradient spin echoes in porous media. Magn Reson Imaging. 1996;14:701–709. doi: 10.1016/s0730-725x(96)00152-x. [DOI] [PubMed] [Google Scholar]
- Callaghan PT, Coy A, MacGowan D, Packer KJ, Zelaya FO. Diffraction-like effects in NMR diffusion studies of fluids in porous solids. Nature. 1991;351:467–469. [Google Scholar]
- Callaghan PT, Komlosh ME, Nyden M. High magnetic field gradient PGSE NMR in the presence of a large polarizing field. J Magn Reson. 1998;133:177–182. doi: 10.1006/jmre.1998.1424. [DOI] [PubMed] [Google Scholar]
- Chin CL, Wehrli FW, Fan Y, Hwang SN, Schwartz ED, Nissanov J, Hackney DB. Assessment of axonal fiber tract architecture in excised rat spinal cord by localized NMR q-space imaging: simulations and experimental studies. Magn Reson Med. 2004;52:733–740. doi: 10.1002/mrm.20223. [DOI] [PubMed] [Google Scholar]
- Cohen Y, Assaf Y. High b-value q-space analyzed diffusion-weighted MRS and MRI in neuronal tissues - a technical review. NMR Biomed. 2002;15:516–542. doi: 10.1002/nbm.778. [DOI] [PubMed] [Google Scholar]
- Cory DG, Garroway AN. Measurement of translational displacement probabilities by NMR: an indicator of compartmentation. Magn Reson Med. 1990;14:435–444. doi: 10.1002/mrm.1910140303. [DOI] [PubMed] [Google Scholar]
- Disalvo EA. Permeability and Stability of Lipid Bilayers. London: CRC Press; 1995. [Google Scholar]
- Farrell, Jonathan Andrew David, Smith SA, Gordon-Lipkin E, Reich DS, Calabresi PA, van Zijl PC. q-Space Diffusion Weighted MRI of the Human Spinal Cord In Vivo: Application to Multiple Sclerosis. Proceedings of ISMRM 15th Scientific Meeting; Berlin, Germany. 2007. p. 270. [Google Scholar]
- Horsfield MA, Jones DK. Applications of diffusion-weighted and diffusion tensor MRI to white matter diseases - a review. NMR Biomed. 2002;15:570–577. doi: 10.1002/nbm.787. [DOI] [PubMed] [Google Scholar]
- Hwang SN, Chin CL, Wehrli FW, Hackney DB. An image-based finite difference model for simulating restricted diffusion. Magn Reson Med. 2003;50:373–382. doi: 10.1002/mrm.10536. [DOI] [PubMed] [Google Scholar]
- Jensen JH, Helpern JA, Ramani A, Lu H, Kaczynski K. Diffusional kurtosis imaging: the quantification of non-gaussian water diffusion by means of magnetic resonance imaging. Magn Reson Med. 2005;53:1432–1440. doi: 10.1002/mrm.20508. [DOI] [PubMed] [Google Scholar]
- King MD, Houseman J, Gadian DG, Connelly A. Localized q-space imaging of the mouse brain. Magn Reson Med. 1997;38:930–937. doi: 10.1002/mrm.1910380612. [DOI] [PubMed] [Google Scholar]
- King MD, Houseman J, Roussel SA, van Bruggen N, Williams SR, Gadian DG. q-Space imaging of the brain. Magn Reson Med. 1994;32:707–713. doi: 10.1002/mrm.1910320605. [DOI] [PubMed] [Google Scholar]
- Le Bihan D. Looking into the functional architecture of the brain with diffusion MRI. Nat Rev Neurosci. 2003;4:469–480. doi: 10.1038/nrn1119. [DOI] [PubMed] [Google Scholar]
- Malmborg C, Sjobeck M, Brockstedt S, Englund E, Soderman O, Topgaard D. Mapping the intracellular fraction of water by varying the gradient pulse length in q-space diffusion MRI. J Magn Reson. 2006;180:280–285. doi: 10.1016/j.jmr.2006.03.005. [DOI] [PubMed] [Google Scholar]
- Meier C, Dreher W, Leibfritz D. Diffusion in compartmental systems. II. Diffusion-weighted measurements of rat brain tissue in vivo and postmortem at very large b-values. Magn Reson Med. 2003;50:510–514. doi: 10.1002/mrm.10558. [DOI] [PubMed] [Google Scholar]
- Meyer F, Beucher S. Morphological segmentation. Journal of Visual Communication and Image Representation. 1990;1:21–46. [Google Scholar]
- Mitra P, Halperin B. Effect of finite gradient pulse width in pulsed gradient diffusion measurements. Journal of Magnetic Resonance, Series A. 1995;113:94–101. [Google Scholar]
- Nilsson M, Latt J, Rosquist H, Nordh E, Rydhog A, Brockstedt S, Stahlberg F. Dynamic Displacement in Human Brain Studied Using Q-Space Diffusion MRI at a 3T Clinical Scanner. Proceedings of ISMRM 15th Scientific Meeting; Berlin, Germany. 2007. p. 1531. [Google Scholar]
- Nordh E, Latt J, Nilsson M, Rydhog A, Brockstedt S, Stahlberg F. Does Changes in Gradient Duration Influence Q-Space-Based Determinations of Displacements In Vivo. Proceedings of ISMRM 15th Scientific Meeting; Berlin, Germany. 2007. p. 1532. [Google Scholar]
- O'Kusky J, Colonnier M. A laminar analysis of the number of neurons, glia, and synapses in the adult cortex (area 17) of adult macaque monkeys. J Comp Neurol. 1982;210:278–290. doi: 10.1002/cne.902100307. [DOI] [PubMed] [Google Scholar]
- Ong HH, Saha PK, Schwartz ED, Wehrli FW. Q-Space Simulations on Mouse Spinal Cord White Matter Tract Histologic Images. Proceedings of ISMRM 14th Scientific Meeting; Seattle, USA. 2006. p. 3469. [Google Scholar]
- Pal NR, Pal SK. A review of image segmentation techniques. Pattern Recognition. 1993;26:1277–1294. [Google Scholar]
- Peled S, Cory DG, Raymond SA, Kirschner DA, Jolesz FA. Water diffusion, T(2), and compartmentation in frog sciatic nerve. Magn Reson Med. 1999;42:911–918. doi: 10.1002/(sici)1522-2594(199911)42:5<911::aid-mrm11>3.0.co;2-j. [DOI] [PMC free article] [PubMed] [Google Scholar]
- Schuz A, Palm G. Density of neurons and synapses in the cerebral cortex of the mouse. J Comp Neurol. 1989;286:442–455. doi: 10.1002/cne.902860404. [DOI] [PubMed] [Google Scholar]
- Schwartz ED, Cooper ET, Chin CL, Wehrli S, Tessler A, Hackney DB. Ex vivo evaluation of ADC values within spinal cord white matter tracts. AJNR Am J Neuroradiol. 2005a;26:390–397. [PMC free article] [PubMed] [Google Scholar]
- Schwartz ED, Cooper ET, Fan Y, Jawad AF, Chin CL, Nissanov J, Hackney DB. MRI diffusion coefficients in spinal cord correlate with axon morphometry. Neuroreport. 2005b;16:73–76. doi: 10.1097/00001756-200501190-00017. [DOI] [PubMed] [Google Scholar]
- Sehy JV, Banks AA, Ackerman JJ, Neil JJ. Importance of intracellular water apparent diffusion to the measurement of membrane permeability. Biophys J. 2002;83:2856–2863. doi: 10.1016/S0006-3495(02)75294-6. [DOI] [PMC free article] [PubMed] [Google Scholar]
- Stejskal EO, Tanner JE. Spin Diffusion Measurements: Spin Echoes in the Presence of a Time-Dependent Field Gradient. J Chem Phys. 1965;42:288–292. [Google Scholar]
- Takahashi M, Ono J, Harada K, Maeda M, Hackney DB. Diffusional anisotropy in cranial nerves with maturation: quantitative evaluation with diffusion MR imaging in rats. Radiology. 2000;216:881–885. doi: 10.1148/radiology.216.3.r00se41881. [DOI] [PubMed] [Google Scholar]
- Torres AM, Michniewicz RJ, Chapman BE, Young GA, Kuchel PW. Characterisation of erythrocyte shapes and sizes by NMR diffusion-diffraction of water: correlations with electron micrographs. Magn Reson Imaging. 1998;16:423–434. doi: 10.1016/s0730-725x(98)00005-8. [DOI] [PubMed] [Google Scholar]
- Tuch DS, Reese TG, Wiegell MR, Wedeen VJ. Diffusion MRI of complex neural architecture. Neuron. 2003;40:885–895. doi: 10.1016/s0896-6273(03)00758-x. [DOI] [PubMed] [Google Scholar]
- Wedeen VJ, Hagmann P, Tseng WY, Reese TG, Weisskoff RM. Mapping complex tissue architecture with diffusion spectrum magnetic resonance imaging. Magn Reson Med. 2005;54:1377–1386. doi: 10.1002/mrm.20642. [DOI] [PubMed] [Google Scholar]
- Wright AC, Bataille H, Ong HH, Wehrli SL, Chin CL, Wehrli FW. Construction and Calibration of a 50 T/m Z-Gradient Coil for q-Space Microscopy. Journal of Magnetic Resonance. 2007;186:17–25. doi: 10.1016/j.jmr.2007.01.011. [DOI] [PMC free article] [PubMed] [Google Scholar]