Abstract
Visual search and identification of analyzable metaphase chromosomes using optical microscopes is a very tedious and time-consuming task that is routinely performed in genetic laboratories to detect and diagnose cancers and genetic diseases. The purpose of this study is to develop and test a computerized scheme that can automatically identify chromosomes in metaphase stage and classify them into analyzable and un-analyzable groups. Two independent datasets involving 170 images are used to train and test the scheme. The scheme uses image filtering, threshold, and labeling algorithms to detect chromosomes, followed by computing a set of features for each individual chromosome as well as for each identified metaphase cell. Two machine learning classifiers including a decision tree (DT) based on the features of individual chromosomes and an artificial neural network (ANN) using the features of the metaphase cells are optimized and tested to classify between analyzable and un-analyzable cells. Using the DT based classifier the Kappa coefficients for agreement between the cytogeneticist and the scheme are 0.83 and 0.89 for the training and testing datasets, respectively. We apply an independent testing and a two-fold cross-validation method to assess the performance of the ANN-based classifier. The area under and receiver operating characteristic (ROC) curve is 0.93 for the complete dataset. This preliminary study demonstrates the feasibility of developing a computerized scheme to automatically identify and classify metaphase chromosomes.
Keywords: Artificial neural network, Decision tree, Metaphase chromosomes, Microscopic digital images
I. Introduction
Since Tjio and Levan discovered that the chromosome number of human being was 46 in 1956 [1], the knowledge about chromosomal abnormalities, as a cause of diseases, increased enormously. For example, in 1960 Nowell and Hungerford discovered a small chromosome marker, the Philadelphia chromosome, in patients with chronic myeloid leukemia (CML) [2]. This is proved to be the first consistent chromosomal abnormality in human cancer and it greatly stimulated interest in cancer cytogenetics. Currently, identification and classification of chromosomes using optical microscopic images is an important laboratory and clinical procedure to screen and diagnose genetic disorders [3], cancers [4, 5] and other diseases [6]. Specifically, chromosome abnormalities and mutations are the results of changes in chromosome structure. Studies have found that consistent chromosomal changes led to isolation of the genes involved in the cancer pathogenesis [7]. Detection of these consistent, recurrent chromosomal changes has allowed the division of patients into clinical groups which define their duration of remission and mean survival time [8]. Hence, better understanding the mechanism of abnormal chromosome can help oncologists evaluate cancer prognosis and select more effective treatment procedures. For this purpose, karyotyping of metaphase cells is the most common procedure to analyze and classify chromosomes [9]. This procedure requires generating a layout of chromosomes organized by decreasing size in pairs for each testing cell by the comparison between the chromosomes identified in the cell and the chromosomes stored in a pre-established standard database. Chromosomes are assigned to each of the 24 classes [10]. Then, variety of diseases, genetic disorders, and cancers, can be diagnosed based on the possible distortion of the banded patterns of different chromosome pairs [11].
Before performing karyotyping and other diagnostic procedures, a cytogenetic technologist uses an optical microscope to visually examine each glass slide prepared from samples (i.e., amniotic fluid, blood sample, skin or bone marrow) acquired from a patient to search for and identify the cells with analyzable chromosomes. Because the cells are very small (in the order of a few hundred micrometers), the technologist must move the slide under the microscope many times to thoroughly search the entire slide and frequently switch between two microscopic objectives of low (e.g., 10X) and high magnification power (e.g., 100X). It is desirable to find at least 20 to 30 analyzable metaphase chromosome cells for each patient. Since, not all cells are engaged in cell division and not all dividing cells are in the analyzable metaphase stage, the technologist must look at a large number of cells before a cell with clearly imaged chromosomes can be found. Figure 1 demonstrates two metaphase chromosome cells, one is considered analyzable and one is un-analyzable by an experienced cytogeneticist. In the clinical practice, examining as many as 5 to 10 microscopic sample slides is typically needed for one patient. Therefore, it takes tremendous effort and time for the technologist to obtain a sufficient number of analyzable metaphase cells before making an accurate laboratory diagnosis of abnormal human chromosomes that have been altered by disease or cancer mechanisms. This lengthy and inefficient process can also cause delay to the treatment of patients. Therefore, developing a computerized scheme could potentially significantly speed up the process of searching for and identifying analyzable chromosomes. It may also help cytogeneticists improve the diagnostic performance and minimize inter- and intra-reader variability.
Figure 1.
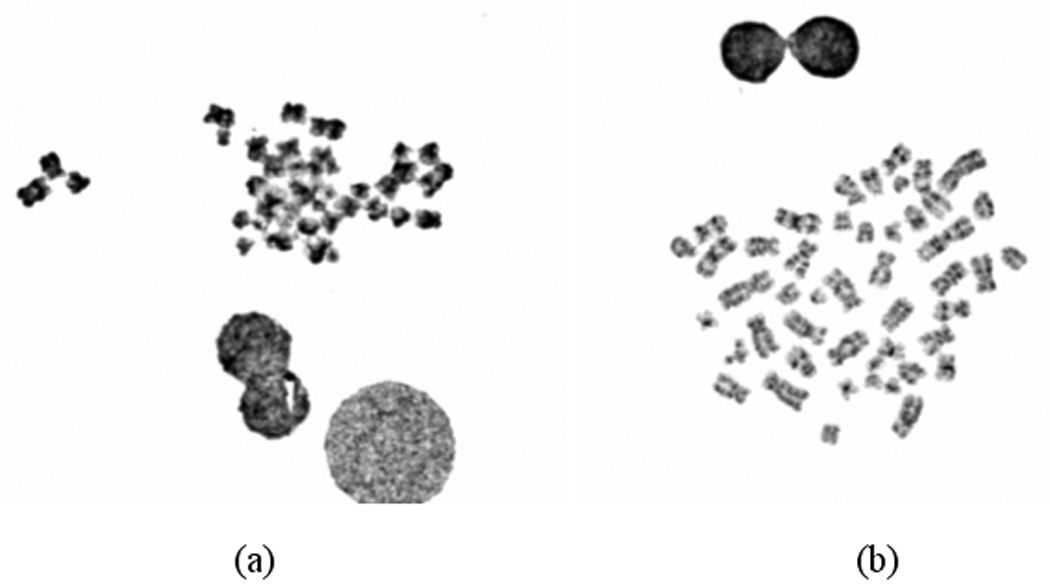
Digital images of two metaphase chromosome cells in which (a) is considered un-analyzable cells that will be deleted and (b) is an analyzable cell that will be selected to perform karyotyping.
Since 1980s a number of research groups has developed and tested different computerized schemes to analyze chromosome images including identifying analyzable metaphase cells, separating overlapped chromosomes, classifying different chromosomes (karyotyping), and detecting abnormal patterns depicted on the chromosomes. The detailed discussion of the previous studies (including the advantages and limitations of these studies) has been reported in a previously published review article [12]. For examples, one study developed an Athena system to semi-automatically identify analyzable metaphase chromosomes [13]. The second study reported an automated karyotyping system (AKS) using a novel recursive searching algorithm [14]. The third study developed a scheme to recognize metaphase spreads from nuclei and artifacts in microscopic images acquired at 10X magnification power with approximately 91% recognition rate [15]. The fourth study developed an automatic metaphase finder and reported a true positive rate of 80% with a false positive rate of 20% [16]. The fifth group used texture features to classify manually segmented objects into metaphase spreads with approximately true positive rate of 85% [17]. The sixth group applied a wavelet-based algorithm to improve the salient features of chromosome images for the better diagnosis [18]. This group also developed and reported a subspace-based model to classify chromosomes into 24 types after applying the semi-automated methods to pre-process all individual chromosomes (including straightening the bending chromosomes and identifying the orientation of p-arm of each chromosome) [19]. In addition, different statistical models and machine learning classifiers (i.e., artificial neural network and probabilistic Markov network) based on an optimal feature vector or pixel value distribution have been trained and implemented in computerized schemes to detect (or identify) abnormal patterns of chromosomes [20–23]. The success of the schemes for detecting chromosomal aberrations depends on several pre-conditions including that the analyzable metaphase chromosomes have been identified and the individual chromosomes have been separated (without overlapping) and correctly oriented (i.e., straightening the bending chromosomes and knowing p-arms). As a result, when applying these schemes to real clinical images, human intervention is often required to select analyzable chromosomes [24]. For examples, since early 1990s, several research groups have tested the feasibility of applying the semi-automated computer systems to detect aberrant chromosomes in different clinical images [25, 26].
Despite the considerable research effort in developing computerized schemes to analyze chromosome images, one of the most importantly clinical issues of how to automatically and robustly detecting and identifying analyzable metaphase chromosomes depicted on the original microscopic sample slides remains un-solved. As a result, the technologists in genetic laboratories still visually search for and identify analyzable metaphase chromosomes in the routine clinical practice to date. In this study, we focused on developing and testing a new automated scheme to identify metaphase chromosome cells depicted on microscopic digital images and to classify them into analyzable and un-analyzable cells. The purpose of this study is to develop a simple and robust scheme that has potential analyzable to replace the time-consumed visual searching process. This scheme can also be the first and important step in developing other fully-automated schemes for chromosome image analysis and diagnosis.
II. Materials and Methods
From a clinical database established at a genetic laboratory of University of Oklahoma Health Science Center, a cytogeneticist randomly selected 100 metaphase cells as one dataset (which was later used as a training dataset) and then selected another dataset involving 70 metaphase cells (a testing dataset). An optical microscope equipped with an objective of 100X magnification power and a digital camera was used to acquire digital images of these selected metaphase chromosome cells. These images have average size of 768 ×576 pixels and the size of each pixel on the surface of the slides is approximately 0.2µm × 0.2µm. In the training dataset, 35 cells are considered (visually recognized as) analyzable and 65 are un-analyzable by the cytogeneticist. In the test dataset, 37 cells are analyzable and 33 are un-analyzable, respectively. These visual classification results were saved in a “truth” file that is used as a standard to train our computerized scheme and test its performance.
Our computerized scheme includes five image processing and feature classification stages to segment chromosome areas and to identify analyzable metaphase cells (Fig. 2). First, the scheme uses an image filter to pro-process the images that aims to enhance the image quality (i.e., increase signal-to-noise ratio). Because a median filter is a simple and effective filter to reduce random image noise while preserving image sharpness (minimizing image blurring) [27], we implement a median filter (with window size of 5 × 5 pixels) in the scheme to reduce the noise and artifact background in the originally digital chromosome images. Second, an adjustable threshold is applied to remove all pixels with gray (digital) values smaller than the threshold (because chromosomes in metaphase stages usually have greater gray value than majority of artifacts in the background). Third, a 4-connectivity component labeling algorithm and a raster scanning method are applied to label and group the detected pixels into connected areas and delete the isolated pixels. The rationale of selecting the 4-connectivity component labeling algorithm is because it is less sensitive to the image noise (or broken pixels) comparing to other labeling algorithm (e.g., 8-connectivtity component labeling algorithm) [27]. Fourth, the scheme computes following five image features from the labeled regions in each microscopic digital image.
The number of labeled regions: The scheme counts the total number of labeled regions (NM) in one image slide.
The size of each labeled region: It is defined by counting the number of pixels involved in the region (Si = NM).
The circularity of each labeled region: Based on the size of the region (NM), the scheme defines an equivalent circle originating at the gravity center of the region. For a circle with the same size as the labeled region, the scheme computes the number of pixels that are located inside the region contour and the circle (NC). The circularity is defined as , the ratio of the region pixels covered by the circle and the total pixels inside the labeled region [28].
Average gray value of each labeled region: It is computed as an average digital value of pixels .
The radial length of each region to the cell center: It is defined as the distance between the gravity center (xc, yc) of total labeled regions in the image (center of a cell) and the center of one individual region (xk, yk). It is computed as .
In these five features, feature #1 is global feature of the metaphase cell and the rest of four features are computed for each individual chromosome.
Figure 2.
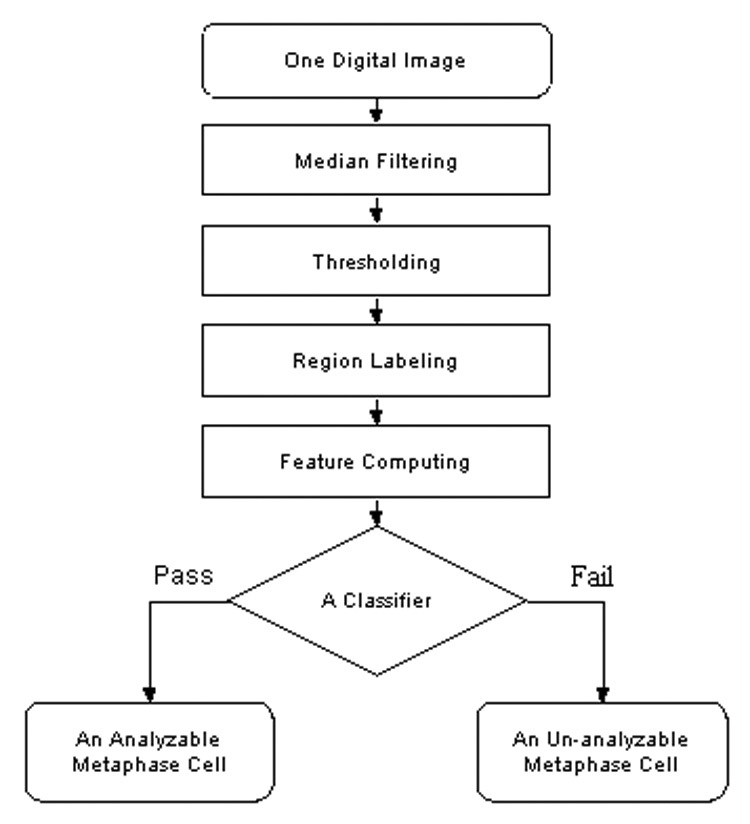
A flow diagram of a computerized scheme to segment chromosomes and classify metaphase cells into analyzable and un-analyzable cells.
In the last stage of the scheme, a machine learning classifier is applied to identify analyzable metaphase chromosomes and delete un-analyzable ones. Two classifiers, a decision tree (DT) and an artificial neural network (ANN), are optimized and tested in this study. DT is one of the most widely used and practical methods for inductive inference, which approximates discrete-valued functions that is robust to noisy data and is capable of learning disjunctive expressions. ANN is loosely motivated by biological neural systems to learn the real-valued and discrete-valued functions from noisy or incomplete samples. In particular, the training algorithm of back-propagation using gradient descent can turn ANN parameters to best fit a training set of input-output pairs. The limitations of these two classifiers include potentially inductive bias for DT and over-fitting for ANN. The detailed mathematic foundations and characteristics (including advantages and limitations) of DT and ANN can be found elsewhere [29]. Despite the potential limitations, DT and ANN are two of the most popular machine learning classifiers implemented in the computerized schemes for biomedical images including chromosome images [12].
DT implemented in this study is constructed based on the five computed features and used to classify which digital image depicts an analyzable metaphase chromosome cell or not. The structure of the DT is demonstrated in Figure 3. This DT uses a simple classification criterion: analyzable metaphase chromosome cells contain more recognizable individual chromosomes than un-analyzable cells. The DT includes four (horizontal) layers (rows). The first layer includes a start node. The five computed images features are connected to the five nodes listed in the second row. The first node in this row is the number of labeled regions. If the number of regions is less than a threshold value (that is determined by the training dataset), this chromosome image is defined as not analyzable. Only the images depicted the labeled chromosomes (regions) within the range between Nmin = 19 and Nmax = 46 are further analyzed by the following nodes of the DT. Node 2 is the size of each labeled (individual) region and it aims to delete some very large connected areas (e.g., S > Smax = 5000) and very small regions (e.g., S < Smin = 90) in each image. Node 3 is the circularity of the region and it is designed to delete the circled regions (e.g., a nucleus) if the circularities are larger than a predetermined threshold (e.g., C > CT = 0.90). Node 4 is average gray level of the region and it is used to delete the regions dominated with dirty substances or cells in each image. In general, the gray value of chromosomes is larger than those dirty substances and cells. Hence, if the average gray level of a region is smaller than the threshold (e.g., Iave > IT = 75), the region is deleted. Node 5 is the radial length of the region and it deletes the labeled regions that are far away from the center of the cell or cluster (e.g., L ≥ Lk = (maximum radial length – standard deviation of radial length of all labeled regions)). Since in each of nodes 2 to 5, the DT may delete a number of labeled regions and result in the reduction of the total number of regions remained in one image, this image (or cell) is analyzed again based on the number of remaining regions (similar to the node 1) in the third layer (row) of the tree. The last (fourth) layer contains a number of decision nodes.
Figure 3.
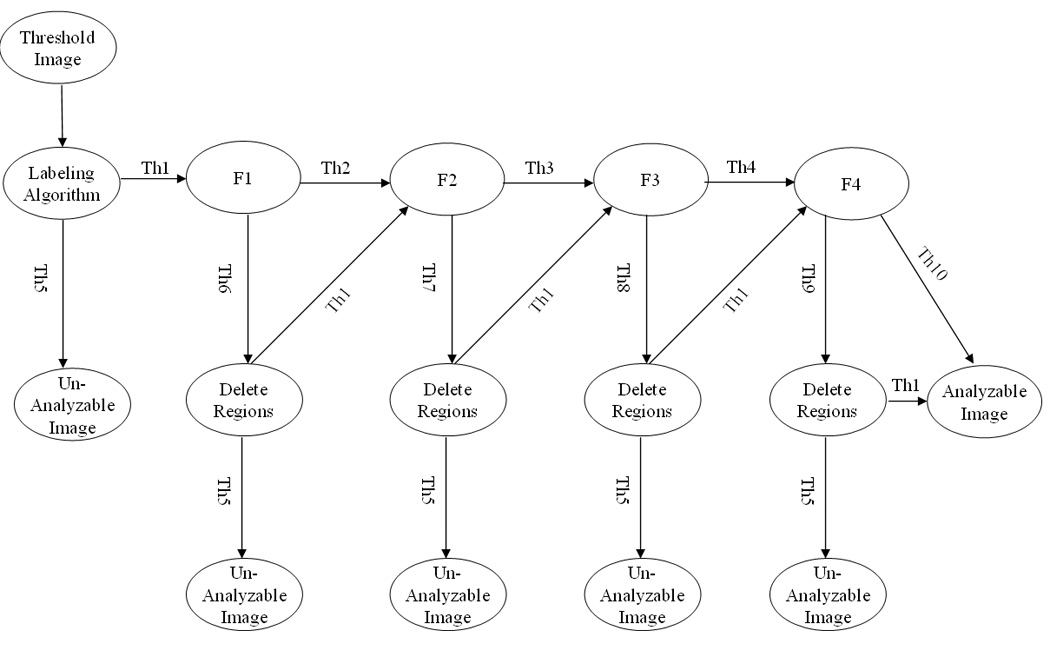
A five-feature based DT for recognizing analyzable and un-analyzable metaphase chromosome cells. Note: F1 – Average size of each region; F2 – Circularity of each region; F3 – Average gray value of each region; F4 – Radial length of each region; Th1 - Number of regions is between Nmin = 19 and Nmax = 46; Th2 – Average size of each region is between Smin = 90 and Smax = 5000; Th3 – Circularity of each region is < CT = 0.9; Th4 - Average gray value of each region is ≥ IT = 75; Th5 - Number of regions is either < Nmin = 19 or > N max = 46; Th6 - Average size of each region is either <Smin = 90 or >S max = 5000; Th7 - Circularity of each region is ≥ CT = 0.9; Th8 - Average gray value of each region is < IT = 75; Th9 - Radial length of each region is ≥ Lk (the maximum radial length – standard deviation of radial length of all labeled regions); and Th10 - Radial length of each region is < Lk.
The second classifier tested in this study is an ANN. Unlike the DT (Fig. 3) that uses the features computed from the individual chromosomes, the ANN only uses the features computed from all labeled regions in one acquired image region of interest (ROI). The ANN has a simple three-layer feed-forward topology. The input layer includes six neurons that are represented by six features, which are (1) the number of labeled regions; (2) the average size of all labeled regions; (3) the standard deviation of region size; (4) the average pixel value of all regions; (5) the standard deviation of pixel values; and (6) the average radial length of all regions. The hidden layer of the ANN involves three neurons and the output layer contains one decision neuron. A standard back-propagation training algorithm is used to train the ANN. Due to the limited size of our training dataset and in order to minimize over-fitting and keep the robustness of the ANN performance when applied to new testing cases, a limited number of training iterations as well as a large ratio between the momentum and learning rate is used [30]. Hence, we limit the training iterations to 400; while the momentum and learning rate are set at 0.9 and 0.01, respectively. For each training or testing sample (chromosome cell), the ANN generates a classification score in the range from 0 to 1, where 0 means definitely un-analyzable and 1 indicates easily analyzable.
Different methods are applied to assess the performance of two classifiers. When using DT, we tabulated the experimental data and computed the Kappa coefficients for agreement of the classification results between the cytogeneticist and the computerized scheme. The performance of using ANN to classify metaphase chromosome cells is evaluated using receiver operating characteristics (ROC), a standard method widely used to evaluate the performance of observers and computerized schemes in diagnosis and analysis of biomedical images [31]. A computer program converts the ANN-generated classification scores of all analyzable (“positive”) and un-analyzable (“negative”) samples in one dataset (either training or testing) into two histograms with 11 bins. Based on these two histograms (one for positive cases and one for negative cases), an un-smoothed ROC type performance curve can be plotted. ROCFIT program [32] that uses maximum likelihood estimation method [33] is then used to fit ROC data (curve) and compute an area under the ROC curve (AZ value), an index to measure the scheme performance. Because two datasets were independently selected and size of each dataset is relatively small, two datasets may have substantially different distribution of image feature characteristics. To better estimate the performance of our scheme and minimize the potential bias when using an ANN as a classifier, we also applied a two-fold cross validation method to assess scheme performance. We trained and tested the ANN twice by switching between training and testing dataset, which means that each of two datasets is used once for training and once for testing. The testing classification score of each cell region is used to generate the final ROC curve for the complete dataset using ROCFIT program.
III. Results
The difference of classification results between the “truth” (provided by the cytogeneticist) and the DT based scheme for both training and testing datasets is summarized and compared (as shown in Table I and Table II). The results indicate that 92.0% (92 out of 100) and 94.3% (66 out of 70) of queried cell regions in the training and testing datasets are assigned to the same group (either “analyzable” or “un-analyzable”) by both the cytogeneticist in our genetic laboratory and DT based classifier. The corresponding Kappa coefficients for agreement are 0.83 and 0.89 for the training and testing datasets, respectively. Specifically, the DT based scheme achieves 94.3% (33 out of 35) of detection sensitivity (“true-positive” classification rate) and 90.8% (59 out of 65) of specificity (“true-negative” classification rate) for the training dataset. For the testing dataset, the sensitivity and specificity are 91.9% (34 out of 37) and 96.9% (32 out of 33), respectively.
Table I.
Comparison of classification results between a cytogeneticist and the DT based scheme for training dataset.
| Data classified by a cytogeneticist | DT based scheme | DT Accuracy Rate | ||
|---|---|---|---|---|
| Correct | Wrong | |||
| Analyzable cells | 35 | 33 | 2 | 94.3% |
| Un-analyzable cells | 65 | 59 | 6 | 90.8% |
| Total cells | 100 | 92 | 8 | 92.0% |
Table II.
Comparison of classification results between a cytogeneticist and the DT based scheme for testing dataset.
| Data classified by a cytogeneticist | DT based scheme | DT Accuracy Rate | ||
|---|---|---|---|---|
| Correct | Wrong | |||
| Analyzable cells | 37 | 34 | 3 | 91.9% |
| Un-analyzable cells | 33 | 32 | 1 | 96.9% |
| Total cells | 70 | 66 | 4 | 94.3% |
To verify the feature distribution difference between two datasets, we plotted a series of scatter diagrams between different pairs of features. For example, the scatter diagrams between the features of average pixel values and the number of labeled regions are shown in Figure 4 and Figure 5 for the original training and testing dataset. For these two features the analyzable cells are mostly located in the upright corner of the diagram (which indicated the larger number of labeled regions and higher pixel right value). Comparing between Figure 4 and Figure 5, we find that in the initial training dataset used for DT based classifier; several un-analyzable cells also involve larger number of labeled regions and higher average pixel values. These “difficult” un-analyzable cells reduce the classification performance of the ANN when applying to this dataset comparing to the classification performance on the initial testing dataset (as shown in Figure 6). A ROC curve generated based on complete dataset using two-fold cross validation method is also plotted in Figure 6. The computed AZ values (the areas under ROC curve) are 0.918 ± 0.015, 0.942 ± 0.013, and 0.930 ± 0.008, for the original training, testing, and complete dataset, respectively.
Figure 4.
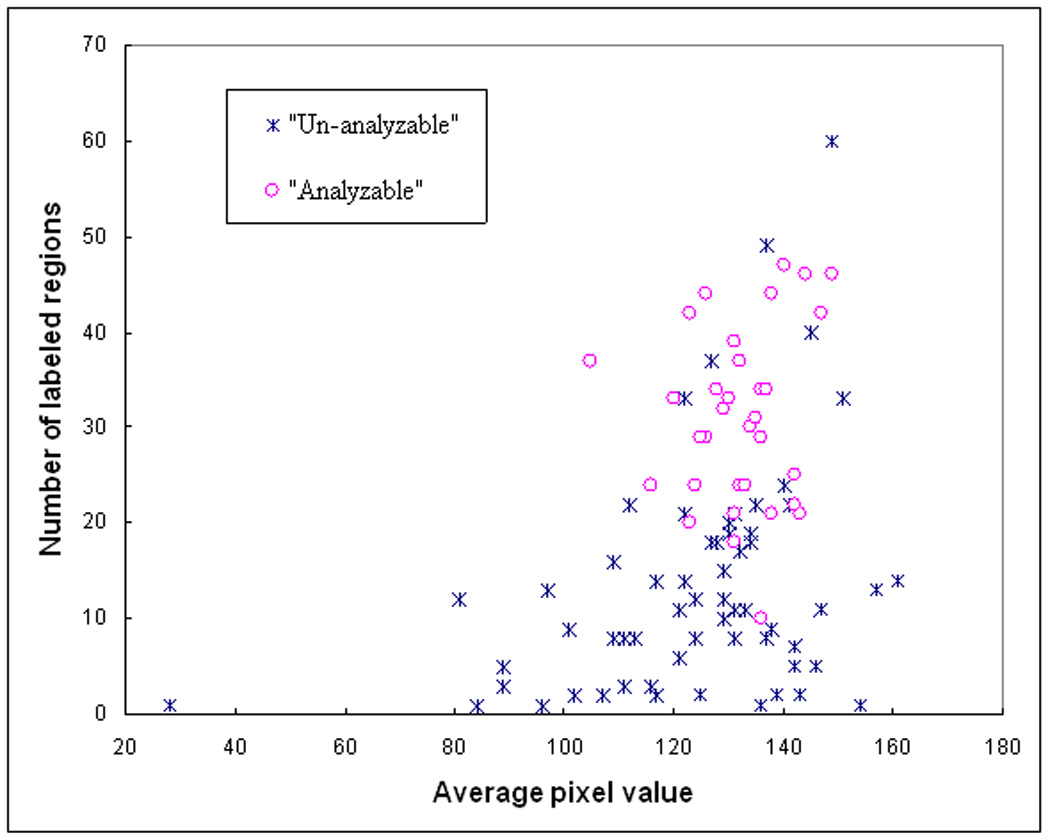
A scatter diagram between two features of 100 training samples including 35 analyzable (“positive”) and 65 un-analyzable (“negative”) cells.
Figure 5.
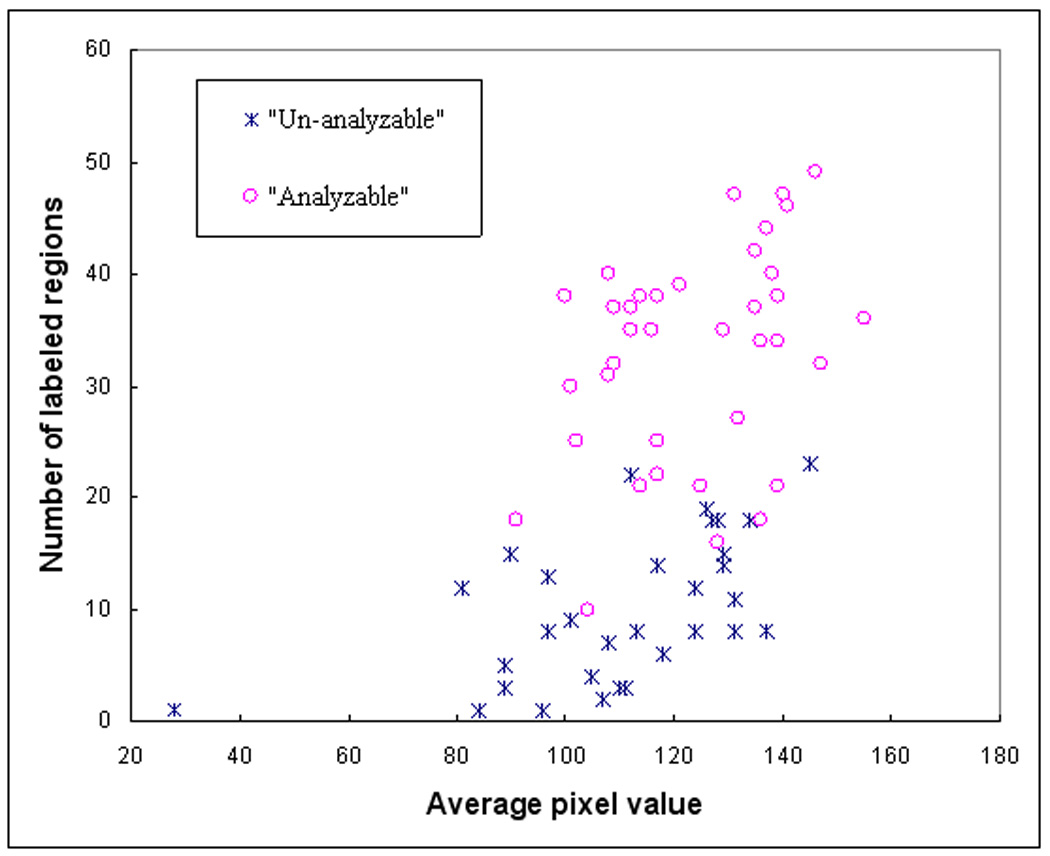
A scatter diagram between two features of 70 testing samples including 37 analyzable (“positive”) and 33 un-analyzable (“negative”) cells.
Figure 6.
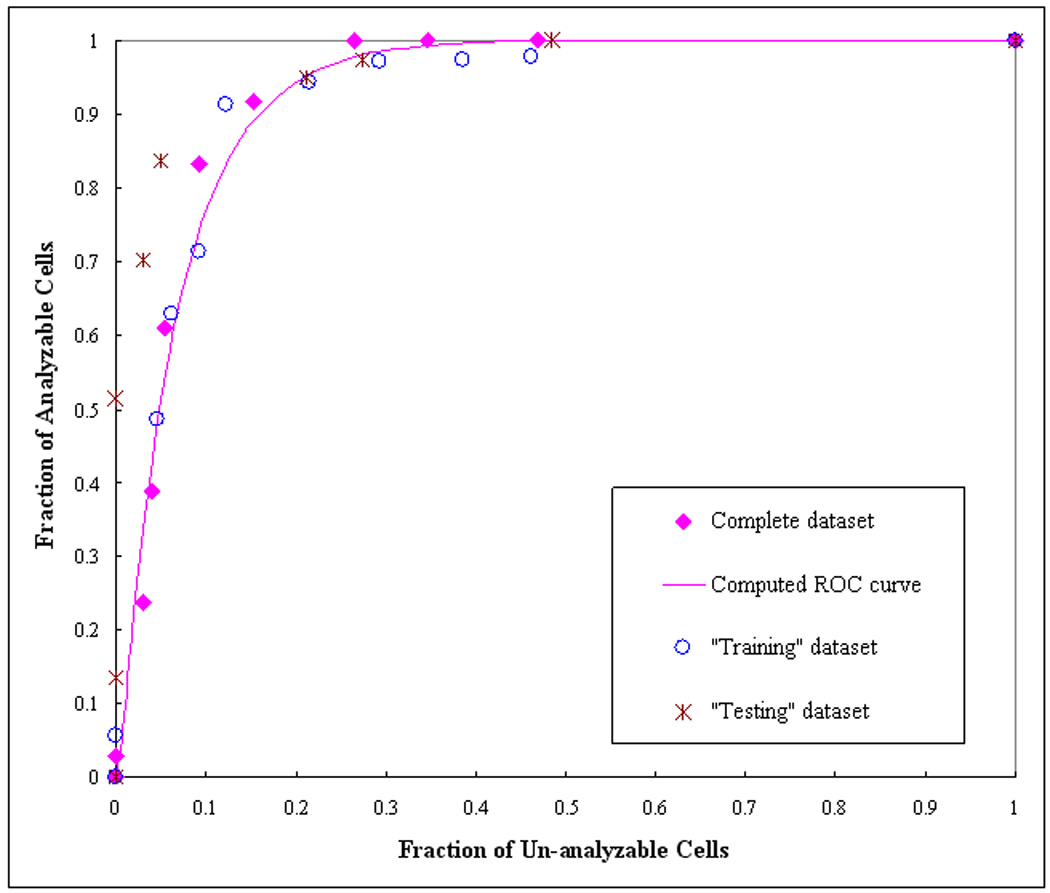
The distribution of the computed performance points for two data subsets (“training” and “test” subsets) and the complete dataset. A ROC-type performance curve was generated based on fitting of the complete dataset using ROCFIT program.
IV. Discussion
Because of its advantages and effectiveness over traditionally anatomical imaging modalities and techniques in detecting cancers and monitoring cancer treatment efficacy, molecular and chromosome imaging have been attracted extensive research interests. Chromosomal disorder is a powerful indicator in diagnosis of cancers (i.e., leukemia, skin and breast cancers) and other genetic diseases. Although identification of chromosomal aberrations (disorders) is routinely performed in the clinical laboratories to provide physicians the diagnostic results and help them decide and manage optimal therapeutic treatment plans for patients, this is a very tedious and time-consuming task. Currently, the laboratory technologists spend more valuable time to identify analyzable metaphase chromosome cells, rather than spend time to identify and analyze the chromosomal abnormal patterns. Our previous study has demonstrated that using computerized scheme could potentially help clinicians more efficiently and accurately diagnose (classify) different types of leukemia and predict the cancer prognosis [34]. However, the precondition of accurate diagnosis of cancers and genetic diseases using chromosome images is to identify a set of analyzable (or diagnosable) metaphase chromosome cells. In addition, developing a fully-automated scheme to detect and identify analyzable metaphase chromosome cells is the first and probably the most important step to replace tediously manual searching process. Therefore, the motivation and purpose of this study is to develop a computerized scheme that has potential to replace the manual searching process and meet the requirement of other semi-automated schemes in chromosome classification by automatically identifying analyzable metaphase chromosomes depicted on microscopic digital images.
For this purpose, we developed and tested a simple and unique computerized scheme. The scheme was directly optimized and applied to the originally cultured chromosome images used for the standard (or banded) chromosome analysis routinely performed in our genetic laboratory for the diagnosis of cancers and genetic diseases. This approach of using real clinical images without pre-processing increases the application potential and robustness of our scheme in the clinical environment. We are aware that when different cultured or sample preparation methods are used in different laboratories for different diagnostic purpose, the banded patterns of the chromosomes could be different. However, this does not affect our scheme to detect and identify analyzable metaphase chromosomes because no specific band features and absolute size features of individual chromosomes are used in our scheme. Our scheme was also applied to the high-resolution (or high-magnification) microscopic digital images. Comparing with previously reported studies using low-resolution images, which could only alert the laboratory technologists the location of potentially analyzable chromosome cells and visual examination is needed by switching to another microscopic objective with high magnification power to determine whether the cell is analyzable or not [15], our approach has two advantages. First, the analyzable metaphase chromosome cells detected and prompted by the scheme can be directly examined and analyzed by technologists (or cytogeneticists) for the diagnosis purpose without using the microscope. Second, the identified analyzable metaphase chromosomes can be used by other computer-aided diagnosis scheme to potentially perform more comprehensive tasks (i.e., the detection of the distortion in chromosomes’ banded patterns). Hence, our scheme can be integrated with other available semi-automated schemes to develop fully-automated computer schemes in the future studies.
During the development and evaluation of a computer scheme involving a machine learning classifier, the researchers often face a number of biases, in particular the bias of case (learning sample) selection and validation method. We took several measures (procedures) in an attempt to avoid or minimize the bias of the classification results. First, the training and testing datasets used in this study were independently selected in our genetic laboratory by cytogeneticists. The researchers who developed and tested the computerized scheme did not involve in the case selection, which helps eliminate the bias in case selection. Second, due to the limitation of size of the dataset, avoiding or minimizing the bias in classification results (e.g., due to the potential over-training) is always a difficult challenge. Several optimization (training and testing) methods including jackknifing (leave-one-out), N-fold cross-validation, and use of independent testing dataset have been widely used in development and optimization of the computerized schemes. Previous studies have suggested that both leave-one-out and cross-validation methods were more likely to generate considerable bias and variance [35, 36]. Although using independent testing dataset is the best way to reduce the classification bias, dividing limited dataset into two independent datasets reduces the size and diversity of training dataset and may also reduce the performance of testing result [35]. As a result, to minimize the classification bias and assess the optimal performance of the scheme, we used both independent testing and two-fold cross validation methods in this study.
The results of this preliminary study are encouraging. The scheme achieved high performance on an independent testing dataset (i.e., Kappa = 0.89 for using the DT based classifier and AZ > 0.93 for using the ANN based classifier). The results indicated that the scheme could correctly identify more than 90% of analyzable chromosome cells while eliminating majority of un-analyzable cells (e.g., > 85%). However, there are several limitations in this study. First, the size of datasets was relatively limited (small). Second, the “truth” was determined by one cytogeneticist in our genetic laboratory. The issue of potential inter-observer variability has not been investigated. Third, all microscopic digital images of chromosomes were pre-selected and each image depicts one metaphase cell (either analyzable or un-analyzable one). In our future studies, we will further optimize and test our scheme using a much large and diverse image database. The “truth” file will be verified by a panel of cytogeneticists. We will also test and apply this scheme to the sequential images automatically acquired by a high-speed microscopic image scanner (that is currently under development in our laboratory). The new computerized scheme should first detect whether an image depicts a metaphase cell or not, since in the clinical environment most of images acquired by a high-speed microscopic image scanner contain no metaphase cells. After the metaphase cells are detected, the scheme then identifies analyzable metaphase cells and discards un-analyzable ones.
V. Acknowledgement
This research is supported in part by grants from the National Institutes of Health (CA115320). The authors would like to acknowledge the support of Charles and Jean Smith Chair endowment fund as well.
Footnotes
Publisher's Disclaimer: This is a PDF file of an unedited manuscript that has been accepted for publication. As a service to our customers we are providing this early version of the manuscript. The manuscript will undergo copyediting, typesetting, and review of the resulting proof before it is published in its final citable form. Please note that during the production process errors may be discovered which could affect the content, and all legal disclaimers that apply to the journal pertain.
VI. References
- 1.Tjio JH, Levan A. The chromosome number in man. Hereditas. 1956;42:1–6. [Google Scholar]
- 2.Nowell PC, Hungerford DA. A minute chromosome in human chronic granulocytic leukemia. Science. 1960;132:1497. doi: 10.1126/science.144.3623.1229. [DOI] [PubMed] [Google Scholar]
- 3.Piper J, Granum E, Rutovitz D, Ruttledge H. Automation of chromosome analysis. Signal Processing. 1980;2:203–221. [Google Scholar]
- 4.Truong K, Gibaud A, Zalcman G, Guilly M. Quantitative fish determination of chromosome 3 arm imbalances in lung tumors by automated image cytometry. Med Sci Monit. 2004;10:426–432. [PubMed] [Google Scholar]
- 5.Shih LM, Wang TL. Apply innovative technologies to explore cancer genome. Curr Opin Oncol. 2005;17:33–38. doi: 10.1097/01.cco.0000147382.97085.e4. [DOI] [PubMed] [Google Scholar]
- 6.Boehm D, Herold S, Kuechler A, Liehr T. Rapid detection of subtelomeric deletion / duplication by novel real-time quantitative PCR using SYBR-Green dye. Human Mutation. 2004;23:368–378. doi: 10.1002/humu.20011. [DOI] [PubMed] [Google Scholar]
- 7.Hoffbrand VA, Pettit JE. Color atlas of clinical hematology. Third Edition. San Francisco, CA: Mosby Press; 2000. [Google Scholar]
- 8.LeBeau MM, Rowley JD. Recurring chromosomal abnormalities in leukemia and lymphoma. In: Rowly J, editor. Cancer Survey. Vol. 3. Oxford, UK: Oxford University Press; 1984. pp. 371–394. [Google Scholar]
- 9.Kyan MJ, Guan L, Amison MR, Cogswell CJ. Feature extraction of chromosomes from 3D confocal microscope images; Proc International Conference on Image Processing; 1999. pp. 24–28. [Google Scholar]
- 10.Harnden DG, Klinger HP, Jensen JT, Kaelbling M. An international system for human cytogenetic nomenclature (ISCN1985): Report of the standing committee on human cytogenetic nomenclature. Basel, Switzerland: KAEGER; 1985. [Google Scholar]
- 11.Zimmerman SO, Johnston DA, Arrighi FE, Rupp ME. Automated homologue matching of human G-banded chromosomes. Comput. Biol. Med. 1986;16:223–233. doi: 10.1016/0010-4825(86)90050-8. [DOI] [PubMed] [Google Scholar]
- 12.Wang X, Zheng B, Wood M, Li S, Chen W, Liu H. Development and evaluation of automated systems for detection and classification of banded chromosomes: current status and future perspectives. J. Phys. D: Appl. Phys. 2005;38:2536–2542. [Google Scholar]
- 13.Vliet LJ, Young IT, Mayall BH. The Athena Semi-Automated Karyotyping System. Cytometry. 1990;11:51–58. doi: 10.1002/cyto.990110107. [DOI] [PubMed] [Google Scholar]
- 14.Popescu M, Gader P, Keller J, Klein C. Automatic karyotyping of metaphase cells with overlapping chromosomes. Comput. Biol. Med. 1999;29:61–82. doi: 10.1016/s0010-4825(98)00040-7. [DOI] [PubMed] [Google Scholar]
- 15.Cosio F, Vega L, Becerra A, Melendez C. Automatic identification of metaphase spreads and nuclei using neural networks. Med Biol Eng Comput. 2001;39:391–396. doi: 10.1007/BF02345296. [DOI] [PubMed] [Google Scholar]
- 16.Castleman KR. The PSI automatic metaphase finder. J Radiat. Res. 1992;33:124–128. doi: 10.1269/jrr.33.supplement_124. [DOI] [PubMed] [Google Scholar]
- 17.Corkidi G, Vega L, Márquez J, Rojas E, Ostrosky P. Roughness feature of metaphase chromosome spreads and nuclei for automated cell proliferation analysis. Med. Biol. Eng. Cornput. 1998;36:679–685. doi: 10.1007/BF02518869. [DOI] [PubMed] [Google Scholar]
- 18.Wang Y, Wu Q, Castleman KR, Xiong Z. Chromosome image enhancement using multiscale differential operators. IEEE Trans Med Imaging. 2003;22:685–693. doi: 10.1109/TMI.2003.812255. [DOI] [PubMed] [Google Scholar]
- 19.Wu Q, Liu Z, Chen T, Xiong Z, Castleman KR. Subspace-based prototyping and classification of chromosme images. IEEE Trans Image Processing. 2005;14:1277–1287. doi: 10.1109/tip.2005.852468. [DOI] [PubMed] [Google Scholar]
- 20.Piper J, Granum E. On fully automatic feature measurement for banded chromosome classification. Cytometry. 1989;10:242–255. doi: 10.1002/cyto.990100303. [DOI] [PubMed] [Google Scholar]
- 21.Errington P, Graham J. Application of artificial neural networks to chromosome classification. Cytometry. 1993;14:627–639. doi: 10.1002/cyto.990140607. [DOI] [PubMed] [Google Scholar]
- 22.Guthrie C, Gregor J, Thomason MG. Constrained Markov networks for automated analysis of G-banded chromosomes. Comput Biol Med. 1993;23:105–114. doi: 10.1016/0010-4825(93)90142-n. [DOI] [PubMed] [Google Scholar]
- 23.Stanley RJ, Keller JM, Gader P, Caldwell CW. Data-Driven Homologue Matching for chromosome identification. IEEE Trans Med Imaging. 1998;17:451–462. doi: 10.1109/42.712134. [DOI] [PubMed] [Google Scholar]
- 24.Stanley R, Keller J, Gader P, Caldwell CW. Automated chromosome classification limitations due to image processing. Biomed Sci Instrum. 1995;31:183–188. [PubMed] [Google Scholar]
- 25.Boschman GA, Manders EM, Rens W, Slater R, Aten JA. Semi-automated detection of aberrant chromosomes in bivariate flow karyotypes. Cytometry. 1992;13:469–477. doi: 10.1002/cyto.990130504. [DOI] [PubMed] [Google Scholar]
- 26.Malet P, Benkhalifa M, Perissel B, Geneix A, Le Corvaisier B. Chromosome analysis by image processing in a computerized environment: clinical application. J Radiat Res. 1992;33:171–188. doi: 10.1269/jrr.33.supplement_171. [DOI] [PubMed] [Google Scholar]
- 27.Gonzalez RC, Woods RE. Digital image processing. Reading MA: Addison-Wesley Publishing Company; 1992. [Google Scholar]
- 28.Zheng B, Lu A, Hardesty LA, Sumkin JH, Gur D. A method to improve visual similarity of breast masses for an interactive computer-aided diagnosis environment. Med. Phys. 2006;33:111–117. doi: 10.1118/1.2143139. [DOI] [PubMed] [Google Scholar]
- 29.Mitchell TM. Machine Learning. Boston MA: WCB McGraw-Hill; 1997. [Google Scholar]
- 30.Hertz J, Krogh A, Palmer RG. Introduction to the theory of neural computation. Redwood City, CA: Addison-Wesley Publishing Company; 1991. [Google Scholar]
- 31.Obuchowski NA. ROC analysis. Am J Roentgen. 2005;184:364–372. doi: 10.2214/ajr.184.2.01840364. [DOI] [PubMed] [Google Scholar]
- 32.Metz CE. ROCFIT 0.9B Beta version. Chicago, IL: University of Chicago; 1998. https://www.radiology.uchicago.edu/krl/ [Google Scholar]
- 33.Metz CE, Herman BA, Shen JH. Maximum-likelihood estimation of receiver operating characteristic (ROC) curves from continuously-distributed data. Stat. Med. 1998;17:1033–1053. doi: 10.1002/(sici)1097-0258(19980515)17:9<1033::aid-sim784>3.0.co;2-z. [DOI] [PubMed] [Google Scholar]
- 34.Wang XW, Li S, Liu H, Mulvihill JJ, Chen W, Zheng B. A computer-aided method to expedite the evaluation of prognosis for childhood acute lymphoblastic leukemia. TCRT, Technology in Cancer Research and Treatment. 2006;5:429–436. doi: 10.1177/153303460600500411. [DOI] [PubMed] [Google Scholar]
- 35.Zheng B, Chang YH, Good WF, Gur D. Adequacy testing of training set sample sizes in the development of a computer-assisted diagnosis scheme. Acad Radiol. 1997;4:497–502. doi: 10.1016/s1076-6332(97)80236-x. [DOI] [PubMed] [Google Scholar]
- 36.Li Q, Doi K. Reduction of bias and variance for evaluation of computer-aided diagnostic schemes. Med Phys. 2006;33:868–875. doi: 10.1118/1.2179750. [DOI] [PubMed] [Google Scholar]


