

Abstract
The interaction of transcription factors with target genes is highly dynamic. Whether the dynamic nature of these interactions is merely an intrinsic property of transcriptions factors or serves a regulatory role is unknown. Here, we have used single cell fluorescence imaging combined with computational modeling and chromatin immunoprecipitation to analyze transcription complex dynamics in gene regulation during the cell cycle in living cells. We demonstrate a link between the dynamics of RNA polymerase I (RNA pol I) assembly and transcriptional output. We show that transcriptional upregulation is accompanied by prolonged retention of RNA pol I components at the promoter, resulting in longer promoter dwell time, and an increase in the steady state population of assembling polymerase. As a consequence, polymerase assembly efficiency, and ultimately, an rate of entry into processive elongation are elevated. Our results show that regulation of rDNA transcription in vivo occurs via modulation of the efficiency of transcription complex subunit capture and assembly.
Introduction
Gene activation and assembly of the transcription machinery involves the orchestrated recruitment of chromatin remodeling factors, transcriptional activators and the basal transcription machinery (Gorski and Misteli, 2005; Metivier et al., 2003; Sims et al., 2004). The interaction of these factors with their DNA template and with each other is highly dynamic (Misteli, 2001; Hoogstraten et al., 2002; McNally et al., 2000; Stenoien et al., 2001; Phair and Misteli, 2004). Similarly, subunits of RNA polymerase I and II interact with their respective promoters in a rapid and transient manner (Becker et al., 2002; Dundr et al., 2002; Kimura et al., 2002; Yao et al., 2007; Karpova et al., 2008; Darzacq et al., 2007; Boireau et al., 2007).
Transcription of ribosomal RNA genes by RNA pol I provides an excellent system to probe the functional importance of RNA polymerase dynamics in vivo. Biochemical analysis has identified the transcriptional machinery including the Upstream Binding Factor (UBF), several assembly factors and the RNA polymerase subunits (Grummt, 2003; Moss, 2004; Russell and Zomerdijk, 2005). rRNA genes are organised as tandemly repeated units on multiple chromosomes forming endogenous arrays of transcription units t localized within nucleoli (Long and Dawid, 1980). Ribosomal genes are particularly well suited for analysis by microscopy methods since RNA pol I a accumulates at sites of active rRNA transcription in nucleolar transcription factories that can be readily visualized and analysed by quantitative fluorescence microscopy (Chen and Huang, 2001; Dundr et al., 2000, 2002).
The RNA pol I transcription complex has been proposed to assemble at the promoter from distinct subunits or, alternatively, to be recruited as a pre-assembled holoenzyme (Grummt, 2003; Hannan et al., 1999; Moss, 2004; Saez-Vasquez and Pikaard, 1997 ; Seither et al., 1998). In support of a subunit assembly model, rDNA transcription can be reconstituted in vitro using recombinant and partially purified components. Order-of-addition experiments have also suggested sequential assembly of the RNA pol I machinery (Grummt, 2003; Moss, 2004; Russell and Zomerdijk, 2005). An alternative scenario is suggested by the identification and purification of an RNA pol I holoenzyme that contains the majority of general transcription factors, co-activators and the core RNA polymerase, supporting the notion that the RNA pol I machinery is recruited to the promoter as a pre-assembled complex (Schneider and Nomura, 2004).
Observations of RNA pol I components in living cells support a stepwise assembly of the transcription complex at the promoter (Chen et al., 2005; Dundr et al., 2002). Analysis of several RNA pol I factors using fluorescence recovery after photobleaching (FRAP) methods have demonstrated that in mammalian cells UBF and PAF53 as well as subunits of RNA pol I have distinct individual dynamic properties suggestive of assembly of the transcription machinery from smaller subunits (Chen et al., 2005; Dundr et al., 2002). Kinetic modeling revealed that RNA pol I components interact with rDNA in a stochastic fashion either individually or in subcomplexes (Dundr et al., 2002). Similar observations have been made for mammalian RNA pol II components, suggesting that step-wise subunit assembly might be a universal property of RNA polymerases (Becker et al., 2002; Hoogstraten et al., 2002; Kimura et al., 2002; McNally et al., 2000; Stenoien et al., 2001; Yao et al., 2006; Darzacq et al., 2007). Consistent with a subunit assembly model, different RNA pol I subunits assume distinct cellular localization during mitosis when rDNA transcription is repressed, underscoring the differential behavior of individual RNA pol I subunits (Chen et al., 2005).
While these observations make it clear that RNA polymerases are intrinsically dynamic, it is unknown whether the dynamic nature of transcription complexes contributes to transcriptional regulation. Here we have systematically probed RNA pol I assembly dynamics under conditions of varying transcriptional output using quantitative in vivo single cell imaging combined with computational modeling and complementary biochemical analysis using chromatin immuno-precipitation. Our results demonstrate a direct link between RNA pol I subunit capture, assembly efficiency and transcriptional activity of rDNA genes.
Results
RNA pol I subunit dynamics correlate with rDNA transcriptional output
To study the mechanism of RNA pol I transcriptional regulation in vivo, we measured the dynamics of several RNA pol I subunits under conditions of high and low rDNA transcription using single cell in-vivo photobleaching methods (Dundr et al., 2002). To do so, we took advantage of the fact that rDNA transcription fluctuates during the cell cycle. rDNA transcription is repressed upon entry into mitosis, recovers during G1-phase and reaches maximal levels in S-phase (Klein and Grummt, 1999; Weisenberger and Scheer, 1995). Consistent with these results, analysis of nascent pre-rRNA transcripts in synchronized HeLa cells revealed a ~2-fold increase in transcriptional activity in S-phase compared to G1-phase cells (Figure 1A). Cell synchronization was confirmed by FACS analysis and immunolabelling with BrdU (Supplementary Figure S1; data not shown). The cell cycle stage of single cells was also evident based on the morphological appearance of the nucleolus with G1/0 cells containing more and smaller foci representing fibrillar centers/dense fibrillar component (FC/DFC) regions, allowing cell-cycle staging of individual cells in microscopy experiments (Figure 1B).
Figure 1. RNA polymerase I recovery kinetics decrease as transcription increases during the cell cycle.

(A) Pre-rRNA transcription levels change during the cell cycle. Pre-rRNA levels were detected using quantitative real-time PCR with specific 5’ETS primers. HeLa were synchronised in metaphase using nocodazole and released for 1.5 h into G1. Aphidicolin was used to synchronize cells at the G1/S boundary before being released for 3 h into S-phase. Values represent averages ± S.D. from three independent experiments normalized to cyclophilin A levels.
(B) Nucleolar morphology changes during the cell cycle. Nucleoli in G1/0 synchronised HeLa cells expressing the RNA polymerase subunit RPA16-GFP contain small transcription factories which colocalise with active sites of transcription. S-phase synchronised cells contain larger transcription factories. Percentages indicate frequency of indicated nucleolar morphology. Bar: 5 µm.
(C) FRAP on GFP-RNA polymerase I subunits in G1 and S-phase. TR9-7 cells in G1 and S-phase expressing RPA43-GFP were imaged before and after photo-bleaching of fibrillar centers within the nucleolus. The recovery of fluorescence is measured using time-lapse microscopy. The bleached area is denoted using arrows. Images are shown in pseudocolor (yellow/red: high intensity; blue: low intensity). Bar: 5 µm.
(D) FRAP recovery curves of RPA194-GFP, RPA43-GFP, RPA40-GFP and RPA16-GFP in G1 and S-phase. Least squares best fit solutions (red lines) to the experimental FRAP data for each polymerase subunit in G1 (black circles) and S-phase (blue circles). Error bars show standard deviation of the experimental data, in each case at least 16 cells were averaged from at least 3 experiments.
To determine the interaction dynamics of individual RNA pol I subunits with rDNA in vivo under conditions of high and low rRNA transcription, FRAP experiments were performed in HeLa or TR9-7 human fibroblast in G1- or S-phase (Figure 1C). Similar results were observed in both cell types (data not shown). Nucleolar regions were photobleached and the recovery of fluorescence measured as a function of time (Dundr et al., 2002; Phair et al., 2004). The functionality of the tagged RNA pol I subunits was indicated by their stable incorporation into RNA pol I complexes (Dundr et al., 2002; Supplementary Figure S2). Fluorescence recovery kinetics of polymerase subunits RPA194-GFP, RPA43-GFP, RPA40-GFP and RPA16-GFP in G1- and S-phase showed biphasic behavior with an initial rapid increase in fluorescence followed by a much slower phase (Figure 1D). These data are in agreement with results from unsynchronized cells, where the initial phase of recovery was shown to reflect RNA pol I subunits that transiently interact with the nucleolus and rDNA promoter during transcription complex assembly, whereas the later, slower phase represents RNA pol I polymerases that are actively engaged in elongation (Dundr et al., 2002). Notably, the recovery kinetics of all subunits were distinct in G1- and S-phase cells (Figure 1D). In G1, the time to reach 50% recovery of the pre-bleach signal (t1/2) was typically 10 – 19 s depending on the RNA pol I subunit (Figure 1D). In contrast, in S-phase cells the rate of fluorescence recovery of RNA pol I subunits was significantly decreased and t1/2 was 40 – 80 s (Figure 1D; P<0.0001). The different recovery kinetics were not due to the different sizes of the FC/DFC in G1- and S-phase since recovery kinetics were spot-size independent and similarly faster recovery kinetics were observed in G1 cells when more FC/DFCs were bleached (Supplementary Figure S3). Recovery kinetics were independent of GFP-fusion protein expression and bleach depth (Supplementary Figures S4, S5). These observations demonstrate distinct dynamic behavior of RNA pol I under conditions of differential transcriptional activity.
Kinetic modeling of RNA pol I dynamics under conditions of different transcription levels
To identify the reasons for the differential FRAP recovery kinetics in G1 and S-phase, we quantitatively analyzed the FRAP data with a previously described computational kinetic model (Figure 2A; Dundr et al., 2002). In this model the interactions of freely diffusing RNA pol I subunits within the nucleolus and on rDNA genes are described by sets of association and dissociation rate constants (Figure 2A). Subunits associate and dissociate with the nucleolus with kf and kr, and the promoter with kon and koff, and are then incorporated into a productive RNA pol I with the initiation rate constant kstart, which likely represents multiple assembly steps. Elongating RNA pol I is defined by the elongation rate constant kelong (Figure 2A). Upon completion of transcription the RNA pol I subunits dissociate from rDNA with a dissociation rate constant kdiss (Figure 2A). The individual rate constants kf, kr, kon, koff and kstart determine the steady state concentration of molecules associated with a given compartment which in turn provide values for the fraction of molecules in the nucleoplasm (FNpl), the fibrillar centre (FFC), at the promoter (Fpromoter) and incorporated into the elongating polymerase (Felong). The rate constants we used to determine the residence times were for elongation RTelong (1/kstart), at the promoter RTpromoter (1/koff+kstart), within the fibrillar centre RTFC (1/kf+kon) and the promoter binding probability (kon/kon+kr) and initiation probability (kstart/kstart+koff). We have previously shown that this is the minimal model that faithfully describes the experimentally measured RNA pol I dynamics in vivo (Dundr et al., 2002). A similar model has been developed for RNA pol II (Darzacq et al., 2007).
Figure 2. Quantitative analysis of RNA polymerase I dynamics using a computational model of transcription.
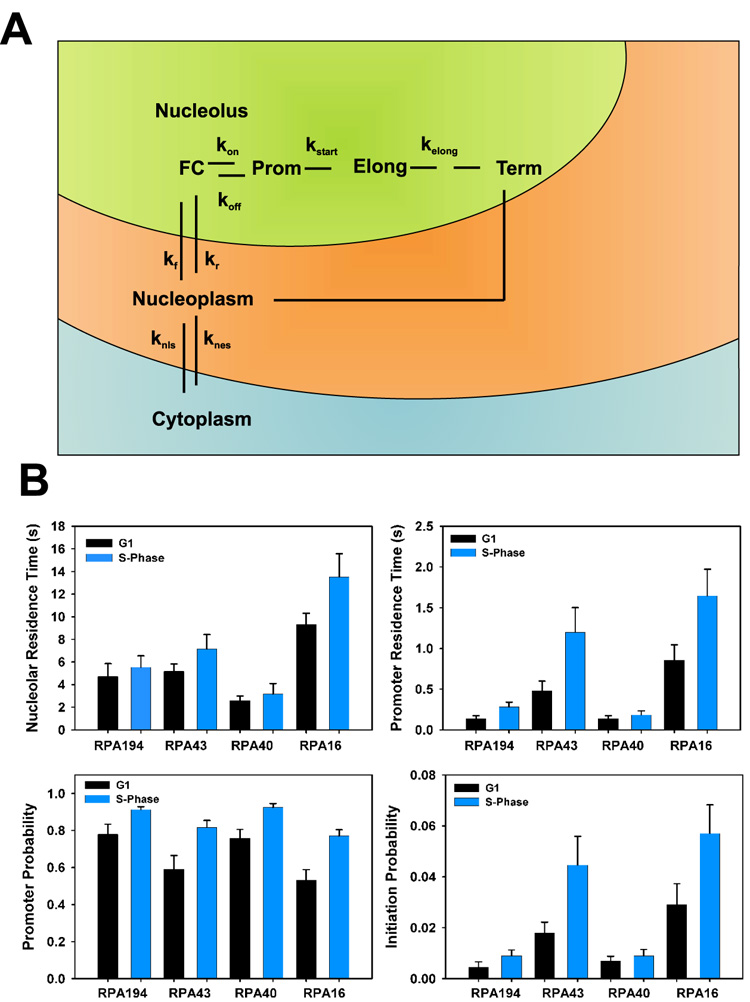
(A) Kinetic model of RNA polymerase I transcription. FC, fibrillar centre; Prom, promoter; Elong, elongating polymerase; Term, termination of transcription; kf, nucleolar association rate constant; kr, nucleolar dissociation rate constant; kon, promoter association rate constant; koff, promoter dissociation rate constant; kstart = kelong, elongation rate constant; knls, nuclear import rate constant; knes, nuclear export rate constant.
(B) Kinetic properties of the polymerase subunits in G1 and S-phase. Each value was determined from the rate constants obtained from the fits in (B) (Supplementary Table S2). Nucleolar residence time, 1/(kr+kon); promoter residence time, 1/(koff+kstart); promoter binding probability, kon/(kon+kr); initiation probability, kstart/(kstart+koff). Error bars depict results of sensitivity analysis, representing the maximum range of values for the associated standard deviation of the datasets.
To quantitatively analyze RNA pol I dynamics, best-fits to the experimental FRAP data for each subunit were obtained using a least-squares fit algorithm to generate quantitative estimates for rate constants, residence times and interaction probabilities (Figure 1D; see Experimental Procedures). Best fits were evaluated by residual analysis (Supplementary Figure S7) and all curve fits were constrained so as to account for the experimentally determined steady state distribution of fluorescent molecules within the nucleus and the fraction of fluorescent molecules bleached in the FRAP experiment (Dundr et al., 2002, Supplementary Table S1). All parameter values were verified by sensitivity analysis (see Experimental Procedures; Supplementary Figure S7, 8).
To determine the origin of the differential dynamic behavior of the polymerase under conditions of high and low transcriptional output, a set of kinetic scenarios was evaluated by systematically varying different combinations of parameters until simultaneous best-fits were obtained for FRAP data in G1 and S-phase. We first tested the hypothesis that altered dynamics between G1- and S-phase are solely due to changes in the association and dissociation of transcription factors with the nucleolus. Varying the nucleolar association and dissociation rates kf or kr either alone or in combination was only able to describe the initial rapid increase in fluorescence, but failed to account for the slower phase of the recovery of S-phase cells (Supplementary Figure S6, S7). Similarly, alterations of only the interactions at the promoter (kon, koff and kon + koff), were unable to account for all of the slow elongation phase or the initial rise in fluorescence in S phase cells (Supplementary Figure S6). Finally, keeping all rate constants equal and only varying the elongation rate was not able to recapitulate the difference in the recovery kinetics, as it could not account for the initial rapid increase in fluorescence (Supplementary Figure S6, S8). All simulations were insensitive to the nuclear import/export rates as those are several orders of magnitude smaller than the flux rates at the promoter (Dundr et al., 2002). Quality of fits was determined by residual analysis (Supplementary Figure S7).
Increased promoter interaction of RNA pol I subunits in response to transcriptional upregulation
The experimental FRAP data could be accurately described only by varying RNA pol I subunit interactions with both the promoter and the nucleolus simultaneously (Figure 1D; Supplementary Figure S6). A set of rate constants was determined from the best-fit solutions for the G1- and S-phase recovery kinetics. We find that the steady-state level of the polymerase subunits and their residence times in the nucleolus changed only marginally from G1- to S-phase as the result of a concerted decrease of the nucleolar association rate constants (from 0.026 – 0.061 s−1 in G1 to 0.011–0.025 s−1 in S-phase) and a decrease in the nucleolar dissociation rate constants (from 0.047 – 0.093 s−1 in G1 to 0.016 – 0.026 s−1 in S-phase) (Figure 2B, top left panel and Supplementary Table 2; P<0.05).
We next asked whether the interaction dynamics of RNA pol I subunits with the rDNA promoter differ between G1- and S-phase cells. The steady state population of subunits in the nucleolus was not altered between G1 and S-phase (Fig. 2B; Supplemetary Table 2). However, the promoter binding probability, defined as the statistical chance of a molecule binding to the promoter relative to its probability of returning to the nucleoplasm (kon/ (kon+kr), increased from 53–78% in G1 to 77–93% in S-phase, indicating that during S-phase all RNA pol I subunits examined undergo more interactions with the promoter whilst in the nucleolus (Figure 2B bottom left panel; Supplementary Table S2; P<0.05 to P<0.01). Importantly, the promoter dissociation rate constants for RPA194-GFP, RPA43-GFP and RPA16-GFP were decreased in S-phase between 2.0–2.6-fold depending on the subunit (Supplementary Table S2; P<0.05). Since the promoter dissociation rate significantly contributes to the residence time of a subunit on the promoter, this means that RNA pol I subunits are retained for longer periods of time on the promoter under conditions of high transcriptional output (Figure 2B, top right panel). While in G1 the residence time for RPA194-GFP, RPA43-GFP, and RPA16-GFP at the rDNA promoter was 0.13 seconds, 0.48 seconds and 0.86 seconds, respectively, it increased to 0.28 seconds, 1.20 seconds and 1.65 seconds in S-phase (P<0.05). The promoter dissociation rate constant, and therefore the promoter residence time, for RPA40-GFP did not change significantly between G1- and S-phase (P>0.32). We conclude that several RNA pol I subunits are more efficiently retained at the rDNA promoter under conditions of high transcriptional output.
Elevated efficiency of RNA pol I assembly during transcriptional activation
The longer promoter residence time of subunits in S-phase may facilitate polymerase assembly by stabilizing assembly intermediates. If so, a prediction is that the initiation probability, i.e. the probability that a subunit is incorporated into a productive transcription complex, also increases. In agreement with this prediction, the calculated polymerase initiation probability rose 2–3 fold from 0.5–2.9% in G1-phase to 0.9–5.7% in S-phase depending on the subunit (Figure 2B bottom right panel, Supplementary Table S2; P<0.05), demonstrating that the increased capture of individual subunits at the promoter results in greater efficiency of RNA pol I complex formation. The higher initiation probability is sufficient to fully account for the elevated transcriptional output in S-phase. Consistent with this interpretation, the fraction of elongating RNA pol I subunits rose from an average of 11% in G1- to 20% in S-phase (Supplementary Table S2). This 2-fold increase in initiation probability and the number of engaged RNA pol I molecules is in agreement with the qRT-PCR data demonstrating a ~2-fold upregulation in transcriptional activity in S-phase compared to G1 (Figure 1A). These observations suggest that the longer dwell time of RNA pol I subunits on the promoter results in more efficient assembly of RNA pol I and consequently in an increased rate of transcription initiation.
To confirm the increased steady-state population of RNA pol I at the promoter, we carried out chromatin immunoprecipitation experiments using a previously characterized specific antibody against RPA194 (Fig. 3). As expected, RPA194 was found at the promoter and along the rRNA genes including the 5’ETS and the main body of the gene (HrDNA4), but not in the intergenic spacer regions between ribosomal genes (HrDNA27; Fig. 3). As predicted from the FRAP analysis, the steady state population of RPA194 in S-phase was elevated 2.2–3-fold compared to G1/0-cells. The increase in association occurred at the promoter, in the 5’ETS and in the body of the gene, consistent with increased transcriptional output (Fig. 3). In contrast, UBF is not enriched in S-phase cells and was found throughout the gene as previously reported (Fig. 3; O’Sullivan, 2002). As a control, no accumulation of RPA194 was observed in the absence of specific antibody or irrelevant pre-immune serum (Fig 3; data not shown). These results are independent confirmation of the in vivo FRAP analysis and demonstrate increased recruitment of RNA pol I under conditions of high transcription.
Fig. 3. Increased steady-state association of RNA pol I with ribosomal genes in S phase versus G1/0.

Loading of RNA pol I at the rDNA promoter, 5’ETS, along the gene (HrDNA4), and a negative control sequence within the intergenic spacer (HrDNA27) was measured in TR9-7 cells by quantitative ChIP using an antibody against RPA194. The amount of immunoprecipitated DNA was calculated as the percent of the total amount in the starting material (% total input chromatin). Data represent average values ± SEM from 2–3 independent experiments, each performed in duplicate. Black bars represent G0 cell populations, gray bars represent S-phase cell populations. Probe regions are indicated.
Dynamics of non-polymerase components
Having established that core RNA pol I assembly dynamics are altered upon transcriptional activation, we sought to identify the molecular mechanisms that determine assembly efficiency. To this end, we measured the dynamics of several upstream RNA pol I transcription factors, including the Upstream Binding Factor UBF, the RNA pol I–associated factor PAF53 and the regulatory transcription initiation factor TIF-IA in G1- and S-phase cells. FRAP analysis revealed a significantly faster t1/2 for UBF-GFP and PAF53-GFP in G1 cells compared to all core RNA pol I subunits (~ 4s vs. ~ 10–19 s; P<0.0001) (Figure 4A). The recovery time of TIF-IA-GFP, however, was similar to RNA pol I subunits with a t1/2 of 16 seconds (Figure 4A). Importantly, the dynamics of UBF were comparable in G1- and S-phase, suggesting that UBF is not a modulator of assembly dynamics (Figure 4A, Supplementary Table S2; P>0.32). In contrast, both PAF53 and TIF-IA, which mediate the interaction between the pre-initiation complex and the core polymerase (Hanada et al., 1996; Seither et al., 1997; Yuan et al., 2002) showed significantly slower recovery kinetics in S-phase compared to G1-phase cells (Figure 4A).
Figure 4. Quantitative analysis of pre-initiation and assembly factor dynamics.

(A) Computational fits to the FRAP data for the pre-initiation factor UBF-GFP and the assembly factors PAF-53-GFP and TIF-IA in G1 and S-phase. Least squares best fit solutions (red lines) to the experimental FRAP data from TR9-7 cells for each factor in G1 (black circles) and S-phase (blue circles). Error bars show standard deviation of the experimental data from at least 16 cells.
(B) Kinetic properties of the pre-initiation and assembly factors in G1 and S-phase. Each value was determined from the rate constants in (A). Nucleolar residence time, 1/(kr+kon); promoter residence time, 1/(koff+kstart); promoter probability, kon/(kon+kr); initiation probability, kstart/(kstart+koff). Error bars depict results of sensitivity analysis, representing the maximum range of values for the associated standard deviation of the datasets.
Computational analysis confirmed these findings. The promoter residence time of UBF was unchanged between G1- and S-phase cells, and that for PAF53 and TIF-IA increased from 0.13 s and 0.17 s in G1 to 0.37 s and 0.51 s in S-phase, respectively (Figure 4B, Supplementary Table S2; P<0.05). Similarly, the promoter binding probability of TIF-IA increased from 74% in G1 to 88% in S-phase (Figure 4B, Supplementary Table S2; P<0.01), whilst that of PAF53 did not change significantly (P<0.32). As a consequence of these changes, the calculated initiation probabilities also rose ~ 3-fold for PAF53-GFP and TIF-IA-GFP, but not for UBF (Figure 4B, Supplementary Table S2; P<0.05). These data demonstrate that the promoter interaction dynamics of UBF are unaltered and very likely do not contribute to changes in RNA pol I assembly efficiency, whereas the interaction of the two RNA pol I-associated initiation factors with the promoter are prolonged in S-phase, pointing to the possibility that these more stably bound factors are critical in modulating the assembly efficiency of the core polymerase. This model makes the prediction that interference with initiation factors should impair the downstream assembly of the core polymerase but not affect upstream binding factors.
Assembly efficiency is determined by interaction dynamics between TIF-IA and RNA pol I subunits
To directly test this prediction, we examined whether impaired interaction of TIF-IA with RNA pol I affects the dynamics and assembly of the polymerase core subunits. TIF-IA has been shown to regulate RNA pol I activity by integrating multiple signaling pathways that control the biosynthetic capacity of the cell. To this end, we took advantage of a dominant negative mutant of TIF-IA, TIF-IAS649A, that cannot be phosphorylated by the MAPK signaling pathway at serine 649, a modification that is crucial for the interaction between TIF-IA and RNA pol I and growth factor-dependent regulation of rDNA transcription (Zhao et al., 2003). As expected, overexpression of TIF-IAS649A decreased pre-rRNA transcription 1.7-fold (Figure 5B). Fluorescently tagged TIF-IAS649A colocalized with RNA pol I (Figure 5A) and showed similar FRAP recovery kinetics compared to its wild-type counterpart in G1- and S-phase (Figure 5C; Supplementary Figure S10).
Figure 5. Perturbation of pre-rRNA transcription and polymerase assembly using TIF-IAS649A mutant.

(A) TIF-IA S649A–Cherry co-localizes with RPA43-GFP in fibrillar centers within the nucleolus of TR9-7 cells. Bar: 5 µm.
(B) The presence of TIF-IAS649A–GFP decreases pre-rRNA expression in living TR9-7 cells. Quantitative real-time PCR shows pre-rRNA levels are decreased in cells expressing transiently transfected TIF-IAS649A-GFP relative to TIF-IA-GFP. Final pre-rRNA levels were corrected for transfection efficiency. Values represent averages ± S. D from at least 3 experiments.
(C) Effect of TIF-IAS649A mutation on FRAP recovery kinetics compared to wild-type TIF-IA-GFP in S-phase TR9-7 cells.
(D–H) Effect of the presence of TIF-IA S649A-Cherry on the recovery dynamics of the pre-initiation factor (D) UBF-GFP, and polymerase subunits (E) RPA194-GFP, (F) RPA43-GFP, (G) RPA40-GFP and (H) RPA16-GFP. TR9-7 cells in S-phase +/− TIF-IA S649A-Cherry were imaged before and after photobleaching. The recovery of fluorescence is measured using time-lapse microscopy. (C–H) For quantitation at least 16 cells from at least 3 experiments were measured for each experimental condition. Error bars represent S.D.
(I) Kinetic properties of the pre-initiation and assembly factors in the presence and absence of TIF-IA S649A mutant. Each value was determined from the rate constants in Supplementary Table S3. Promoter probability, kon/(kon+kr); initiation probability, kstart/(kstart+koff). Error bars represent results of sensitivity analysis, representing the maximum range of values for the associated standard deviation of the datasets.
To determine the effect of TIF-IAS649A on the dynamics of RNA pol I core subunits, FRAP experiments were performed on TR9-7 fibroblasts co-expressing either wild-type or mutant TIF-IA-Cherry and any one of the RNA pol I subunits (Figures 5D–H; Supplementary Figure S9). TIF-IAS649A-Cherry affected neither the recovery kinetics of the upstream factor UBF-GFP, nor the residence time of UBF at the rDNA promoter in G1- or S-phase cells (Figure 5D, 5I, Supplementary Table S3). In contrast, mutant TIF-IA increased the rate of FRAP recovery of all RNA pol I core subunits in S-phase cells with individual subunits affected to variable extent (Figure 5E–H). Consistent with biochemical evidence for an interaction between RPA43 and TIF-IA, the recovery kinetics of RPA43-GFP were perturbed most severely in the presence of TIF-IAS649A (Figure 5F). As a control, expression of wild-type TIF-IA-Cherry did not affect the dynamics of RNA pol I subunits (Supplementary Figure S9). Similarly, mutant TIF-IA did not significantly alter the recovery kinetics of any of the RNA pol I subunits in G1 cells, suggesting that it exerts its regulatory function mostly in S-phase cells (Supplementary Figure S10). These observations indicate that interference with the interaction between TIF-IA and the polymerase destabilizes RNA pol I subunit binding.
Using the same systematic modeling approach as applied to cell cycle analysis, we determined the kinetic properties of RNA pol I subunits in the presence of the TIF-IA mutant. The increased dynamics of RNA pol I subunits in the presence of the TIF-IA mutant were not due to interference with their recruitment to the promoter since the promoter binding probability of all factors was unaffected by mutant TIF-IA (Figure 5I). Consistent with a destabilization of their promoter interactions, the promoter residence time of core subunits decreased 2–3 fold in the presence of TIF-IAS649A (Figure 5I). In contrast, the residence time of UBF was unaffected. Presumably as a consequence of reduced assembly of productive transcription complexes at the promoter, the probability of transcription initiation decreased concomitantly (Figure 5I). The extent of the changes in the dynamics of RNA pol I subunits at rDNA caused by the dominant-negative TIF-IA mutant correlated with the extent of transcriptional downregulation (Figure 5B). We conclude that the interaction of TIF-IA with RNA pol I is critical in determining RNA pol I assembly dynamics and consequently the rate of transcription initiation in S-phase.
Discussion
We have used a combination of quantitative live cell photobleaching microscopy, kinetic modeling and biochemical analysis to probe the dynamics of transcriptional regulation in living cells. Using RNA pol I as a model system, we find that the assembly dynamics of pre-initiation factors and polymerase core subunits decrease when transcription is upregulated. Computational analysis indicates that the reduced dynamics are due to increased capture and retention of components of the RNA pol I transcription machinery at the rDNA promoter. As a consequence, both the assembly efficiency and initiation rate of RNA pol I is enhanced. We propose that modulation of RNA pol I assembly dynamics at the promoter is a regulatory mechanism for control of the transcriptional output of rRNA genes in vivo.
Genetic and biochemical analyses have lead to several models for how transcription complexes are recruited to a promoter (Grummt, 2003; Lee and Young, 2000). In one scenario, the transcription complex is assembled in a step-wise manner on the promoter; on the other hand, the polymerase may be pre-assembled in the nucleoplasm and recruited to the promoter as a holoenzyme. While both models are supported by in vitro transcription experiments and biochemical data, analyses of several components of the RNA pol I transcription machinery in living cells have demonstrated that UBF, TIF-IA, PAF53 as well as subunits of RNA pol I have distinct dynamic properties (Chen et al., 2005; Dundr et al., 2002). These observations indicated that RNA pol I is not recruited to rDNA as a holoenzyme and suggested that RNA pol I assembly proceeds in a sequential manner via metastable intermediates. Our observations here that the kinetics of individual RNA pol I components are perturbed to variable extent in response to changes in rDNA transcription further supports the subunit assembly model. In addition, we find a range of probabilities for a subunit to be incorporated into an initiating, elongating polymerase indicating that each subunit interacts differently with the promoter and the forming polymerase. This property is irreconcilable with a holoenzyme recruitment model which requires that all subunits have identical initiation probabilities.
Our analysis of the dynamic behavior of seven components of the RNA pol I transcription machinery under conditions of differential transcriptional activity suggest a link between transcription complex assembly dynamics and transcriptional output. Specifically, our results reveal a key role for non-polymerase components in determining assembly dynamics. Interference with the interaction between RNA pol I and TIF-IA, the RNA pol I-associated factor that transduces extracellular signals to the RNA pol I transcription apparatus and mediates growth-dependent regulation of RNA pol I transcription, disrupts polymerase assembly and plays a central role in controlling polymerase assembly dynamics in S-phase. In particular, we show that RNA pol I-associated factors, PAF53 and TIF-IA, reside significantly longer at the rDNA promoter in S-phase when RNA pol I transcription is high compared to G1-phase cells when it is low. This altered interaction in turn affects the dynamics of downstream RNA pol I subunits leading to the increased residence time of individual subunits at the promoter. As a consequence, the probability that these downstream subunits will be incorporated into a fully assembled RNA pol I and into a productive transcription complex increases. The longer residence time of individual subunits likely stabilizes the interactions between individual RNA pol I subunits at the promoter and increases the probability of formation of a functional RNA polymerase.
Our data are consistent with a model in which RNA pol I subunits interact with the promoter in a dynamic fashion either individually or as small subcomplexes. Dynamic assembly of the transcription complex from individual subunits or small subcomplexes is ideally suited to accommodate regulatory mechanisms. The assembly of single subunits may provide the opportunity to differentially assemble RNA pol I in response to external signals, possibly by integrating a variety of signaling pathways in a combinatorial manner. Activation of the MAPK pathway results in phosphorylation of serines 633 and 649 in TIF-IA, which are important for interaction with RNA pol I (Zhao et al., 2003). Similarly, the mTOR pathway regulates the modification status of residues S44 and S199 within TIF-IA, thereby modulating the association with RNA pol I and TIF-IB/SL1 (Mayer et al., 2004). Cellular oxygen stress activates c-Jun N-terminal kinase (JNK) which phosphorylates T200 and also disrupts its association with TIF-IB/SL1 (Mayer et al., 2005). Therefore, it is possible that such positive and negative phosphorylation events are combinatorially integrated to produce the required transcriptional output by regulating interaction dynamics and protein localization (Mayer et al., 2005; Mayer et al., 2004).
Recent run-on and chromatin immunoprecipitation experiments have suggested that regulation of transcription elongation, rather than initiation, is responsible for increased rDNA transcription after ERK-mediated phosphorylation of UBF (Stefanovsky et al., 2006a). In contrast, we find that modulation of the elongation rate alone was not sufficient to qualitatively or quantitatively account for the observed decrease in initial recovery rate of all subunits in S-phase. Our data suggest that both cell cycle-dependent fluctuations of rRNA synthesis and downregulation of RNA pol I transcription by a dominant-negative TIF-IA mutant can occur without changing the elongation rate of the polymerase. It is possible that transcriptional activation via ERK-mediated phosphorylation of UBF acts through an increase in transcription elongation, whereas cell cycle- or TIF-IA-dependent regulation of RNA pol I transcription is brought about by changes in the dynamics of transcription complex assembly.
While control of transcriptional output via changes in efficiency of subunit assembly might be a peculiarity of RNA pol I, observations on other RNA polymerases point to a more universal role of dynamic assembly as a regulatory mechanism. FRAP measurements of the catalytic subunit of RNA pol II show biphasic recovery kinetics similar to those of RNA pol I (Becker et al., 2002; Kimura et al., 2002; Darzacq et al., 2007; Boireau et al., 2007). Furthermore, similar to RNA pol I assembly, onset of RNA pol II transcription is highly inefficient, suggesting stochastic assembly of both of these major polymerases (Darzacq et al., 2007). Along the same line, the dynamics of the glucocorticoid receptor and its co-activator GRIP-1 are significantly different to those of RNA pol II suggestive of a step-wise assembly of the pre-initiation complex (Becker et al., 2002). In addition, the estrogen and glucocorticoid receptors bind more tightly to chromatin upon transcriptional activation in the presence of ligand in line with a subunit assembly process (McNally et al., 2000; Stenoien et al., 2001) and the general transcription factor TFIIH becomes immobilized as it is engaged at a promoter (Hoogstraten et al., 2002). Even the classical stable formation of the enhancesome during activation of IFN-β has recently been shown to be a multi-step dynamic process (Bosisio et al., 2006). In Drosophila, heat shock factors bind transiently to its target sequences and becomes stably bound upon activation (Yao et al., 2006; 2007). We suggest that regulation of transcription complex formation and activity via regulation of assembly dynamics may be a general mechanism for the regulation of transcription complexes.
We have used here a combined in vivo imaging and computational approach to probe the dynamics of assembly of a transcription machinery. Similar approaches have previously been used with consistent results (Dundr et al., 2002; Darzacq et al., 2007), but it is important to point out that the computationally extracted values are best-fit estimates and their absolute values are influenced by model assumptions and experimental design. The error associated with these estimates is likely on the order of about 2-fold as indicated by the fact that we find here a roughly 2-fold difference in elongation time, residence time and binding probability of most factors compared to an earlier study using a distinct microscopy and modeling approach (Dundr et al., 2002). In addition, sensitivity analysis demonstrates high confidence of best-values within a given modeling approach as indicated by standard errors of typically 10–20%. While estimation of binding parameters of single proteins to chromatin is strongly confounded by modeling assumptions (Mueller et al., 2008), the comparative analysis of multiple proteins of the same complex and under multiple experimental conditions using identical modeling assumptions as performed here, is significantly more robust as all proteins are similarly affected by systematic errors (Mueller et al., 2008). Furthermore, slower parameters, such as long binding events or elongation times, can generally be measured more accurately than faster events as indicated by the observation that application of distinct modeling approaches revealed differences of several orders of magnitude for the rapidly binding glucocorticoid receptor (Sprague et al., 2004; Mueller et al., 2008), but the elongation rate of RNA pol I differed only by two-fold in distinct modeling and microscopy approaches (Dundr et al., 2002). A key factor in determining absolute values for rate constants is the influence of diffusion of proteins in the nucleus (Sprague et la., 2004; Beaudouin et al., 2006; Mueller et al., 2008). In the current model we have neglected the contribution of diffusion since the rate limiting step of elongation is several orders of magnitude slower than diffusion. However, this assumption is likely to introduce an error in the estimation of absolute values since diffusion is now recognized to also affect FRAP recoveries for rapidly binding proteins (Sprague et la., 2004; Beaudouin et al., 2006; Mueller et al., 2008). The accuracy of parameter estimates also depends on the temporal resolution of the imaging method used. While we use sampling intervals on the order of seconds, faster sampling on the millisecond timescale improves the absolute value estimates of most parameters, particularly rapid binding events, and allows dissection of the contribution of diffusion. Such faster sampling methods are becoming increasingly feasible on more advanced microscopes and more comprehensive models for chromatin binding events are being developed (Sprague et al., 2004; Mueller et al., 2008). These improvements will increase the accuracy of these approaches and make them powerful tools to further study the role of transcription dynamics in gene regulation in living cells.
Experimental Procedures
Plasmids
All plasmids containing RNA polymerase I components were described in (Dundr et al., 2002). TIF-IA (S649A) as inserted into pCherry-C1 (provided by T. Voss, NIH and R. Tsien, UCSD) as a XhoI – BamH1 fragment.
Cell culture, synchronization and transfection
Human fibroblasts TR9-7 (Agarwal et al., 1995) and HeLa cells were cultured in DMEM (Invitrogen) with 10% FCS, 1% glutamine and streptomycin and penicillin at 37°C in 5% CO2. Cells were arrested in mitosis by incubation with nocodazole (50 ng/ml) for 16 hr. Synchronisation of cells in G1 was achieved by either incubation with nocodazole and release for 1.5 h into G1 by washing cells extensively with PBS or by serum starvation for 4 days (DMEM, 0.1 % FCS). Synchronization in S-phase was achieved by incubating cells for 24 h with aphidicolin (5 µg/ml) before washing with PBS and allowing cells to cycle for 3 hrs into S-phase. Cells were electroporated as described (Dundr et al., 2002) and used 16–25 hrs after.
RNA analysis
RNA was purified using the RNAqueous kit (Ambion). cDNA was created from 1–5 µg of RNA using either the cDNA archive kit (Applied Biosystems) and random primers according to manufacturer’s instructions. Analysis of cDNA was performed by quantitative real time PCR (qRT-PCR) in 25 µl reactions using iQ SYBR Green Supermix (BioRad) in a Biorad iCycler. Quantitation of pre-rRNA was performed using the primers pre-rRNAF1 5’ AGCCGATCGGCTCGCTGGCC and pre-rRNAR1 5’ CCGTCGCGGCTCGGACCCG. Reaction conditions were 95 °C for 3min, followed by 40 cycles of 95 °C for 20s, 72 °C for 60s. Pre-rRNA levels were normalized to cyclophilin A. Reaction conditions for cyclophilin A amplification were 95 °C for 3min, followed by 40 cycles of 95 °C for 20s, 60 °C for 60s. Specificity of reactions was confirmed by analysis of the qRT-PCR melt curves and DNA electrophoresis of the final product.
Chromatin immunoprecipitation assay
Cells (4 ×10⁶−1.2×10⁷) were synchronized in G1 or S phase and crosslinked in 0.25 % formaldehyde from a 37% stock solution (Sigma) for 10 min at 37 °C. Crosslinking was stopped by addition of glycine to a final concentration of 0.125 M for 10 min at RT. Fixed cells were washed with ice-cold PBS, scraped into PBS containing protease inhibitors (Calbiochem), and pelleted by centrifugation. Cells were resuspended at 1–2 ×10⁷ ml−1 in lysis buffer (0.1% SDS, 10 mM EDTA and 50 mM Tris HCl pH 8) with protease inhibitors. Cells were sonicated in 500–700 µl volume in a 4 °C waterbath by repeated cycles of 45 s on and 15 s off for 30 min at the high setting of a Diagenode BIORUPTOR, yielding genomic fragments of 0.6 – 1.2 kb. The cell lysates were diluted ~ 1:10 to the same final DNA concentration with ChIP dilution buffer (0.01% SDS, 1.1% Triton X-100, 1.2 mM EDTA, 16.7 mM Tris HCl pH 8, and 167 mM NaCl) containing protease inhibitors. For each sample, lysate containing 200 µg DNA was precleared for 2 h at 4 °C with Protein A- or Protein G-agarose/salmon sperm DNA (Upstate Biotechnology) beads. Samples were immunoprecipitated overnight at 4 °C with either no antibody, 20 µl rabbit polyclonal antibody against the largest RNA pol I subunit RNAP1-β’ (194 kDA) (Hannan et al, 1998) or 4 µg (20 µl) anti-UBF antibody (Santa Cruz Biotechnology). Immune complexes were recovered by addition of Protein A or Protein G agarose beads (30 µl per ml lysate), and incubated for 1 h at 4 °C. Beads were washed successively with 1 ml of low salt buffer (0.1% SDS, 1% Triton X-100, 2 mM EDTA, 150 mM NaCl and 20 mM Tris HCl pH 8), high salt buffer (0.1% SDS, 1% Triton X-100, 2 mM EDTA, 500 mM NaCl and 20 mM Tris HCl pH 8), LiCl buffer (0.25 M LiCl, 1% nonidet P-40, 1% sodium deoxycholate, 1 mM EDTA, and 10 mM Tris HCl pH 8) and TE (10 mM Tris HCl pH 8, 1 mM EDTA), containing protease inhibitors. Immune complexes were eluted at RT with 250 µl 1% SDS followed by 250 µl 1.5% SDS. Crosslinks of input chromatin and eluted samples were reversed by addition of 200 mM NaCl, 10 mM EDTA, 40 mM Tris HCl pH 7 and 20 mg/ml Proteinase K (Ambion) in a final volume of 550 µl and incubation overnight at 65 °C. Samples were phenol/chloroform extracted, ethanol precipitated and resuspended in 40 µl H2O.
For quantiation, qPCR was performed using 2.5 µl immunoprecipitate or input DNA and 300 nM primers with iQ SYBRGreen Supermix (Bio-Rad) for 41 cycles of 95 °C 15 s and 60 °C 1 min using a MyiQ Single Color thermal cycler (Bio-Rad). The primer coordinates relative to the 45 S initiation site were as follows: promoter 42855–42870 and 105–120; 5’ETS 1392–1411 and 1481–1500; HrDNA4 3990–4011 and 4073–4092; and HrDNA27 27366–27385 and 27459–27478 (O’Sullivan et al., 2002). Percent immunoprecipitated DNA of total input DNA was determined by: % total input chromatin = (amplification efficiency) (Ctinput-Ctsample) × vol input/vol sample × 10−1.
In situ visualization of transcription sites
Transcription sites were labeled as described in (Elbi et al., 2002) and samples observed on a Zeiss LSM 510 laser scanning confocal microscope using a 63× oil objective.
Photobleaching microscopy
Fluorescence recovery after photobleaching experiments (FRAP) were performed on a Zeiss LSM 510 confocal microscope with a 63 ×/ 1.4 N.A. oil objective. GFP was excited with the 488 nm line of Ar laser and GFP emission monitored using a 505 nm longpath filter. Cells were maintained at 37°C using a Nevtek ASI Air Stream incubator. In transfected cells a circular region of interest ~1.5 m in diameter was bleached for 40 ms using the 488 nm line at 100 % power. Data was normalized as described in (Dundr et al., 2002). All FRAP experimental data were the average of at least 16 cells.
Kinetic modeling
FRAP data was analyzed using a previously derived mathematical model of the transcription process (Dundr et al., 2002). Solutions to the model were obtained using the differential equation solvers in the Berkeley Madonna software. Parameters were optimized to fit the cell cycle FRAP data, since only the ratio of kon and koff is well defined, kon was held constant as previously determined (Dundr et al., 2002). Optimized fits were further constrained using the empirically derived distribution of fluorescent molecules and fraction of molecules bleached (Supplementary Table S1). FRAP data for GFP-fusion proteins in S-phase were analyzed by systematically varying different parameters, while constraining values of empirically derived distribution of fluorescent molecules and fraction of molecules bleached in S-phase (Supplementary Table S1). Sensitivity analysis was performed on best-fits by changing each rate constant until the fit no longer described the data as judged by the standard deviation of the experimental data. These maxima and minima values in parameter space were used to define the acceptable range of the residence times and probabilities.
Supplementary Material
Acknowledgements
We thank C. Elbi, T. Voss , R. Tsien and L. Rothblum for reagents, M. Dundr and R.D. Phair for discussions and comments on the manuscript, K, Meaburn for help with figures. Fluorescence imaging was performed at the NCI Fluorescence Imaging Facility. This research was supported by the Intramural Research Program of the NIH, NCI, Center for Cancer Research.
Footnotes
Publisher's Disclaimer: This is a PDF file of an unedited manuscript that has been accepted for publication. As a service to our customers we are providing this early version of the manuscript. The manuscript will undergo copyediting, typesetting, and review of the resulting proof before it is published in its final citable form. Please note that during the production process errors may be discovered which could affect the content, and all legal disclaimers that apply to the journal pertain.
Contributor Information
Stanislaw A. Gorski, National Cancer Institute, National Institutes of Health, Bethesda, MD 20892, USA
Sara K. Snyder, National Cancer Institute, National Institutes of Health, Bethesda, MD 20892, USA
Sam John, National Cancer Institute, National Institutes of Health, Bethesda, MD 20892, USA.
Ingrid Grummt, Division of Molecular Biology of the Cell II, German Cancer Research Center, Heidelberg, Germany.
Tom Misteli, National Cancer Institute, National Institutes of Health, Bethesda, MD 20892, USA.
References
- Agarwal ML, Agarwal A, Taylor WR, Stark GR. p53 controls both the G2/M and the G1 cell cycle checkpoints and mediates reversible growth arrest in human fibroblasts. Proc Natl Acad Sci U S A. 1995;92:8493–8497. doi: 10.1073/pnas.92.18.8493. [DOI] [PMC free article] [PubMed] [Google Scholar]
- Becker M, Baumann C, John S, Walker DA, Vigneron M, McNally JG, Hager GL. Dynamic behavior of transcription factors on a natural promoter in living cells. EMBO Rep. 2002;3:1188–1194. doi: 10.1093/embo-reports/kvf244. [DOI] [PMC free article] [PubMed] [Google Scholar]
- Bodem J, Dobreva G, Hoffmann-Rohrer U, Iben S, Zentgraf H, Delius H, Vingron M, Grummt I. TIF-IA, the factor mediating growth-dependent control of ribosomal RNA synthesis, is the mammalian homolog of yeast Rrn3p. EMBO Rep. 2000;1:171–175. doi: 10.1093/embo-reports/kvd032. [DOI] [PMC free article] [PubMed] [Google Scholar]
- Boireau S, Maiuri P, Basyuk E, de la Mata M, Knezevich A, Pradet-Balade B, Bäcker V, Kornblihtt A, Marcello A, Bertrand E. The transcriptional cycle of HIV-1 in real-time and live cells. J Cell Biol. 2007;179:291–304. doi: 10.1083/jcb.200706018. [DOI] [PMC free article] [PubMed] [Google Scholar]
- Bosisio D, Marazzi I, Agresti A, Shimizu N, Bianchi ME, Natoli G. A hyper-dynamic equilibrium between promoter-bound and nucleoplasmic dimers controls NF-kappaB-dependent gene activity. Embo J. 2006;25:798–810. doi: 10.1038/sj.emboj.7600977. [DOI] [PMC free article] [PubMed] [Google Scholar]
- Cavanaugh AH, Hirschler-Laszkiewicz I, Hu Q, Dundr M, Smink T, Misteli T, Rothblum LI. Rrn3 phosphorylation is a regulatory check-point for ribosome biogenesis. J Biol Chem. 2002;277:27423–27432. doi: 10.1074/jbc.M201232200. [DOI] [PubMed] [Google Scholar]
- Chen D, Dundr M, Wang C, Leung A, Lamond A, Misteli T, Huang S. Condensed mitotic chromatin is accessible to transcription factors and chromatin structural proteins. J Cell Biol. 2005;168:41–54. doi: 10.1083/jcb.200407182. [DOI] [PMC free article] [PubMed] [Google Scholar]
- Chen D, Huang S. Nucleolar components involved in ribosome biogenesis cycle between the nucleolus and nucleoplasm in interphase cells. J Cell Biol. 2001;153:169–176. doi: 10.1083/jcb.153.1.169. [DOI] [PMC free article] [PubMed] [Google Scholar]
- Darzacq X, Shav-Tal Y, de Turris V, Brody Y, Shenoy SM, Phair RD, Singer RH. In vivo dynamics of RNA polymerase II transcription. Nat Struct Mol Biol. 2007;14:796–806. doi: 10.1038/nsmb1280. [DOI] [PMC free article] [PubMed] [Google Scholar]
- Dundr M, Hoffmann-Rohrer U, Hu Q, Grummt I, Rothblum LI, Phair RD, Misteli T. A kinetic framework for a mammalian RNA polymerase in vivo. Science. 2002;298:1623–1626. doi: 10.1126/science.1076164. [DOI] [PubMed] [Google Scholar]
- Dundr M, Misteli T, Olson MO. The dynamics of postmitotic reassembly of the nucleolus. J Cell Biol. 2000;150:433–446. doi: 10.1083/jcb.150.3.433. [DOI] [PMC free article] [PubMed] [Google Scholar]
- Elbi C, Misteli T, Hager GL. Recruitment of dioxin receptor to active transcription sites. Mol Biol Cell. 2002;13:2001–2015. doi: 10.1091/mboc.13.6.mk0602002001. [DOI] [PMC free article] [PubMed] [Google Scholar]
- Gorski S, Misteli T. Systems biology in the cell nucleus. J Cell Sci. 2005;118:4083–4092. doi: 10.1242/jcs.02596. [DOI] [PubMed] [Google Scholar]
- Grummt I. Life on a planet of its own: regulation of RNA polymerase I transcription in the nucleolus. Genes Dev. 2003;17:1691–1702. doi: 10.1101/gad.1098503R. [DOI] [PubMed] [Google Scholar]
- Hanada K, Song CZ, Yamamoto K, Yano K, Maeda Y, Yamaguchi K, Muramatsu M. RNA polymerase I associated factor 53 binds to the nucleolar transcription factor UBF and functions in specific rDNA transcription. Embo J. 1996;15:2217–2226. [PMC free article] [PubMed] [Google Scholar]
- Hannan RD, Cavanaugh A, Hempel WM, Moss T, Rothblum L. Identification of a mammalian RNA polymerase I holoenzyme containing components of the DNA repair/replication system. Nucleic Acids Res. 1999;27:3720–3727. doi: 10.1093/nar/27.18.3720. [DOI] [PMC free article] [PubMed] [Google Scholar]
- Hoogstraten D, Nigg AL, Heath H, Mullenders LH, van Driel R, Hoeijmakers JH, Vermeulen W, Houtsmuller AB. Rapid switching of TFIIH between RNA polymerase I and II transcription and DNA repair in vivo. Mol Cell. 2002;10:1163–1174. doi: 10.1016/s1097-2765(02)00709-8. [DOI] [PubMed] [Google Scholar]
- Karpova TS, Kim MJ, Spriet C, Nalley K, Stasevich TJ, Kherrouche Z, Heliot L, McNally JG. Concurrent fast and slow cycling of a transcriptional activator at an endogenous promoter. Science. 2008;319:466–469. doi: 10.1126/science.1150559. [DOI] [PubMed] [Google Scholar]
- Kimura H, Sugaya K, Cook PR. The transcription cycle of RNA polymerase II in living cells. J Cell Biol. 2002;159:777–782. doi: 10.1083/jcb.200206019. [DOI] [PMC free article] [PubMed] [Google Scholar]
- Klein J, Grummt I. Cell cycle-dependent regulation of RNA polymerase I transcription: the nucleolar transcription factor UBF is inactive in mitosis and early G1. Proc Natl Acad Sci U S A. 1999;96:6096–6101. doi: 10.1073/pnas.96.11.6096. [DOI] [PMC free article] [PubMed] [Google Scholar]
- Lee TI, Young RA. Transcription of eukaryotic protein-coding genes. Annu Rev Genet. 2000;34:77–137. doi: 10.1146/annurev.genet.34.1.77. [DOI] [PubMed] [Google Scholar]
- Long EO, Dawid IB. Repeated genes in eukaryotes. Annu Rev Biochem. 1980;49:727–764. doi: 10.1146/annurev.bi.49.070180.003455. [DOI] [PubMed] [Google Scholar]
- Mais C, Wright JE, Prieto JL, Raggett SL, McStay B. UBF-binding site arrays form pseudo-NORs and sequester the RNA polymerase I transcription machinery. Genes Dev. 2005;19:50–64. doi: 10.1101/gad.310705. [DOI] [PMC free article] [PubMed] [Google Scholar]
- Mayer C, Bierhoff H, Grummt I. The nucleolus as a stress sensor: JNK2 inactivates the transcription factor TIF-IA and down-regulates rRNA synthesis. Genes Dev. 2005;19:933–941. doi: 10.1101/gad.333205. [DOI] [PMC free article] [PubMed] [Google Scholar]
- Mayer C, Zhao J, Yuan X, Grummt I. mTOR-dependent activation of the transcription factor TIF-IA links rRNA synthesis to nutrient availability. Genes Dev. 2004;18:423–434. doi: 10.1101/gad.285504. [DOI] [PMC free article] [PubMed] [Google Scholar]
- McNally JG, Muller WG, Walker D, Wolford R, Hager GL. The glucocorticoid receptor: rapid exchange with regulatory sites in living cells. Science. 2000;287:1262–1265. doi: 10.1126/science.287.5456.1262. [DOI] [PubMed] [Google Scholar]
- Metivier R, Penot G, Hubner MR, Reid G, Brand H, Kos M, Gannon F. Estrogen receptor-alpha directs ordered, cyclical, and combinatorial recruitment of cofactors on a natural target promoter. Cell. 2003;115:751–763. doi: 10.1016/s0092-8674(03)00934-6. [DOI] [PubMed] [Google Scholar]
- Misteli T. Protein dynamics: implications for nuclear architecture and gene expression. Science. 2001;291:843–847. doi: 10.1126/science.291.5505.843. [DOI] [PubMed] [Google Scholar]
- Moss T. At the crossroads of growth control; making ribosomal RNA. Curr Opin Genet Dev. 2004;14:210–217. doi: 10.1016/j.gde.2004.02.005. [DOI] [PubMed] [Google Scholar]
- Mueller F, Wach P, McNall JG. Evidence for a common mode of transcription factor interaction with chromatin as revealed by improved quantitative fluorescence recovery after photobleaching. Biophys J. 2008;94:3323–3339. doi: 10.1529/biophysj.107.123182. [DOI] [PMC free article] [PubMed] [Google Scholar]
- O'Sullivan AC, Sullivan GJ, McStay B. UBF binding in vivo is not restricted to regulatory sequences within the vertebrate ribosomal DNA repeat. Mol Cell Biol. 2002;22:657–668. doi: 10.1128/MCB.22.2.657-668.2002. [DOI] [PMC free article] [PubMed] [Google Scholar]
- Phair RD, Gorski SA, Misteli T. Measurement of dynamic protein binding to chromatin in vivo, using photobleaching microscopy. Methods Enzymol. 2004;375:393–414. doi: 10.1016/s0076-6879(03)75025-3. [DOI] [PubMed] [Google Scholar]
- Phair RD, Scaffidi P, Elbi C, Vecerova J, Dey A, Ozato K, Brown DT, Hager G, Bustin M, Misteli T. The global nature of transient protein-chromatin interactions in vivo. Mol. Cell. Biol. 2004;24:6393–6402. doi: 10.1128/MCB.24.14.6393-6402.2004. [DOI] [PMC free article] [PubMed] [Google Scholar]
- Russell J, Zomerdijk JC. RNA-polymerase-I-directed rDNA transcription, life and works. Trends Biochem Sci. 2005;30:87–96. doi: 10.1016/j.tibs.2004.12.008. [DOI] [PMC free article] [PubMed] [Google Scholar]
- Saez-Vasquez J, Pikaard CS. Extensive purification of a putative RNA polymerase I holoenzyme from plants that accurately initiates rRNA gene transcription in vitro. Proc Natl Acad Sci U S A. 1997;94:11869–11874. doi: 10.1073/pnas.94.22.11869. [DOI] [PMC free article] [PubMed] [Google Scholar]
- Schnapp A, Pfleiderer C, Rosenbauer H, Grummt I. A growth-dependent transcription initiation factor (TIF-IA) interacting with RNA polymerase I regulates mouse ribosomal RNA synthesis. Embo J. 1990;9:2857–2863. doi: 10.1002/j.1460-2075.1990.tb07475.x. [DOI] [PMC free article] [PubMed] [Google Scholar]
- Schneider DA, Nomura M. RNA polymerase I remains intact without subunit exchange through multiple rounds of transcription in Saccharomyces cerevisiae. Proc Natl Acad Sci U S A. 2004;101:15112–15117. doi: 10.1073/pnas.0406746101. [DOI] [PMC free article] [PubMed] [Google Scholar]
- Seither P, Iben S, Grummt I. Mammalian RNA polymerase I exists as a holoenzyme with associated basal transcription factors. J Mol Biol. 1998;275:43–53. doi: 10.1006/jmbi.1997.1434. [DOI] [PubMed] [Google Scholar]
- Seither P, Zatsepina O, Hoffmann M, Grummt I. Constitutive and strong association of PAF53 with RNA polymerase I. Chromosoma. 1997;106:216–225. doi: 10.1007/s004120050242. [DOI] [PubMed] [Google Scholar]
- Sims RJ, 3rd, Mandal SS, Reinberg D. Recent highlights of RNA-polymerase-II-mediated transcription. Curr Opin Cell Biol. 2004;16:263–271. doi: 10.1016/j.ceb.2004.04.004. [DOI] [PubMed] [Google Scholar]
- Sprague BL, Pego RL, Stavreva DA, McNally JG. Analysis of binding reactions by fluorescence recovery after photobleaching. Biophys J. 2004;86:3473–3495. doi: 10.1529/biophysj.103.026765. [DOI] [PMC free article] [PubMed] [Google Scholar]
- Stefanovsky V, Langlois F, Gagnon-Kugler T, Rothblum LI, Moss T. Growth factor signaling regulates elongation of RNA polymerase I transcription in mammals via UBF phosphorylation and r-chromatin remodeling. Mol Cell. 2006a;21:629–639. doi: 10.1016/j.molcel.2006.01.023. [DOI] [PubMed] [Google Scholar]
- Stefanovsky VY, Langlois F, Bazett-Jones D, Pelletier G, Moss T. ERK modulates DNA bending and enhancesome structure by phos-phorylating HMG1-boxes 1 and 2 of the RNA polymerase I transcription factor UBF. Biochemistry. 2006b;45:3626–3634. doi: 10.1021/bi051782h. [DOI] [PubMed] [Google Scholar]
- Stenoien DL, Patel K, Mancini MG, Dutertre M, Smith CL, O'Malley BW, Mancini MA. FRAP reveals that mobility of oestrogen receptor-alpha is ligand- and proteasome-dependent. Nat Cell Biol. 2001;3:15–23. doi: 10.1038/35050515. [DOI] [PubMed] [Google Scholar]
- Weisenberger D, Scheer U. A possible mechanism for the inhibition of ribosomal RNA gene transcription during mitosis. J Cell Biol. 1995;129:561–575. doi: 10.1083/jcb.129.3.561. [DOI] [PMC free article] [PubMed] [Google Scholar]
- Wright JE, Mais C, Prieto JL, McStay B. A role for upstream binding factor in organizing ribosomal gene chromatin. Biochem Soc Symp. 2006:77–84. doi: 10.1042/bss0730077. [DOI] [PubMed] [Google Scholar]
- Yao J, Munson KM, Webb WW, Lis JT. Dynamics of heat shock factor association with native gene loci in living cells. Nature. 2006;442:1050–1053. doi: 10.1038/nature05025. [DOI] [PubMed] [Google Scholar]
- Yao J, Ardehali MB, Fecko CJ, Webb WW, Lis JT. Intranuclear distribution and local dynamics of RNA polymerase II during transcription activation. Mol Cell. 2007;28:978–990. doi: 10.1016/j.molcel.2007.10.017. [DOI] [PubMed] [Google Scholar]
- Yuan X, Zhao J, Zentgraf H, Hoffmann-Rohrer U, Grummt I. Multiple interactions between RNA polymerase I, TIF-IA and TAF(I) subunits regulate preinitiation complex assembly at the ribosomal gene promoter. EMBO Rep. 2002;3:1082–1087. doi: 10.1093/embo-reports/kvf212. [DOI] [PMC free article] [PubMed] [Google Scholar]
- Yuan X, Zhou Y, Casanova E, Chai M, Kiss E, Grone HJ, Schutz G, Grummt I. Genetic inactivation of the transcription factor TIF-IA leads to nucleolar disruption, cell cycle arrest, and p53-mediated apoptosis. Mol Cell. 2005;19:77–87. doi: 10.1016/j.molcel.2005.05.023. [DOI] [PubMed] [Google Scholar]
- Zhao J, Yuan X, Frodin M, Grummt I. ERK-dependent phosphorylation of the transcription initiation factor TIF-IA is required for RNA polymerase I transcription and cell growth. Mol Cell. 2003;11:405–413. doi: 10.1016/s1097-2765(03)00036-4. [DOI] [PubMed] [Google Scholar]
Associated Data
This section collects any data citations, data availability statements, or supplementary materials included in this article.