Abstract
The bleomycins (BLMs) are a family of natural glycopeptides used clinically as antitumor agents. In the presence of required cofactors (Fe2+ and O2), BLM causes both single-stranded (ss) and double-stranded (ds) DNA damage with the latter thought to be the major source of cytotoxicity. Previous biochemical and structural studies have demonstrated that BLM can mediate ss cleavage through multiple binding modes. However, our studies have suggested that ds cleavage occurs by partial intercalation of BLM's bithiazole tail 3′ to the first cleavage site that facilitates its re-activation and re-organization to the second strand without dissociation from the DNA where the second cleavage event occurs. To test this model, a BLM A5 analog (CD-BLM) with β-cyclodextrin attached to its terminal amine was synthesized. This attachment presumably precludes binding via intercalation. Cleavage studies measuring ss:ds ratios by two independent methods were carried out. Studies using [32P]-hairpin technology harboring a single ds cleavage site reveal a ss:ds ratio of 6.7 ± 1.2:1 for CD-BLM and 3.4:1 and 3.1 ± 0.3:1 for BLM A2 and A5, respectively. In contrast with BLM A5 and A2, however, CD-BLM mediates ds-DNA cleavage through cooperative binding of a second CD-BLM molecule to effect cleavage on the second strand. Studies using the supercoiled plasmid relaxation assay revealed a ss:ds ratio of 2.8:1 for CD-BLM in comparison with 7.3:1 and 5.8:1, for BLM A2 and A5, respectively. This result in conjunction with the hairpin results suggest that multiple binding modes of a single BLM can lead to ds-DNA cleavage and that ds cleavage can occur using one or two BLM molecules. The significance of the current study to understanding BLM's action in vivo is discussed.
INTRODUCTION
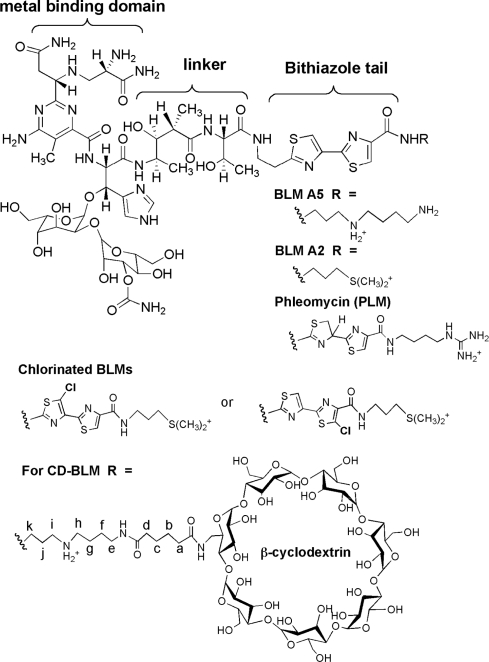
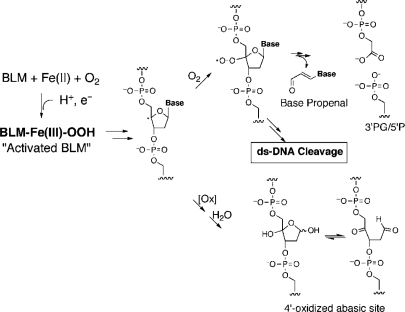
The bleomycins (BLMs, Figure 1) are a group of natural glycopeptides produced by Steptomyces verticillus that have potent antitumor activity against lymphomas, head and neck cancers and testicular cancer (1–3). The BLMs’ therapeutic efficacy is proposed to be related to their ability to cause both single-stranded (ss) and double-stranded (ds) DNA damage in the presence of the required cofactors (Fe(II), O2 and a one-electron reductant) [(4–7); Figure 2]. The ds-DNA cleavage events have long been believed to be the major source of BLMs’ cytotoxicity (8,9).
Figure 1.
Structures of BLM A2, A5, Phleomycin D1 (PLM), chlorinated BLMs and CD-BLM.
Figure 2.
Pathways of BLM-mediated DNA damage.
A model in which a single BLM molecule, which has a single metal-binding site that can be activated for cleavage, can effect two cleavage events without dissociation from DNA has been proposed by Povirk et al. (10). This model was initially based on the analysis of ss to ds cleavage ratios using the supercoiled DNA relaxation assay (11), which revealed a constant ss:ds cleavage ratio (6:1) over a 20-fold range of BLM concentrations. Povirk et al. also studied the chemistry and sequence selectivity of the ds-DNA cleavage by analyzing 30 ds-cleavage sites using native DNA gel electrophoresis (10,12). These studies led to a set of sequence selectivity rules for BLM-mediated ds-DNA cleavage that could not be explained by two random ss cleavage events (10).
Using the internally [32P]-labeled hairpin DNA technology to analyze the ss to ds cleavage products, Absalon et al. confirmed the sequence selectivity rules and extended our understanding of the chemical mechanism for ds-DNA cleavage (13,14). In one of several hairpin DNAs examined that contained a hot spot for ds cleavage (5′-GTAC-3′, _ indicates the cleavage site), they established a ss:ds ratio of 3.3 and that this cleavage ratio remained constant over a 70-fold range of the BLM concentrations (13). Furthermore, the ss:ds ratio was not perturbed by the competitive binding of the chemically unreactive BLM-Co(III)-OOH. This result supported the model of a single BLM molecule effecting ds-DNA cleavage and precluded a model that involved cooperative binding of a second BLM that mediated cleavage on the second strand.
Structural models of BLM-Co(III)-OOH bound to several oligonucleotides containing a single BLM-binding site have been determined using 2D NMR studies (15,16), which provided a working model to explain the mechanism by which a single BLM molecule can effect ds-cleavage without dissociation from the DNA. This model requires binding of the bithiazole tail of BLM by partial intercalation, 3′ to the first cleavage site. Subsequent to damage initiation on the first strand, the BLM molecule is repositioned to the second strand by rotation of 180° around the C-C bond connecting the two thiazolium rings and by further rotation of 117° around the axis perpendicular to the bithiazole ring (15). The mechanism of triggering the re-organization to the second cleavage site and the relative rate of this process to dissociation from the DNA play a key role in identifying which sites are hot spots for ds-cleavage.
Several studies using BLM analogs have demonstrated that alternative binding modes to the partial intercalation can lead to ss-DNA cleavage. BLM analogs with a chlorinated bithiazole (Figure 1 in which either H5 or H5′ of the bithiazole is substituted with chlorine atoms) were shown to mediate a sequence-selective DNA cleavage similar to BLM (17,18). In these studies, the chlorinated bithiazole tail was shown to be located in the minor groove of DNA by light-mediated DNA cleavage (18). An additional independent study by the Hecht group has also shown that BLM A5 tethered through its polyamine tail to either controlled pore glass (CPG) beads (19,20) or a dendrimer (21) can also cleave DNA. These attachments were designed to be sufficiently large to prevent binding of the bithiazole tail by partial intercalation. The efficiency and sequence selectivity of cleavage by these tethered BLMs has been reported to be similar to that observed with the untethered BLM, demonstrating that non-intercalative modes of binding can also lead to DNA cleavage (19–21). Unfortunately, the relationship of the alternative binding mode to the mechanism of ds-DNA cleavage was not quantitatively investigated in these studies (19,21).
In this study, the significance of the partial intercalation in the model, to explain how one BLM molecule can affect ds-cleavage, is directly tested using a BLM A5 analog with a β-cyclodextrin attached to the terminal amine (Figure 1). This modification is thought to be sufficiently large to prevent the binding of BLM by partial intercalation of the bithiazole tail (22,23). The ability of CD-BLM to effect ds-DNA cleavage is reported using the internally [32P]-labeled hairpin DNA method (13) and the supercoiled plasmid relaxation assay (11). The results indicate that CD-BLM can mediate both ss- and ds-DNA cleavage with the same sequence selectivity as BLM A5, although 5-fold less efficiently. The ss:ds cleavage ratio for CD-BLM is determined to be 6.7 ± 1.2:1 on the hairpin DNA substrate, higher than the ratio for BLM A2 (3.4:1) or A5 (3.1 ± 0.3:1). Competition assays of the CD-BLM-mediated ss- and ds-DNA cleavage in the presence of chemically unreactive BLM-Co(III)-OOH indicate that the ds-DNA cleavage is mediated by two CD-BLM molecules. Surprisingly, cleavage studies using the supercoiled plasmid relaxation assay revealed a much lower ss:ds cleavage ratio (2.8:1) for CD-BLM than for BLM A2 (7.3:1) or A5 (5.8:1). Furthermore, this ratio was not affected by chemically unreactive BLM-Co(III)-OOH. The studies using two independent mechanisms to examine the ss:ds cleavage ratios suggest that BLM can mediate ds-DNA cleavage by multiple binding modes, not just the partial intercalation binding mode that we originally proposed.
EXPERIMENTAL SECTION
Materials
GT-2 (Figure 3) and its truncated primer containing the first 36 nucleotides (5′-CGA ATT CTG CTG TAC ACT TTC CCA AAA AGG GAA AGT-3′) were synthesized by Invitrogen Inc. on a 1 μmol scale and were purified by polyacrylamide gel electrophoresis (PAGE) (24). BLM A2 and A5 were purchased from CalBiochem in a metal-free form. BLM-Co(III)-OOH (Co-BLM) was prepared and purified as previously described (16). The concentration of CD-BLM was determined by the extinction coefficient at 292 nm (14 500 M−1 cm−1), assumed to be identical to BLM A5. Escherichia coli DNA polymerase I-Klenow Fragment (Klenow Fragment) was purchased from New England Biolabs (1 U is defined as the amount of enzyme required to convert 10 nmol dNTPs into an acid-insoluble form in 30 min at 37°C). T4 Polynucleotide Kinase (T4 PNK) was purchased from New England Biolabs (1 U is defined as the amount of enzyme to incorporate 1 nmol acid-insoluble [32P] in 30 min at 37°C). [γ-32P] Adenosine triphosphate (ATP) (3000 Ci/mmol) and [α-32P] deoxyguanosine triphosphate (dGTP) (3000 Ci/mmol) were purchased from Perkin Elmer Life Sciences. β-cyclodextrin (2, Figure 4) and other chemicals were purchased from Sigma-Aldrich. Mono-6-deoxy-6-amino-β-cyclodextrin (5, Figure 4) was synthesized from 2 according to published procedures (25). The yield and characterization of each intermediate are summarized in the Supporting Information. Dioxane was purified by refluxing over KOH followed by distillation from sodium. Proton NMR spectra were measured on Bruker 400 MHz or Varian XL 500 MHz spectrometers using tetramethylsilane (TMS) as an internal reference at 0.00 ppm.
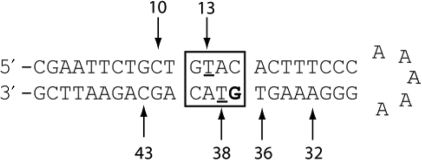
Figure 3.
Sequence of GT-2. The predicted ss-cleavage sites of GT-2 are numbered. The G in bold denotes the internal [32P] labeling site.
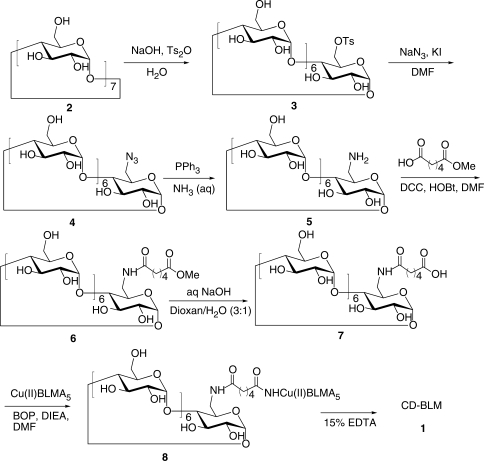
Figure 4.
Synthesis of CD-BLM (1).
Synthesis of CD-BLM (1, Figure 4)
Synthesis of 6
Adipic acid monomethyl ester (5.23 mg, 0.033 mmol) was added to a solution of 5 (35 mg, 0.031 mmol, Supporting Information) in 0.6 ml of DMF. After the solution was cooled to −10°C, dicyclohexylcarbodiimide (7.6 mg, 0.037 mmol) and N-hydroxybenzotriazole (5 mg, 0.037 mmol) were added. The resulting reaction mixture was stirring at room temperature for 24 h. Insoluble materials were removed by filtration and 10 ml acetone was added to the filtrate. The precipitate was collected and dried in vacuo to give 30 mg of crude 6. The crude product (25 mg) was dissolved in n-butanol/ethanol/H2O (5:4:3) and 1 g of silica gel was added. The solvent was then removed in vacuo. The dried silica gel with 6 absorbed was loaded on the top of a pre-packed column (1.5 × 10 cm). The compound was eluted with the same solvent under pressure. Fractions containing 6 were pooled based on TLC [silica, n-BuOH/ethanol/H2O (5:4:3)] and the solvent was then removed in vacuo to give 23 mg of 6 (70%). 1H NMR (400 MHz, DMSO-d6, δ): 6.07–5.61 (m, 14H, –OH at Positions 2 and 3), 4.94–4.73 (m, 7H, H1), 4.63–4.5 (m, 6H, –OH at Position 6), 3.81–3.52 (m, 31 H, H3, H5, H6 and –OCH3), 3.47–3.11 (m, overlaps with HOD, H2 and H4), 2.30–2.28 (m, 2H, Ha), 2.20–2.08 (m, 2H, Hd), 1.58–1.30 (m, 4H, Hb and Hc). ESI-MS (m/z): [M + H]+ calcd. for C49H81NO37, 1276.4560; found, 1276.4565.
Synthesis of 7
NaOH (25.6 μl of a 2M solution, 51.2 μmol) was added to 0.8 ml of dioxane/H2O (3:1) containing 6 (39 mg, 30.58 μmol) and stirred at room temperature for 6 h. The reaction mixture was then neutralized with glacial acetic acid and the solvent removed in vacuo. The crude product (40 mg) was dissolved in 2 ml of water and was precipitated by adding 50 ml of acetone and further purified by C18 reverse-phase chromatography (10 ml). The column was washed with 100 ml of H2O, followed by 5% methanol/H2O. Fractions were collected, pooled and solvent removed in vacuo to give 7 as white solid (20 mg, 52%). 1H NMR (400 MHz, D2O, δ): 5.05–4.95 (m, 7H, H1), 3.95–3.68 (m, 27H, H3, H5 and H6), 3.60–3.45 (m, 13H, H2, H4), 3.40–3.3 (m, 1H, H4), 3.26 (dd, 1H, H6), 2.25–2.16 (m, 2H, Ha), 2.15–2.08 (m, 2H, Hd), 1.59–1.45 (m, 4H, Hb and Hc). ESI-MS (m/z): [M – H]− calcd. for C48H78NO37, 1260.4247; found, 1260.4278.
Coupling 7 with Cu(II)BLMA5 to yield 8
N,N-diisopropylethylamine (0.51 mg, 3.96 μmol) and the BOP reagent (0.88 mg, 1.98 μmol) were added to a solution of 7 (2.5 mg, 1.98 μmol) in 0.3 ml of DMF at room temperature. The reaction was stirred for 2 min at room temperature and then added to an anhydrous mixture of Cu(II)BLMA5 (1.98 μmol) in 0.2 ml of DMF at 0°C. The reaction mixture was stirred at 4°C for 36 h. Solvent was removed in vacuo to give a blue product, which was further purified by reverse-phase HPLC using an Econosil C18 column (Alltech, 10 μm, 250 mm × 4.6 mm). The elution involved a linear gradient from 0 to 50% acetonitrile in 0.1 M NH4OAc (pH 6.8) over 60 min with a flow rate of 1.0 ml/min. Compound, retention time, yield: 8, 27.8 min, 0.95 μmol, 48%; Cu(II)BLMA5, 34.9 min, 0.98 μmol, 50%. ESI-MS (m/z): [M+2H]2+ calcd. for C105H166N20O57S2Cu, 1372.9716; found, 1372.9767.
Synthesis of metal-free β-cyclodextrin-tethered BLM A5 (CD-BLM, 1)
The copper complex of CD-BLM (8, 0.81 μmol) was dissolved in 0.6 ml 15% Na2EDTA (pH 4.65) and was stirred at 4°C for 20 h. The reaction mixture was purified by RP-HPLC using an Econosil C18 column (4.6 × 250 mm) with a linear gradient from 20 to 50% methanol in 0.1 M ammonium acetate (pH 6.8) over 50 min with a flow rate of 1.0 ml/min. Compound, retention time, yield: 1, 28.2 min, 95%. The proton chemical shifts of 1 are summarized in Table S1. ESI-MS (m/z): [M + 2H]2+ calcd. for C105H168N20O57S2, 1342.5146; found, 1342.5163.
Preparation of 5′- and internal-[32P] GT-2 (Figure 3)
The 5′- and internal-[32P] GT-2 were synthesized following the published procedure (13) and were further purified by PAGE (24). The specific activity for 5′-[32P]-GT-2 was 2.1 × 10⁶ cpm/μmol and for internal-[32P]-GT-2, was 2 × 10⁷ cpm/μmol.
Cleavage of internal-[32P] GT-2 by BLMs
The reaction mixture of 80 μl contained internal-[32P] GT-2 (100 000 cpm), 0.6 μg/μl calf thymus DNA, 50 mM NaCl and 50 mM HEPES pH 7.5. Before adding BLM, the mixture was heated to 95°C for 2 min in a heating block and was cooled to 4°C over 1 h. BLM A5 or CD-BLM was activated ex situ by mixing 500 μM BLM with an equal concentration and volume of iron(II) ((NH4)2Fe(SO4)2) for 60 ± 2 s at 4°C (13). For the reactions with low BLM concentrations (2.5 to 10 μM), the activation mixture was diluted 10-fold with deionized water to make a 25 μM solution. For the reactions with high BLM concentrations (10 to 50 μM), the activation mixture was used without further dilution. An appropriate aliquot of the activation mixture (250 μM or 25 μM after dilution) was added to the reaction mixture to achieve the desired final concentration. The reaction mixture was incubated at 4°C for 10 min and was quenched by adding 50 μl of 3 M NH4OAc (pH 5.2) and 370 μl ethanol at 4°C. The solution was kept at –80°C for 1 h and then centrifuged at 4°C for 30 min at 13 000 rpm. The supernatant was discarded and the pellet was washed once by mixing with 1 ml of 75% ethanol and centrifuging for 30 min at 13 000 rpm at 4°C. The DNA pellets were then dried in vacuo and dissolved in 10 μl DNA loading buffer [containing 90% formamide (v/v)].
In reactions that contained chemically inert Co-BLM, the appropriate amount of Co-BLM was pre-mixed with the activated BLMs before they were added to the final reaction mixture.
Quantitation of the DNA cleavage bands by ImageQuant 5.0
After the exposure of the sequencing gel to the phosphorimage screen, the screen was scanned on a Phosphoimager (Model Storm840 Amersham Biosciences). The resolution of the scanning pixel was set to be 200 μm. The gel image was saved either as a GIF file for immediate visualization or as a GEL file for the quantitative analysis. The manufacturer's software, ImageQuant 5.0, was used to quantitate the intensity of the DNA bands in the gel. The procedure of the quantitation has been described in detail (13).
Relaxation of supercoiled plasmid DNA by BLMs
The reaction mixture of 20 μl contained 1 μg pUC18 plasmid DNA (2686 bp, Stratagen, Supporting Information), 50 mM HEPES, pH 7.5 and 0.2–0.8 μM activated BLM. The BLM was activated by mixing 50 μM BLM (10 μl) with equal volume and concentration of iron(II). The activation mixture was incubated at 4°C for 1 min. An appropriate aliquot of the activated BLM was added into the reaction mixture to achieve the desired final concentration. The reaction mixture was incubated at 4°C for 10 min and the reaction was quenched by adding 5 μl of loading buffer containing 50% glycerol. In reactions that contained Co-BLM, the appropriate amount of Co-BLM was pre-mixed with the activated BLMs before they were added to the final reaction mixture.
The type I (supercoiled), II (nicked) and III (linear) forms of plasmid DNA in the reaction mixture were separated by 1% agarose gel electrophoresis in TBE buffer containing 0.5 μg/ml ethidium bromide at a constant voltage of 80 V for 90 min. The bands were visualized using a Bio-Rad ChemiDoc XRS UV-trans-illuminator and were quantitated by the manufacturer's software Bio-Rad Quality One. The number of ss cleavage events (n1) and ds cleavage events (n2) can be calculated from the Poisson distribution (11): fI = e–(n1 + n2) and fIII = n2e−n2. (fI and fIII are fractions of the supercoiled and linear plasmid, respectively).
RESULTS
Sequence-specific cleavage of GT-2 by CD-BLM
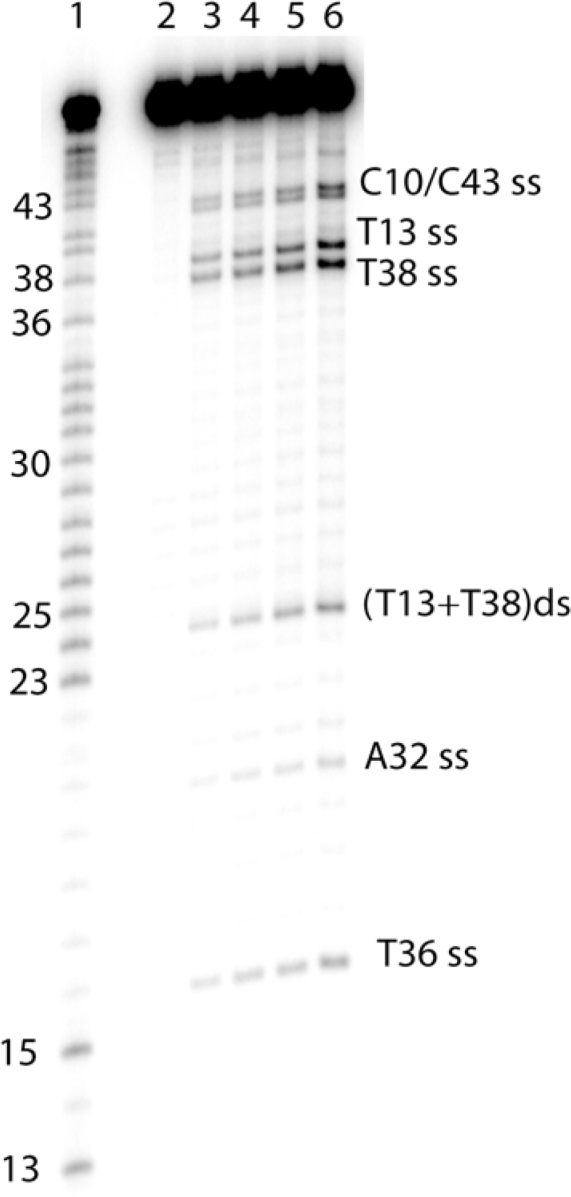
The internally [32P]-labeled hairpin DNA technology developed in our group has enabled us to quantitate the site-specific ss and ds cleavage simultaneously in a defined sequence context (13,14). The hairpin DNA sequence used in this study, GT-2, contains a ‘hot spot’ for ds-DNA cleavage by BLM (T13 and T38 in the 5′-GTAC-3′ sequence indicated in the box in Figure 3, where T denotes the cleavage site), as well as several additional good ss-cleavage site, including C10, C43 and T36 (Figure 3) (13). The ss- and ds-DNA cleavages of internally labeled GT-2 by BLM result in DNA fragments with characteristic lengths for each cleavage site (Table 1), which can be separated and quantitated using the DNA sequencing gel electrophoresis (13).
Table 1.
Distribution of the cleavage products of GT-2 by BLMs and CD-BLM
| Cleavage site | Predicted length | 5′-terminal | 3′-terminal | Observed length |
|---|---|---|---|---|
| C10ss | 41 | Phosphate | OH | 42–43 |
| C43ss | 42 | OH | Phosphoglycolate (PG) | 42–43 |
| T13 | 38 | Phosphate | OH | 39 |
| T36 | 15 | Phosphate | OH | 16 |
| T38 | 37 | OH | PG | 37–38 |
| A32 | 19 | Phosphate | OH | 20 |
| (T13+T38) ds | 24 | phosphate | PG | 25 |
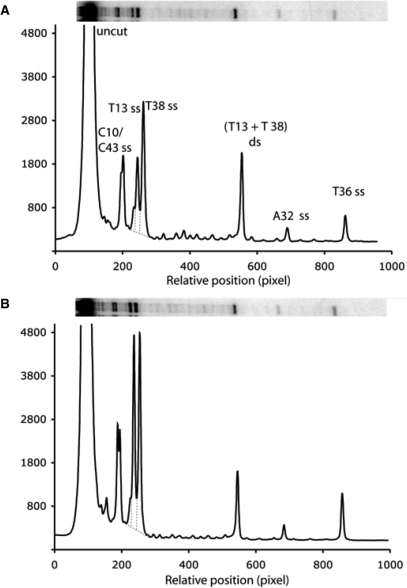
The results of the cleavage study of the internal-[32P] GT-2 using various concentrations of CD-BLM (0–50 μM) are shown in Figure 5. Quantitative analysis of the cleavage product intensity at each ss-cleavage site indicates that the amount of the ss-cleavage product increased linearly with the concentration of CD-BLM (Figure S1) and is consistent with ‘single-hit’ conditions. The intensities of cleavage products mediated by 50 μM CD-BLM (Lane 6 in Figure 5) are analyzed in Figure 6B and are compared to the cleavage patterns by BLM A5 (7.7 μM BLM A5, Figure 6A). Under these assay conditions, 50 μM CD-BLM produced approximately the same extent of overall cleavage (12%) as 7.5 μM BLM A5 (10%), indicating that CD-BLM is at least 5-fold less efficient in the cleavage of GT-2 than BLM A5. The reduced overall DNA cleavage ability could be attributed to the β-cyclodextrin group, which would be expected to reduce the affinity of CD-BLM for DNA. It might also be related to a slower rate to generate activated BLM and/or a faster degradation rate of the activated species, CD-BLM-Fe(III)-OOH.
Figure 5.
Cleavage of internal-[32P] GT-2 by CD-BLM analyzed by PAGE. Lane 1: Maxim-Gilbert G+A reaction. Lane 2–5: 0, 12.5, 25, 37.5, 50 μM CD-BLM.
Figure 6.
Quantitation of ss- and ds-cleavage products of internal-[32P] GT-2. (A), by 7.5 μM BLM A5; (B), by 50 μM CD-BLM.
Although CD-BLM is less efficient in overall DNA cleavage than BLM A5, the results reveal similar sequence specificity of ss-DNA cleavage (Figure 6). Thus, the bulky β-cyclodextrin group and its presumed hindrance to intercalation, do not seem to interfere with its ability to form H-bond interaction with G, 3′ to the pyrimidine cleavage site which is suggested to be the basis of specificity by solution NMR structural studies (16).
The relative intensities of the cleavage products at each ss cleavage site (T13, T13, C10, C43, A32 and T36 of GT-2) for CD-BLM are also quite similar to those for BLM A5 (Figure 6) and the previously studied BLM A2 (13). The predominant cleavage sites are T13 and T38, with C10/C43 >> T36 > A32. A notable difference between CD-BLM and BLM A5 is the relative intensity at T13 and T38. CD-BLM produced almost equal amounts of cleavage products at these two sites, while BLM A5 and A2 (13) cleaved the T38 site with twice the efficiency relative to the T13 site (Figure 6). The difference of the cleavage intensities between T13 and T38 for natural BLMs was used by Absalon et al. to suggest that T38 might be the primary ss-cleavage site for initiating ds-DNA cleavage (13). The change of the relative cleavage intensity at T13 and T38 for CD-BLM suggests that CD-BLM is capable of initiating ds-DNA cleavage from either strand (see the discussion below).
Chemistry of cleavage by CD-BLM
As shown in Figure 2, BLMs have been shown to mediate direct strand cleavage resulting in 3′-phosphoglycolate/5′-phosphate ends. Gel analysis reveals that cleavage products by CD-BLM are the same as those observed with BLM A5 (Figure 6) and that 3′-phospholycolate ends are generated at the same sites (Table 1). Thus, while the chemistry of CD-BLM mediated cleavage has not been studied in detail, 4′-chemistry is strongly implicated.
Site-specific ds-DNA cleavage mediated by CD-BLM
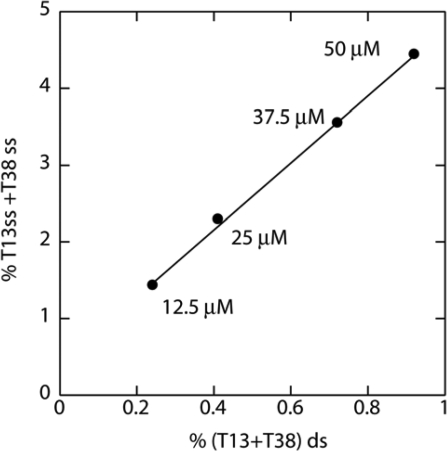
In addition to ss-DNA cleavage, CD-BLM also mediated ds-DNA cleavage at T13 and T38 (Figures 5 and 6). The percentage of ds-DNA cleavage increased linearly with the CD-BLM concentration (filled circles in Figure S2). The ss to ds cleavage ratio at T13 and T38 sites was determined in triplicate to be 6.7 ± 1.2, which is higher than the ratio for BLM A2 (3.4) or A5 (3.1 ± 0.3) in the same sequence context (13). The ss to ds cleavage ratios for CD-BLM at T13 and T38 remained constant over the range of 12.5–50 μM CD-BLM (Figure 7). This result indicates that the observed ds-DNA cleavage at T13 and T38 cannot arise from two coincidental ss cleavage events, which would lead to more ds-cleavage at higher CD-BLM concentrations.
Figure 7.
The concentration dependence of %ss-cleavage versus %ds-cleavage at T13 and T38 by CD-BLM.
The ss to ds cleavage ratio by CD-BLM (6.7±1.2) is both statistically and mechanistically significant. The separation of the T13 and T38 ss cleavage bands (Figure 5) allows the quantitative estimation of the amount of ds-cleavage due to two coincidental ss-cleavage events. The calculated random ds-cleavage percentages at different CD-BLM concentrations are plotted in Supporting Figure S2 (filled squares, Figure S2), which are much lower than the observed ds-cleavage. At 50 μM CD-BLM, the percentages of ss-cleavage at T13 (2.01%) and T38 (2.44%) give rise to the calculated random ds-cleavage of 0.054% (2.01 × 2.44%), 17 times lower than the observed ds cleavage (0.92%).
The total extent of cleavage under the above conditions is 3.3 to 14% (12.5–50 μM CD-BLM). To investigate whether the observed ss to ds cleavage ratio would change under conditions of <1% overall cleavage, additional studies were carried out in the presence of calf thymus DNA present in increasing amounts from 0.6 to 5 μg/μl. The cleavage reaction mixture was analyzed by the DNA sequencing gel and is shown in Figure S3. The overall cleavage at 20 μM CD-BLM is 0.6%. The ss to ds cleavage ratio determined in this experiment, 7.8 ± 2.4, (in a separate measurement, 7.3 ± 1.4) is consistent with our previous studies (6.7 ± 1.0). This result, together with the concentration-independent ss:ds cleavage ratio, suggests that the ds-DNA cleavage by CD-BLM is mediated either by a single CD-BLM molecule, or by the cooperative binding of a second CD-BLM.
Ds-cleavage of GT-2 by CD-BLM is mediated through cooperative binding
To distinguish between these two models, the cleavage of internal-[32P]-GT-2 by CD-BLM was further investigated in the presence of the chemically inert BLM-Co(III)-OOH (Co-BLM). In previous studies by Absalon et al. (14), this competition assay was carried out to provide additional support for the model that a single BLM molecule can mediate ds-DNA cleavage. The ss to ds cleavage ratio is determined by the relative rate of dissociation of BLM versus re-organization after the chemistry at the first cleavage site. Thus, the single molecule model predicts that the presence of the Co-BLM, a chemically inert inhibitor, would compete with the BLM for binding and consequently, affect ss and ds cleavage to the same extent. Thus, the ratio of ss:ds cleavage would remain unchanged. However, if the chemistry at the first site promotes cooperative binding of a second BLM molecule to the second site, then Co-BLM would be expected to hinder ds-cleavage more than ss-cleavage. Thus, the ss:ds cleavage ratio would increase.
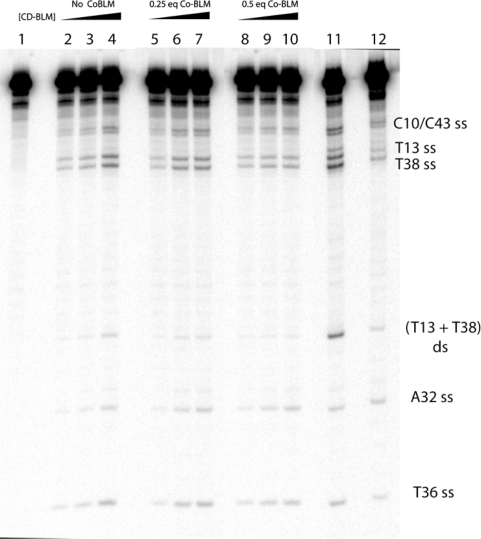
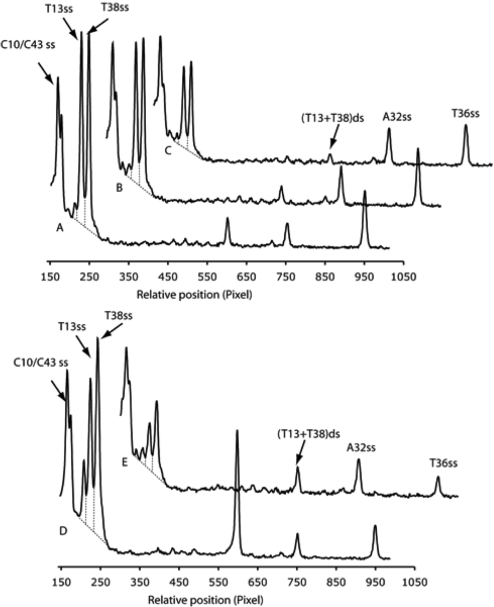
The cleavage of the internal-[32P] GT-2 by CD-BLM was analyzed by DNA sequencing gel (Figure 8) in the presence and absence of various amounts of Co-BLM. Co-BLM suppressed cleavage at both ss- and ds-cleavage sites. However, the ds-cleavage was affected much more than the ss-cleavage. This effect is clearly demonstrated by quantitatively analyzing Lane 4, 7 and 10 in Figure 8 (Line graph A, B and C in Figure 9). The ss to ds cleavage ratio increases from 7.3 ± 1.4 (no Co-BLM) to 12.5 ± 2.5 (0.25 equivalent Co-BLM) and 21 ± 14.2 (0.5 equivalent Co-BLM) (Table 2). Furthermore, The ss to ds cleavage ratio measured with 0.5 equivalent Co-BLM is close to the lower limit of detection (compare the intensity of the T13+T38 ds-cleavage product with background in Line graph C, Figure 9).
Figure 8.
Competitive inhibition of CD-BLM-mediated DNA cleavage by Co-BLM. Lane 1: Control. Lane 2–4: 5, 10, 20 μM CD-BLM. Lane 5–7: 5, 10, 20 μM CD-BLM with 0.25 equivalent Co-BLM. Lane 8–10: 5, 10, 20 μM CD-BLM with 0.5 equivalent Co-BLM. Lane 11: 5 μM BLM A5. Lane 12: 5 μM BLM A5 with five equivalents Co-BLM.
Figure 9.
Quantitation of CD-BLM mediated cleavage and its attenuation by BLM-Co(III)-OOH. (A), 20 μM CD-BLM; (B), 20 μM CD-BLM + 5 μM Co-BLM; (C), 20 μM CD-BLM + 10 μM Co-BLM; (D), 5 μM BLM A5; (E), 5 μM BLM A5 + 25 μM Co-BLM.
Table 2.
Quantitation of CD-BLM-mediated cleavage of GT-2. Column A-E corresponds to line-graphs A-E in Figure 9
| Assay Condition | A | B | C | D | E |
|---|---|---|---|---|---|
| 20 μM CD-BLM | 20 μM CD-BLM + 5 μM Co-BLM | 20 μM CD-BLM + 10 μM Co-BLM | 5 μM BLM A5 | 5 μM BLM A5 + 25 μM Co-BLM | |
| ss (T13 + T38) | 438a | 366 | 259 | 668 | 124 |
| ds (T13 + T38) | 72.3 | 46.1 | 27.3 | 213 | 33.7 |
| Average background | 13 | 17 | 15 | 12 | 13 |
| ss to ds ratio | 7.3 ± 1.4 | 12.5 ± 2.5 | 21 ± 14.2 | 3.1 ± 0.3 | 3.6 ± 0.9 |
aArbitrary unit.
Control experiments using BLM A5 were also performed with 0 or 5 equivalent of Co-BLM (Lane 11 and 12 in Figure 8) with quantitative analysis shown in Line graph D and E, Figure 9. The ss to ds cleavage ratio remains unchanged (3.6 ± 0.9) in the presence of five equivalent Co-BLM compared to BLM A5 alone (3.1 ± 0.3). These results indicate that CD-BLM mediates ds-DNA cleavage by cooperative binding of a second CD-BLM molecule after chemistry at the first site. BLM A5, on the other hand, mediates ds-cleavage by a single BLM molecule, consistent with previous studies on BLM A2 (14).
Ss:ds cleavage ratio determined by the supercoiled plasmid relaxation assay
The supercoiled plasmid relaxation assay has been widely used to determine the ss to ds cleavage ratios by BLM (11,26–28). The number of the ss and ds cleavage events can be calculated from the fraction of Type II (relaxed) and Type III (linear) plasmid forms generated under single-hit conditions using the Poisson distribution described in the experimental section (11).
CD-BLM is shown to mediate ds-DNA cleavage using the supercoiled plasmid relaxation assay (Figure S4). CD-BLM showed 50% of the cleavage efficiency compared to BLM A5 using this assay. The UV densitometry analysis of the gel is presented in Figure S5. Surprisingly, the ss to ds cleavage ratio determined for CD-BLM is 2.8 to 1, lower than that observed for BLM A5 (5.8 to 1) or A2 (7.3 to 1). For comparison, PLM, which is a poor ds-cleavage agent, shows a ss:ds ratio of 47 to 1. In contrast to results from the hairpin DNA cleavage studies, the ss to ds cleavage ratio for CD-BLM remained unchanged in the presence of Co-BLM (Figure S6, Lane 3 and 4), suggesting that the observed ds-DNA cleavage of supercoiled plasmid does not result from cooperative binding of a second BLM molecule. However, the mechanistic interpretation of these ratios is complicated by the lack of understanding of molecular details on the interaction between CD-BLM and supercoiled plasmids (see the discussion below).
DISCUSSION
In the present study, β-cyclodextrin was used as a bulky attachment to the terminal amine group of BLM A5 to preclude the intercalation of the bithiazole tail. β-Cyclodextrin was chosen based on its size [6 Å (height) by 12 Å (diameter), PDB ID 3CGT] (22), its water-soluble, non-ionic nature and a facile route to its synthesis. This molecule could be characterized by NMR spectroscopy in contrast to the controlled-pore glass beads or dendrimers used for a similar purpose in previous studies (19,21). Although we argue that β-cyclodextrin is sufficiently large to prevent intercalation, we have been unable to demonstrate the mode(s) of CD-BLM binding to DNA. However, based on the inhibition of DNA cleavage by Co-BLM (Figure 8), we can estimate that activated CD-BLM binds to GT-2 at least 10 times weaker than BLM A5. This observation is inconsistent with a slow dissociation rate predicted for threading intercalation of a bulky intercalator (29).
The classic method to demonstrate intercalation is to study the unwinding of the supercoiled DNA using agarose gel electrophoresis (30). Technically, this method would require that CD-BLM be incorporated into the gel. This incorporation would require larger amounts than are available. In addition, this method is not capable of detecting weak intercalators or intercalators that bind at a limited number of intercalation sites. For example, earlier results from studies with PLM using this method were interpreted to indicate a non-intercalative binding mode (31–33). However, our NMR spectroscopic analysis of PLM with oligonucleotides containing a single binding site (5′-GTAC-3′) indicates that PLM can intercalate, although it is in fast exchange between the free and DNA-bound states (34).
The quantitative analysis of CD-BLM-mediated DNA cleavage gives a ss:ds cleavage ratio of 6.7 ± 1.2:1, which is significantly higher than that of BLM A5 and A2 under the same assay conditions. A key aspect of the quantitation is the background level of cleavage due to a combination of non-specific cleavage possibly by hydroxyl radicals generated by CD-BLMs (35,36), radiation damage of GT-2 from [32P] decay, and/or spontaneous depurination. The non-specific cleavage by CD-BLM is likely the major source of the background because the amount of the non-specific cleavage increases with the CD-BLM concentration (Figures 5 and S3). When the overall cleavage is less than 1% as in Figure S3, the random ds cleavage at T13 and T38 is estimated to be approximately 0.002%, far less than the background, which is usually 0.01%. Thus, background cleavage sets the limit of detection for the ss to ds cleavage ratio to be ∼20:1. The previously observed limit of detection by Absalon et al. (14) was ∼7:1 with 7% overall cleavage, which was largely determined by ds-cleavage generated by two random ss-cleavage events.
The cooperative binding model of CD-BLM-mediated ds-cleavage requires the potentiation of binding of second CD-BLM molecule after chemistry at the first site. This model predicts that CD-BLM would have a higher affinity for ss-lesioned DNA (not necessarily cleaved), than for the intact DNA. The identity of the ss-lesioned DNA that is responsible for the potentiation of binding is not clear at this stage. The 3′-phosphoglycolate/5′-phosphate lesion (3′-PG/5′-P) (Figure 2) was shown to be present at the first cleavage site in all BLM-mediated ds-cleavage and might play a role in recruiting the second CD-BLM (37). Our studies have shown that the chemistry of 3′-PG/5′-P production is complex (38,39). The NMR analysis of Burger et al. is often cited as evidence against 3′-PG/5′-P being a prerequisite for BLM binding to the second strand, due to its slow formation. Using the 5′-(CAAGCTTG)2-3′ and looking at 5′-P formation with 31P NMR, they showed that on average, this 3′-PG/5′-P lesion was generated on a minute time scale (40). However, it is likely that at hot spots for ds-cleavage, the kinetics of 3′-PG/5′-P generation could be dramatically altered relative to the more prevalent ss cleavage sites. Thus, the structural basis for cooperative binding of a second BLM remains unknown.
The results from internal-[32P] hairpin cleavage studies demonstrate that partial intercalation of the bithiazole tail is required for ds-DNA cleavage mediated by a single BLM. This is consistent with our proposed model based on the sequence selectivity (10,12), chemistry of the ds-cleavage at a hot spot (5′-GTAC-3′) (14) and structural studies on a complex of BLM-Co(III)-OOH bound to this hot spot (15). However, the efficient ds-cleavage by CD-BLM on supercoiled plasmid suggests that our model could be over-simplified. The unusually low ss:ds cleavage ratio compared with BLM A2 and A5 suggests that there might be other unknown hot spots in supercoiled plasmid that allow CD-BLM to mediate efficient ds-cleavage without partial intercalation or cooperative binding. Negative supercoiling in plasmid DNA is known to induce a variety of secondary structures, including A-form, cruciforms, and left-handed DNA (41). BLM has been shown to cleave at the junction of tRNA secondary structures (42,43). Therefore, the results from the two independent cleavage studies support multiple binding modes of BLM that can result in ds-DNA cleavage depending on the structures and conformation of the DNA substrates.
It is crucial to determine which binding modes by natural BLMs are essential for their cytotoxicity and therapeutic efficacy. Unfortunately, neither hairpin DNA nor supercoiled plasmid is a good model system for studying DNA damage in vivo. Povirk et al. has shown that in vitro, partial intercalation is required for BLM-mediated ds-DNA cleavage in reconstituted nucleosomes (44). The in vivo concentration of BLMs is another important piece of puzzle to answer this question. If the concentration of BLMs inside the nucleus is low, ds-DNA cleavage by cooperative binding of a second BLM would be highly unlikely, and it would argue in favor of the single-BLM cleavage model requiring partial-intercalation. At present, it is not clear how efficient BLMs are taken up into the cell or into the nucleus. Studies using mammalian cell lines (45,46) or yeast (47,48) suggest that BLMs enter the cell via a defined pathway involving cell surface receptors and endocytosis. However, previous methods using radiolabeled BLMs failed to provide a clear answer to the in vivo concentration of BLMs due to the chemical reactivity of the labeled methyl group of the dimethylsulfonium tail of BLM A2 [(49–51); Figure 1]. In vivo studies using stable radio-labeled BLMs are under way to elucidate the uptake and localization of BLMs inside the cell. The information from in-vivo studies, together with our mechanistic understanding of BLM-mediated DNA cleavage, could potentially lead to better BLM therapeutics with lower toxicity.
SUPPLEMENTARY DATA
Supplementary Data are available at NAR Online.
ACKNOWLEDGEMENTS
This work is supported by NIH Grant GM 34454 to J.S. Funding to pay the Open Access publication charges for this article was provided by National Institutes of Health.
Conflict of interest statement. None declared.
Footnotes
Present address: Jingyang Chen, Department of Molecular Biology, Massachusetts General Hospital, 185 Cambridge St. Boston, MA 02114, USA Manas K. Ghorai, Department of Chemistry, Indian Institute of Technology, Kanpur, Uttar Pradesh 208 016, India
REFERENCES
- 1.Umezawa H, Maeda K, Takeuchi T, Okami Y. New antibiotics, bleomycin A and B. J. Antibiot. 1966;19:200–209. [PubMed] [Google Scholar]
- 2.Sikic BI, Rozencweig M, Carter SK. Orlando, Florida: Academic Press; 1985. Bleomycin Chemotherapy. [Google Scholar]
- 3.Einhorn LH. Curing metastatic testicular cancer. Proc. Natl Acad. Sci. USA. 2002;99:4592–4595. doi: 10.1073/pnas.072067999. [DOI] [PMC free article] [PubMed] [Google Scholar]
- 4.Stubbe J, Kozarich JW. Mechanisms of bleomycin-induced DNA degradation. Chem. Rev. 1987;87:1107–1136. [Google Scholar]
- 5.Burger RM. Cleavage of nucleic acids by bleomycin. Chem. Rev. 1998;98:1153–1169. doi: 10.1021/cr960438a. [DOI] [PubMed] [Google Scholar]
- 6.Claussen CA, Long EC. Nucleic acid recognition by metal complexes of bleomycin. Chem. Rev. 1999;99:2797–2816. doi: 10.1021/cr980449z. [DOI] [PubMed] [Google Scholar]
- 7.Chen J, Stubbe J. Bleomycins: new methods will allow reinvestigation of old issues. Curr. Opin. Chem. Biol. 2004;8:175–181. doi: 10.1016/j.cbpa.2004.02.008. [DOI] [PubMed] [Google Scholar]
- 8.Povirk LF. DNA damage and mutagenesis by radiomimetic DNA-cleaving agents: bleomycin, neocarzinostatin and other enediynes. Mutat. Res. 1996;355:71–89. doi: 10.1016/0027-5107(96)00023-1. [DOI] [PubMed] [Google Scholar]
- 9.Chen J, Stubbe J. Bleomycins: towards better therapeutics. Nat. Rev. Cancer. 2005;5:102–112. doi: 10.1038/nrc1547. [DOI] [PubMed] [Google Scholar]
- 10.Povirk LF, Han YH, Steighner RJ. Structure of bleomycin-induced DNA double-strand breaks: predominance of blunt ends and single-base 5′ extensions. Biochemistry. 1989;28:5808–5814. doi: 10.1021/bi00440a016. [DOI] [PubMed] [Google Scholar]
- 11.Povirk LF, Wübker W, Köhnlein W, Hutchinson F. DNA double-strand breaks and alkali-labile bonds produced by bleomycin. Nucleic Acids Res. 1977;4:3573–3580. doi: 10.1093/nar/4.10.3573. [DOI] [PMC free article] [PubMed] [Google Scholar]
- 12.Steighner RJ, Povirk LF. Bleomycin-induced DNA lesions at mutational hot spots: implications for the mechanism of double-strand cleavage. Proc. Natl Acad. Sci. USA. 1990;87:8350–8354. doi: 10.1073/pnas.87.21.8350. [DOI] [PMC free article] [PubMed] [Google Scholar]
- 13.Absalon MJ, Kozarich JW, Stubbe J. Sequence-specific double-strand cleavage of DNA by Fe bleomycin. 1. The detection of sequence-specific double-strand breaks using hairpin oligonucleotides. Biochemistry. 1995;34:2065–2075. doi: 10.1021/bi00006a029. [DOI] [PubMed] [Google Scholar]
- 14.Absalon MJ, Wu W, Kozarich JW, Stubbe J. Sequence-specific double-strand cleavage of DNA by Fe bleomycin.2. Mechanism and dynamics. Biochemistry. 1995;34:2076–2086. doi: 10.1021/bi00006a030. [DOI] [PubMed] [Google Scholar]
- 15.Vanderwall DE, Lui SM, Wu W, Turner CJ, Kozarich JW, Stubbe J. A model of the structure of HOO-Co-bleomycin bound to d(CCAGTACTGG)2: recognition at the d(GpT) site and implications for double-stranded DNA cleavage. Chem. Biol. 1997;4:373–387. doi: 10.1016/s1074-5521(97)90128-9. [DOI] [PubMed] [Google Scholar]
- 16.Wu W, Vanderwall DE, Stubbe J, Kozarich JW, Turner CJ. Interaction of Cobleomycin A2 (green) with d(CCAGGCCTGG)2: Evidence for intercalation using 2D NMR. J. Am. Chem. Soc. 1994;116:10843–10844. [Google Scholar]
- 17.Quada JC, Levy MJ, Hecht SM. Highly efficient DNA strand scission by photoactivated chlorobithiazoles. J. Am. Chem. Soc. 1993;115:12171–12172. [Google Scholar]
- 18.Zuber G, Quada JC, Hecht SM. Sequence selective cleavage of a DNA octanucleotide by chlorinated bithiazoles and bleomycins. J. Am. Chem. Soc. 1998;120:9368–9369. [Google Scholar]
- 19.Abraham AT, Zhou X, Hecht SM. DNA cleavage by Fe(II)-bleomycin conjugated to a solid support. J. Am. Chem. Soc. 1999;121:1892–1893. [Google Scholar]
- 20.Abraham AT, Zhou X, Hecht SM. Metallobleomycin-mediated cleavage of DNA not involving a threading-intercalation mechanism. J. Am. Chem. Soc. 2001;123:5167–5175. doi: 10.1021/ja002460y. [DOI] [PubMed] [Google Scholar]
- 21.Choudhury AK, Tao ZF, Hecht SM. Synthesis and DNA cleavage activity of a novel bleomycin A(5) glycoconjugate. Org. Lett. 2001;3:1291–1294. doi: 10.1021/ol010015h. [DOI] [PubMed] [Google Scholar]
- 22.Schmidt AK, Cottaz S, Driguez H, Schulz GE. Structure of cyclodextrin glycosyltransferase complexed with a derivative of its main product beta-cyclodextrin. Biochemistry. 1998;37:5909–5915. doi: 10.1021/bi9729918. [DOI] [PubMed] [Google Scholar]
- 23.Leroy JL, Kochoyan M, Huynh-Dinh T, Guéron M. Characterization of base-pair opening in deoxynucleotide duplexes using catalyzed exchange of the imino proton. J. Mol. Biol. 1988;200:223–238. doi: 10.1016/0022-2836(88)90236-7. [DOI] [PubMed] [Google Scholar]
- 24.Sambrook J, Fritsch EF, Maniatis T. Molecular Cloning: A Laboratory Manual. 2nd edn. Cold Spring Harbor, New York: Cold Spring Harbor Laboratory Press; 1989. [Google Scholar]
- 25.Hamasaki K, Ikeda H, Nakamura A, Ueno A, Toda F, Suzuki I, Osa T. Fluorescent sensors of molecular recognition. Modified cyclodextrins capable of exhibiting guest-responsive twisted intramolecular charge transfer fluorescence. J. Am. Chem. Soc. 1993;115:5035–5040. [Google Scholar]
- 26.Huang CH, Mirabelli CK, Jan Y, Crooke ST. Single-strand and double-strand deoxyribonucleic acid breaks produced by several bleomycin analogues. Biochemistry. 1981;20:233–238. doi: 10.1021/bi00505a001. [DOI] [PubMed] [Google Scholar]
- 27.Mirabelli CK, Huang C.-H, Fenwick RG, Crooke ST. Quantitative measurement of single- and double-strand breakage of DNA in Escherichia coli by the antitumor antibiotics bleomycin and talisomycin. Antimicrob. Agents Chemother. 1985;27:460–467. doi: 10.1128/aac.27.4.460. [DOI] [PMC free article] [PubMed] [Google Scholar]
- 28.Povirk LF, Houlgrave CW. Effect of apurinic/apyrimidic endonucleases and polyamines on DNA treated with bleomycin and neocarzinostatin: specific formation and cleavage of closely opposed lesions in complementary strands. Biochemistry. 1988;27:3850–3857. doi: 10.1021/bi00410a049. [DOI] [PubMed] [Google Scholar]
- 29.Onfelt B, Lincoln P, Norden B. A molecular staple for DNA: threading bis-intercalating [Ru(phen)(2)dppz](2+) dimer. J. Am. Chem. Soc. 1999;121:10846–10847. [Google Scholar]
- 30.Povirk LF, Hogan M, Dattagupta N. Binding of bleomycin to DNA: Intercalation of the bithiazole rings. Biochemistry. 1979;18:96–101. doi: 10.1021/bi00568a015. [DOI] [PubMed] [Google Scholar]
- 31.Fox KR, Grigg GW, Waring MJ. Sequence-selective binding of phleomycin to DNA. Biochem. J. 1987;243:847–851. doi: 10.1042/bj2430847. [DOI] [PMC free article] [PubMed] [Google Scholar]
- 32.Kross J, Henner D, Hecht SM, Haseltine WA. Specificity of deoxyribonulceic acid cleavage by bleomycin, phleomycin, and tallysomycin. Biochemistry. 1982;21:4310–4318. doi: 10.1021/bi00261a021. [DOI] [PubMed] [Google Scholar]
- 33.Hamamichi N, Hecht SM. Determination of the absolute-configuration of the thiazolinylthiazole moiety of phleomycin. J. Am. Chem. Soc. 1993;115:12605–12606. [Google Scholar]
- 34.Wu W, Vanderwall DE, Turner CJ, Hoehn S, Chen J, Kozarich JW, Stubbe J. Solution structure of the hydroperoxide of Co(III) phleomycin complexed with d(CCAGGCCTGG)2: evidence for binding by partial intercalation. Nucleic Acids Res. 2002;30:4881–4891. doi: 10.1093/nar/gkf608. [DOI] [PMC free article] [PubMed] [Google Scholar]
- 35.Boger DL, Ramsey TM, Cai H, Hoehn ST, Kozarich JW, Stubbe J. Assessment of the role of the bleomycin A2 pyrimidoblamic acid C4 amino group. J. Am. Chem. Soc. 1998;120:53–65. [Google Scholar]
- 36.Boger DL, Ramsey TM, Cai H, Hoehn ST, Stubbe JA. A systematic evaluation of the bleomycin A2 L-threonine side chain: Its role in preorganization of a compact conformation implicated in sequence-selective DNA cleavage. J. Am. Chem. Soc. 1998;120:9139–9148. [Google Scholar]
- 37.Hoehn ST, Junker HD, Bunt RC, Turner CJ, Stubbe J. Solution structure of Co(III)-bleomycin-OOH bound to a phosphoglycolate lesion containing oligonucleotide: implications for bleomycin-induced double-strand DNA cleavage. Biochemistry. 2001;40:5894–5905. doi: 10.1021/bi002635g. [DOI] [PubMed] [Google Scholar]
- 38.McGall GH, Rabow LE, Ashley GW, Wu SH, Kozarich JW, Stubbe J. New insight into the mechanism of base propenal formation during bleomycin-mediated DNA degradation. J. Am. Chem. Soc. 1992;114:4958–4967. [Google Scholar]
- 39.McGall GH, Rabow LE, Stubbe J, Kozarich JW. Incorporation of 18O into glycolic acid obtained from the bleomycin-mediated degradation of DNA. Evidence for 4'-radical trapping by 18O2. J. Am. Chem. Soc. 1987;109:2836–2837. [Google Scholar]
- 40.Burger RM, Drlica K, Birdsall B. The DNA cleavage pathway of iron bleomycin. J. Biol. Chem. 1994;269:25978–25985. [PubMed] [Google Scholar]
- 41.Palecek E. Local supercoil-stabilized DNA structures. Crit. Rev. Biochem. Mol. Biol. 1991;26:151–226. doi: 10.3109/10409239109081126. [DOI] [PubMed] [Google Scholar]
- 42.Carter BJ, de Vroom E, Long EC, van der Marel GA, van Boom JH, Hecht SM. Site-specific cleavage of RNA by Fe(II)•bleomycin. Proc. Natl Acad. Sci. USA. 1990;87:9373–9377. doi: 10.1073/pnas.87.23.9373. [DOI] [PMC free article] [PubMed] [Google Scholar]
- 43.Holmes CE, Abraham AT, Hecht SM, Florentz C, Giege R. Fe bleomycin as a probe of RNA conformation. Nucleic Acids Res. 1996;24:3399–3406. doi: 10.1093/nar/24.17.3399. [DOI] [PMC free article] [PubMed] [Google Scholar]
- 44.Smith BL, Bauer GB, Povirk LF. DNA damage induced by bleomycin, neocarzinostatin, and melphalan in a precisely positioned nucleosome. J. Biol. Chem. 1994;269:30587–30594. [PubMed] [Google Scholar]
- 45.Pron G, Belehradek J., Jr, Mir LM. Identification of a plasma membrane protein that specifically binds bleomycin. Biochem. Biophys. Res. Commun. 1993;194:333–337. doi: 10.1006/bbrc.1993.1824. [DOI] [PubMed] [Google Scholar]
- 46.Pron G, Mahrour N, Orlowski S, Tounekti O, Poddevin B, Belehradek J., Jr, Mir LM. Internalisation of the bleomycin molecules responsible for bleomycin toxicity: a receptor-mediated endocytosis mechanism. Biochem. Pharmacol. 1999;57:45–56. doi: 10.1016/s0006-2952(98)00282-2. [DOI] [PubMed] [Google Scholar]
- 47.Aouida M, Page N, Leduc A, Peter M, Ramotar D. A genome-wide screen in Saccharomyces cerevisiae reveals altered transport as a mechanism of resistance to the anticancer drug bleomycin. Cancer Res. 2004;64:1102–1109. doi: 10.1158/0008-5472.can-03-2729. [DOI] [PubMed] [Google Scholar]
- 48.Aouida M, Tounekti O, Leduc A, Belhadj O, Mir L, Ramotar D. Isolation and characterization of Saccharomyces cerevisiae mutants with enhanced resistance to the anticancer drug bleomycin. Curr. Genet. 2004;45:265–272. doi: 10.1007/s00294-004-0492-x. [DOI] [PubMed] [Google Scholar]
- 49.Roy SN, Horwitz SB. Characterization of the association of radiolabeled bleomycin A2 with HeLa cells. Cancer Res. 1984;44:1541–1546. [PubMed] [Google Scholar]
- 50.Lyman S, Ujjani B, Renner K, Antholine W, Petering DH, Whetstone JW, Knight JM. Properties of the initial reaction of bleomycin and several of its metal complexes with Ehrlich cells. Cancer Res. 1986;46:4472–4478. [PubMed] [Google Scholar]
- 51.Kenani A, Bailly C, Houssin R, Henichart JP. Comparative subcellular distribution of the copper complexes of bleomycin-A2 and deglycobleomycin-A2. Anticancer Drugs. 1994;5:199–201. doi: 10.1097/00001813-199404000-00010. [DOI] [PubMed] [Google Scholar]
Associated Data
This section collects any data citations, data availability statements, or supplementary materials included in this article.


