


Abstract
Nucleosome positioning plays an essential role in cellular processes by modulating accessibility of DNA to proteins. Here, using only sequence-dependent DNA flexibility and intrinsic curvature, we predict the nucleosome occupancy along the genomes of Saccharomyces cerevisiae and Drosophila melanogaster and demonstrate the predictive power and universality of our model through its correlation with experimentally determined nucleosome occupancy data. In yeast promoter regions, the computed average nucleosome occupancy closely superimposes with experimental data, exhibiting a <200 bp region unfavourable for nucleosome formation bordered by regions that facilitate nucleosome formation. In the fly, our model faithfully predicts promoter strength as encoded in distinct chromatin architectures characteristic of strongly and weakly expressed genes. We also predict that nucleosomes are repositioned by active mechanisms at the majority of fly promoters. Our model uses only basic physical properties to describe the wrapping of DNA around the histone core, yet it captures a substantial part of chromatin's structural complexity, thus leading to a much better prediction of nucleosome occupancy than methods based merely on periodic curved DNA motifs. Our results indicate that the physical properties of the DNA chain, and not just the regulatory factors and chromatin-modifying enzymes, play key roles in eukaryotic transcription.
INTRODUCTION
Eukaryotic chromosomes are packaged in condensed chromatin structures whose primary unit, the nucleosome, is composed of about 147 DNA base pairs wrapped around a histone octamer (1,2). Nucleosomes, as well as the enzymes that remodel and modify them, are key regulators of genome activity (3). Nucleosome positioning can affect the accessibility of underlying DNA to the nuclear environment and as such plays an essential role in the regulation of cellular processes (4,5). Nucleosome formation and/or positioning depends on intrinsic properties of the DNA sequence such as flexibility or natural bending of adjacent base pairs (6–10). In particular, repetitive occurrences of curved DNA motifs positioned at intervals of one turn of the double helix can contribute to DNA curvature and facilitate its wrapping around the histone surface. In yeast, the contribution of the DNA sequence to nucleosomal organization has been observed at a few promoters (11,12). Nucleosomal organization is generally analysed by using micrococcal nuclease (MNase) digestion of chromatin. In chromatin, MNase cleaves DNA preferentially within the linker region and at nuclease-hypersensitive sites found at regulatory regions such as promoters. To perform large-scale studies of nucleosomal organization, the distribution of MNase cleavage sites is determined throughout genomic regions or in the whole genome by means of either oligonucleotide tiling arrays or massive sequencing (12–15). Unfortunately, systematic biases such as MNase cleavage specificity, composition-dependent labelling or hybridization biases inherent to the microarray procedure were generally not assessed. Such studies have nevertheless provided data sets that make it possible to analyse the parameters determining chromatin organization. In particular, the DNA sequence was proposed to play a role in yeast nucleosomal organization with particular emphasis on periodic occurrences of curved DNA motifs that were strongly preferred by nucleosomes (16,17). Correlation with the GC content of DNA was also observed (15,18). To what extent can nucleosome occupancy be deduced from the analysis of genome sequences? In the study presented here, we used only physical modelling of the wrapping of DNA around nucleosomes to predict ab initio chromatin organization and its role in gene regulation without using any training or regression-based procedure. We also assessed some of the biases introduced by the experimental procedures. This allowed us to demonstrate the predictive power of physical modelling in organisms as diverse as yeast, fly and nematode.
MATERIALS AND METHODS
Physical model
We implemented ab initio prediction of nucleosome occupancy along DNA sequences by computing the free-energy landscape associated with the bending of DNA around histone octamers to form nucleosomes. To evaluate this elastic free-energy, we assumed that a DNA chain of length L is constrained at position i around the histone octamer to form an ideal superhelix of radius R = 4.19 nm and pitch P = 2.52 nm (19). This geometry of the DNA chain can be defined by the following roll, tilt and twist angle distributions:
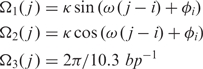 |
for j = i, …,i + L − 1 and with: κ = (2π)2R / (P2 + (2πR)2),ω = Ω3( j ) − 2πP / (P2 + (2πR)2) Assuming that the DNA chain is an inextensible and unshearable elastic rod, the elastic energy required to form such a superhelix depends solely on the roll, tilt and twist deformations given by:
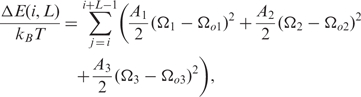 |
where A1, A2 and A3 are the stiffnesses associated with the tilt, roll and twist fluctuations around their equilibrium values Ωo1, Ωo2 and Ωo3, respectively. These elastic parameters depend on the sequence at positions j = i,...,i + L − 1 along the nucleosomal DNA. Equilibrium values Ωo and stiffnesses are determined as in (10). We neglect anisotropic bending deformations and we retain only the isotropic deformations controlled by the ‘isotropic’ stiffness A = (A1+A2)/2. We assume that A( j ) = A*τm( j ), where A* = 50 nm is the stiffness of the ‘standard’ (random) sequence and τm, a sequence dependent modulating factor. Similarly, for the twist stiffness we use: 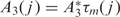 with A3 = 75 nm (20). As described in (10), τm(j) is defined as the ratio of the local dinucleotide melting temperature over the average dinucleotide melting temperature of standard DNA: τm( j ) = Tm( j )/T *m. This is very closely correlated to the stacking energy and bending stiffness of DNA (10). We also take into account the entropic cost associated with the transition of the DNA chain from the unconstrained state (free DNA) to the superhelical configuration given by:
where
The free-energy landscape is finally obtained by using the standard thermodynamical relation:
The energy profile can actually be decomposed into two contributions:
where:
 |
1 |
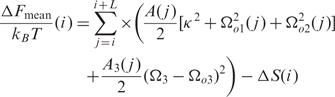
and:
 |
2 |
ΔF_mean(i) is the sum of the energies required (a) to form a straight fragment from the original intrinsically curved fragment and (b) to form the appropriately curved nucleosomal DNA. It depends mainly on the modulus of the intrinsic curvatures |Ωo1,2| of the DNA fragment. ΔF_mean(i) takes into account the contributions of DNA motifs that either increase or decrease the intrinsic curvature and as such predict the regions with high nucleosome occupancy as well as nucleosome instability regions.
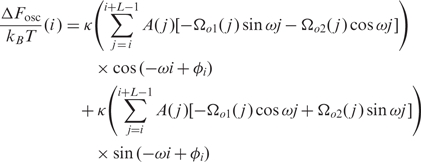
ΔF_osc(i,ϕi) is the component that is dependent on the phase. It is a rapidly varying term in the case of a uniformly fixed phase, i.e. it oscillates with a 2π/ω≈10.4 bp period. The amplitude of these oscillations increases with the ∼ 10 bp periodic component of the distribution of intrinsically curved motifs in the j = i,…,i+L DNA fragment.
For the wrapping length we chose L = 73 bp, which gave the best correlation with the experimental data (Supplementary Figure 1). Interestingly, this is similar to the length of DNA centered around the dyad axis, which is tightly bound to the tetramer histone surface (1,21).
In order to take into account the resolution of experimental data, we performed a linear coarse graining of the free-energy. This eliminates the ∼ 10 bp oscillations due to the ΔF_osc component and is equivalent to taking into account the contribution of ΔF_mean only. In the manuscript, we termed ΔF the result of the linear coarse graining performed at a scale of 50 bp for Saccharomyces cerevisiae and of 100 bp for Drosophila melanogaster. In the figures, for the sake of clarity, −ΔF values have been translated so that the mean value calculated for the corresponding sequences was set to zero.
Alternatively, as shown in Supplementary Figure 5, we also computed the nucleosome energy landscape E(i) using the method recently developed by Tolstorukov et al. (22). We could thus compute the elastic energy cost associated with the formation of a nucleosome at all genomic positions, taking into account not only the cost of the roll, tilt and twist deformations (which define the relative orientation between successive base pairs), but also such rigid-base pair deformation parameters as the slide, shift and rise deformations (which define the relative displacement between successive base pairs). Furthermore, we took into account all the coupling between all deformation parameters such as roll–slide or twist–stretch. The values of the spontaneous deformations as well as the stiffness and coupling constants were as described by Olson et al. (23). The nucleosome geometry corresponding to the values of all deformations over 145 bp steps were computed from the crystal structure of the nucleosome (19) by using the 3DNA software package (24).
In silico method to define nucleosome positions
To determine nucleosome-linker boundaries from the experimental data, we developed a hidden Markov model (HMM) that was similar to the one described by Yuan et al. (12) and we used the Matlab toolbox available at http://www.cs.ubc.ca/~murphyk/Software/HMM/hmm.html. We smoothed the energy profile with a 500 bp window and discretized it at a 10 bp scale. We designed the model with 14 highly positioned nucleosome states, 18 weakly positioned states and a linker state. We estimated the model parameters with the forward–backward algorithm on the whole chromosome III and inferred the hidden states with the Viterbi algorithm. We then deduced our predicted nucleosome positions from the highly positioned nucleosome states. To simulate the random expectations, we randomly drew 100 times the same number of positions uniformly along the chromosome III.
Statistical analysis
Calculations of K-means, clustering imaging and the Pearson method used to calculate the point-to-point correlation r were all performed in the R software environment http://www.r-project.org with the standard packages.
Data source
Sequence data
The genome of S. cerevisiae (Build 25-JUL-2005) was downloaded from NCBI (http://www.ncbi.nlm.nih.gov). Other annotated complete yeast genomes were downloaded from Genolevure (http://cbi.labri.fr/Genolevures). The genome of D. melanogaster (Build 4.2.1) was downloaded from Flybase http://flybase.bio.indiana.edu.
Experimental data
Experimental nucleosome occupancy data for S. cerevisiae (log2ratio) were retrieved from (12). We computed the occupancy profile of H2AZ-containing nucleosome in S. cerevisiae from the supplementary data of the massive sequencing analysis performed by Albert et al. (13). We assumed that the nucleosomes were 146 bp long and we retained those found with BlastN at percent identities >0.95. We defined the occupancy profile at each genomic site by the log of the number of H2AZ nucleosomes overlapping this site. We used the set of data made available in a study by Mito et al. (25,26), which they performed on one-third of the D. melanogaster genome by using tiling arrays at 100 bp resolution; these experiments analyse MNase-treated chromatin compared to either genomic DNA or genomic DNA digested in vitro with MNase to estimate nucleosome occupancy.
RESULTS
Physical model used to predict nucleosome occupancy
To predict nucleosome occupancy in a manner applicable to a range of eukaryotic genomes, we made the assumption that nucleosome positioning depends solely on the physical properties of DNA. Accordingly, to evaluate the probability that a nucleosome occupies a given position, we computed the energy necessary for the corresponding DNA fragment to be incorporated into a nucleosome. Using the intrinsic parameters of the DNA double helix (considered here as an elastic rod) we determined the free-energy cost of bending a DNA fragment of given sequence from its natural curvature to the final superhelical structure around the histone core. These parameters include the natural bending of each dinucleotide step given by the equilibrium values of the roll, tilt and twist angles and the elastic parameters of the deformations of dinucleotides around these equilibrium values (10). By computing free-energy values in windows centered at each nucleotide position along a genome sequence, we obtained an energy landscape for nucleosome occupancy. This landscape presents a fast (∼ 10 bp) oscillating component superimposed with a slowly varying component (Equations 1 and 2 in Materials and methods section). Finally, smoothing the energy landscape by a window corresponding to the resolution of the experimental data led to the energy profile, −ΔF, which was compared to in vivo nucleosome occupancy data as determined by measuring the accessibility to MNase of genomic DNA in chromatin (12,26).
The physical model predicts nucleosome occupancy in S. cerevisiae
In yeast, we observe a significant correlation between predicted values and experimental data (Figure 1 and Supplementary Figure 2). In the experimental occupancy profiles, oscillations on the scale of ∼ 170 bp have been associated with positioned nucleosomes (12). These oscillations coincided with oscillations of the calculated −ΔF profile in coding regions as well as in intergenic regions. We measured the quality of the discrimination between nucleosome forming and nucleosome inhibiting sequences achieved with our free-energy calculation by measuring the area under a receiver operating characteristic (ROC) curve (Supplementary Figure 3). The ROC score was equal to 0.72 for the complete test set and was equal to 0.85, 0.90 and 0.95 for the 8, 4 and 2% extreme fragments, respectively. This showed that the DNA fragments presenting the largest and lowest nucleosome occupancy values were efficiently discriminated, i.e. corresponded to fragments presenting large and low values of the −ΔF free-energy. These results are similar to those obtained in a recent study performed with the same experimental nucleosome occupancy data with a support vector machine classifier (18). Reciprocally, the DNA fragments of the data set presenting extreme values of the −ΔF free-energy corresponded to fragments with the highest and lowest nucleosome occupancy values showing that the most accurate predictions were obtained with the DNA fragments that most favour or inhibit nucleosome positioning (ROC = 0.88 for the 8% extreme fragments). A similar analysis was performed with a larger data set, a recently published genomewide S. cerevisiae nucleosome occupancy data (15). Here also, the ROC score demonstrates the predictive power of our model: DNA fragments with extreme nucleosome occupancy values were efficiently classified by their −ΔF free-energy values (Supplementary Figure 3); reciprocally, fragments with extreme −ΔF values corresponded to fragments with the highest and lowest nucleosome occupancy values (ROC = 0.87 for the 8% extreme fragments).
Figure 1.

Comparison of energy profile −ΔF (blue line, ordinate units are in kT) with experimentally determined nucleosome occupancy in S. cerevisiae [red line: log2ratio of hybridization data retrieved from (12)]. Red ovals represent nucleosome positions predicted in (12). (A) Representative portion of chromosome III. (B–E) Local views of regions presented in the experimental analysis of nucleosome occupancy (12); (B) HIS3 promoter; (C) CHA1 promoter (note that the theoretical model predicts the presence of a positioned nucleosome separating the divergent promoters. This nucleosome is detected at a lower frequency than predicted, presumably because of the influence of the machineries interacting with the two surrounding promoters); (D, E) local views of chromosome III regions showing both localized and delocalized nucleosomes. In abscissa, units are 100 kb in (A), 1 bp in (B, C), 10 kb in (D, E). The correlation between experimental data and −ΔF values over the whole chromosome III region analysed is r = 0.45, P < 10−15.
A striking correlation between prediction and experimental data was observed in promoter regions (Figure 1A, Supplementary Figure 2 and close-up views in Figure 1B–E). Eukaryotic promoters present a low nucleosome occupancy region rendering DNA accessible to the transcription machinery and to regulatory factors (12,27–29). The energy profiles we calculated are in agreement with this, presenting a deep minimum in a number of promoter regions. Averaging over all promoters analysed by Yuan et al. (12), we find that the mean experimental profile and the predicted profile at the 5′-end of S. cerevisiae genes both display a characteristic V-shape centered 100 bp upstream of the start codon (Figure 2A) which corresponds to low nucleosome occupancy. This segment is bordered on both sides by regions with large −ΔF and nucleosome occupancy values. In addition, the four positioned nucleosomes at the 5′-end of the coding region spanning the fragment (0 − 600 bp) that are visible in the averaged experimental data (12) are predicted to some extent by our model with this promoter set. The mean −ΔF profile computed for all annotated S. cerevisiae protein coding genes presented the characteristic V-shape pattern predicted for promoters analysed experimentally, indicating that this pattern is a general intrinsic property shared by most S. cerevisiae promoters (Figure 5, S. cerevisiae profile). Previous studies (13,17) highlighted differences in promoter architecture between TATA-less and TATA-containing promoters. In agreement with experimental data, by averaging the mean −ΔF profile over each category, we predict the characteristic V-profile followed by successive peaks for TATA-less promoters and an irregular nucleosomal architecture for TATA-containing promoters (Figure 2B and C). This further demonstrates the ability of our model to capture sequence dependencies of chromatin architecture. Furthermore, our model was also able to discriminate between nucleosome sequence sets with various enrichment levels for nucleosome-positioning sequences (Supplementary Figure 4). Moreover, when computing the nucleosome energy profile using a recently developed threading method that uses a similar but more detailed model [e.g. integrating the elasticity of the full set of rigid base pair helical parameters (22)], we obtained similar results (See Material and methods section and Supplementary Figure 5). This indicates that, at the coarse-grained level considered here, our simple model is quite effective, even though some of its simplifications might not be as effective at a fine-grain level, in particular, to describe rotational positioning.
Figure 2.

Comparison of predicted nucleosome occupancy −ΔF (blue line) with experimentally determined nucleosome occupancy [red line, retrieved from (12)] in S. cerevisiae promoter regions of different architecture. (A) Average values corresponding to 473 promoters aligned by start codon; the correlation between experimental and predicted values is r = 0.87, P < 10−15. (B) As in (A) for 320 TATA-less promoters. (C) As in (A) for 82 TATA-containing promoters.
Figure 5.

Predicted promoter nucleosome occupancy profiles of different yeast species. −ΔF profiles calculated for all annotated genes (ORFs) of the indicated yeast genomes. The numbers of analysed gene promoters were Candida glabrata (5272), Debaryomyces hansenii (6895), Kluyveromyces lactis (5331), S. cerevisiae (5806), S. pombe (5082), Y. lipolytica (6666). The S. pombe profile is in agreement with the low histone density found at promoters (35).
Nucleosome positions inference
The accuracy of nucleosome positioning can vary not only along the sequence, but also according to the experimental procedure used to monitor it. In the initial chromosome tiling array mapping (12), 50-mer oligonucleotides were tiled with 20 bp spacing, the MNase-digested chromatin DNA was labelled by random priming, and the log2 of the ratio of the chromatin DNA to naked DNA signal was used to detect well-positioned nucleosomes by HMM modelling. As an approximation, one could consider the model as based on the detection of positive log ratio values on six to eight successive probes bracketed by one or more negative value probes. If there were more than eight successive probes with positive values, the nucleosomes were interpreted as delocalized. The energy profile was used to determine the nucleosome positions on the whole chromosome III with a similar HMM, where the hidden states inferred with the Viterbi algorithm were interpreted as linker or nucleosome states. This automated method allows for an objective comparison of our predictions with experimentally determined nucleosome positions, by measuring the distance between respective centres. This analysis revealed that our model displays significant performance (Figure 3) with up to 82% improvement on random expectation, in particular, if some flexibility is given to the interpretation of the precision of nucleosome positioning. Fifty-one percent of the centres that we predicted were within 40 bp of the centres predicted by HMM analysis of the experimental data, compared with the 28% expected by chance. These performances are well above those obtained with an alternative model (16) that is based on the role of periodic DNA-bending motifs that favour DNA wrapping around the histone octamer (6–10). This sustains that our physical model seemingly better captures the complexity of the distribution of curved DNA motifs (density and organization) with positive or negative contributions that ultimately reproduce the observed nucleosome occupancy. It should be noted, however, that the HMM approach extracts from the statistical distribution of nucleosome positions, as detected by a 20 bp-step MNase digestion profile, the most abundant nucleosome positions and thus converts a complex profile into a binary nucleosome-linker profile. This reductionist process can provide the false impression that nucleosomes are very precisely positioned even when they are statistically distributed around preferred positions. Furthermore, systematic experimental biases can modify the profiles that would then lead to erroneous inferences at some positions with the HMM approach. Indeed, two independent nucleosome positioning studies performed in yeast using tiling arrays at different resolutions led to relatively similar nucleosome distribution profiles that gave rise to more distinct HMM profiles (15). In addition, labelling biases due to the procedures used in the chromosome tiling analyses are presumably responsible for the reduction of several neighbouring, rotationally positioned nucleosomes to a single nucleosome position. Indeed, the labelling of nucleosome-length fragments by random priming is not uniform, with a 5′–3′ gradient of labelling for each DNA strand, whose steepness varies according to the experimental conditions. Thus, nucleosomes appear shorter than their actual length and indeed, in the study by Yuan et al. (12), positive signals observed on six successive probes (75% of the total) were already assigned to well-positioned nucleosomes, even though they corresponded to 120 bp MNase-resistant regions only. Accordingly, the positive signals observed on seven or eight successive probes should already be interpreted as more than a single nucleosome position. A higher variability in nucleosome positioning is indeed clearly visible in the massive sequencing mapping of H2A.Z-containing nucleosomes in yeast that allowed direct measurements of the accuracy of nucleosome positioning around promoters [(13), see also a comparison of nucleosome distributions as visualized by different analyses in Supplementary Figure 6]. Thus, a more faithful view of nucleosome position is provided by the experimental nucleosome occupancy profiles, which directly reflects the probability of nucleosome distribution along the DNA sequence rather than reducing the complex distribution to the dominant nucleosome positions. The similarity between this profile and the energetic profile predicted by our model reveals that the physical parameters of DNA greatly contribute to the probability of nucleosome occupancy at a given position rather than determine precise nucleosome positions.
Figure 3.

Performances of the HMM method for nucleosome position prediction. Cumulative distribution of the distances between centres of experimentally determined nucleosomes and nucleosomes predicted by our HMM approach (plain line) compared with random expectation (dashed line).
Divergent genes
To what extent is this nucleosomal organization common to divergent promoters? Indeed, in some instances divergently transcribed adjacent gene promoters share a short, low-nucleosome density region targeted by common regulatory factors. In S. cerevisiae, the length of DNA separating adjacent divergent ORFs, d, exhibits a bimodal distribution with peaks at 270 and 600 bp, allowing us to separate these genes into two sets (Figure 4A). Neighbouring promoters (d < 300 bp) present a mean nucleosome occupancy profile with a unique ∼ 200 bp low nucleosome occupancy region shared by both promoters (Figure 4B). This class is illustrated by the PET56/HIS3 divergent genes (Figure 1B) (11). In contrast, distant promoters (300 < d < 600 bp) exhibited two distinct low nucleosome occupancy regions separated from each other by a variable zone with higher nucleosome density (Figure 4C) as exemplified by the GRX1/LSB5 genes (Figure 1E). The mean −ΔF profiles computed for these two classes of genes reproduced remarkably well the experimental data (Figure 4B and C). Thus, in yeast, a chromatin architecture specific to promoters of divergently transcribed neighbouring genes is written in the DNA sequence, which suggests that this organization can allow particular types of concerted regulation.
Figure 4.

Nucleosome occupancy in promoter regions of adjacent diverging genes in S. cerevisiae. (A) Histogram of distance d between start codons of 3006 diverging S. cerevisiae coding sequence (CDS). The bimodal distribution was fitted with two Gaussian curves; mean: 270 bp (red line) and 600 bp (blue line). (B) Mean nucleosome occupancy (red line) and −ΔF (blue line) profiles of CDS separated by d < 300 bp (200 genes); in abscissa, the region used for analysis spans from the centre of the region separating the start codons to +200 bp. The correlation between predicted and experimental values is r = 0.95, P < 10−15. (C) As in (B) for CDS separated by 300 < d < 600 bp (78 genes); the correlation between predicted and experimental values is r = 0.90, P < 10−15.
Other yeast species
This predicted chromatin organization is evolutionarily conserved among yeast species. This is demonstrated by the fact that the mean energy profiles −ΔF computed in all promoter regions of different yeast species are similar to that which, in S. cerevisiae, predicts a region with low nucleosome occupancy (−200 to 0 bp) followed by a region with high nucleosome occupancy near the start codon (Figure 5). Schizosaccharomyces pombe and Yarrowia lipolytica are evolutionarily distant from S. cerevisiae and present a larger predicted region of nucleosome instability in the promoter. The evolutionary conservation of the energetic profiles further highlights the importance of the physical parameters of DNA in the formation of nucleosome instability regions within promoters.
Drosophila melanogaster
If, as observed in yeast, nucleosome occupancy can be inferred from the physical properties of DNA, our methodology should equally apply to evolutionarily distant eukaryotes. To test for such universality, we first analysed nucleosome occupancy measurements that were performed using massive sequencing of chromatin from the nematode Caenorhabditis elegans (14). Due to the relatively low sequencing coverage, the distribution of nucleosome positions is reliably established on repeated sequences only. As can be seen for the 5S RNA genes, our physical model predicts the pattern of nucleosome distribution (Supplementary Figure 7). To extend the generality of our prediction further, we took advantage of a study of histone H3.3 replacement in D. melanogaster (25,26), in which chromatin sensitivity to MNase was determined at a resolution that was sufficiently high to permit analysis of promoter accessibility. To appreciate the experimental biases in the data set, we first compared the signals obtained with MNase-treated chromatin in promoter regions with the ratio of chromatin to naked DNA that was either sheared to similar length by sonication or digested in vitro with MNase (Figure 6A). As in yeast, we noted that the experimental profile displays a V-shaped pattern spanning a ∼ 100–200 bp region with low nucleosome density upstream the transcription start site (Figure 6A). The chromatin alone profile displays a much larger trough than observed with the ratio of chromatin to DNA digested in vitro with MNase that corrects for both hybridization, labelling and MNase-specificity biases. Hybridization and labelling biases alone, as detected by comparing the chromatin profile with the ratio of chromatin to sonicated DNA, contributes a significant proportion of the large trough that can be attributed, at least in part, to the presence of AT-rich stretches in the promoters that affects systematically the intensity of the hybridization signals (Supplementary Figure 8). We used the experimental data corrected with DNA digested in vitro with MNase because they correct for most of the experimental biases that one can anticipate. Strikingly, with this corrected data set, the trough of chromatin accessibility includes the transcription start site, a situation that has also been observed recently in human promoters (30). Next, we examined whether the nucleosome organization at promoters was correlated with the transcription rate. As performed by Mito et al. (25), genes were rank-ordered on the basis of RNA Pol II density and divided into three subsets. We observed that experimentally derived mean nucleosome occupancy at promoters of genes with high and intermediate Pol II density presents a deep and narrow V-shaped profile, in contrast with that of promoters of weakly expressed genes, where the trough is hardly visible (Figure 6B). Hence, nucleosome depletion at promoters parallels gene activity in Drosophila. Remarkably, the shape of these profiles is tightly correlated with the corresponding −ΔF profiles (Figure 6C) showing that the intrinsic physical properties of promoter DNA play a significant role in the correlation observed between nucleosome depletion and the transcription rate. This correlation is observed not only on the mean profile but also on the juxtaposed individual profiles of the genes rank-ordered on the basis of RNA Pol II density (Figure 6D). Reciprocally, the transcription activity of a gene can be significantly inferred from the nucleosome-occupancy energy profile of its promoter. By classifying the promoter energy curves into two classes using a clustering algorithm, we obtained a deep V-profile (class 1) and a wide and shallow profile (class 2) similar to the profiles of high and low expression gene promoters (compare Figure 6C and D and Supplementary Figure 9A and B). Highly transcribed genes preferentially cluster in class 1 (V-profile) whereas promoters with low polymerase density cluster in class 2 (shallow profile), further highlighting the link between transcriptional activity and the physical properties of promoter DNA in Drosophila (Supplementary Figure 9C). The location of the centre of the trough is not identical, however, between the predicted and experimental profiles, with the centre of the −ΔF profile being shifted by about 150 bp upstream the centre of the experimental trough. This shift appears specific of Drosophila promoters as we observed that the predicted and corrected experimental profiles overlapped very well at the non-promoter regulatory regions that were analysed by Mito et al. (Figure 6G and H) (26). The trough of chromatin accessibility seen at the enhancers and boundary elements that are targeted by the Trithorax and Polycomb group proteins zeste and Ez/Psc could be accurately predicted by our physical model and was not repositioned, in contrast to our observations at promoters.
Figure 6.

Comparison of predicted energy profile with experimental nucleosome occupancy in D. melanogaster regulatory regions. (A) Using experimental data retrieved from (26) the chromatin profile (log of nucleosomal DNA, plain line) and the chromatin profiles corrected for hybridization biases (log of nucleosomal DNA over naked DNA treated by sonication, dashed line) and MNase cleavage specificity biases (log of nucleosomal DNA over naked DNA treated by MNase hybridization data, dotted line) were aligned by transcription start site at 1610 chromosome 2L promoter regions. (B–D) Relationship between nucleosome occupancy and transcriptional activity. The 1610 gene promoters were rank ordered on the basis of RNA Pol II density and divided into three subsets (25): high (blue line), middle (green line) and low (red line) Pol II density. (B) Experimental values corrected for both biases (log of nucleosomal DNA over naked DNA treated by MNase hybridization data) as in (A). (C) Predicted nucleosome occupancy −ΔF profiles. (D) Colour-scale image of −ΔF profiles, red and blue for high and low energy values, respectively. (E, F) Comparison of experimental profiles [as in (B), red line] and −ΔF profiles (blue line) aligned at 390 Zeste-binding sites (E) and 198 EZ+PSC peaks (F).
DISCUSSION
This study shows that nucleosome occupancy can be significantly predicted ab initio by physical modelling of DNA wrapping around the histone core. Because the model involves no DNA–protein interaction parameters, our data indicate that, in respect to the dominant features that control nucleosome occupancy, the nucleosome essentially behaves as a neutral DNA-wrapping cylinder. Thus, the model should have a more-or-less universal predictive power across numerous eukaryotic genomes, a conclusion supported by its effectiveness in both yeast and fly and reinforced by the experimental results obtained for nucleosome occupancy in the 5S gene of C. elegans [(14), Supplementary Figure 7]. In vertebrates, however, nucleosome occupancy in promoter regions may rely on a different set of physical parameters, in particular in CpG islands (unpublished observations). Furthermore, nucleosomes can occupy unfavourable positions in vivo due to the action of energy-consuming nucleosome remodelling complexes such as the Iswi2 complex (31). In addition, nucleosome spacing, and therefore positioning, can differ between metazoan cell-types and upon variation of linker histone H1 levels (32,33). Thus, we do not expect a DNA-based physical model to predict every nucleosome position occupied in vivo in all species. The model does, however, accurately predict average nucleosome occupancy at key regulatory regions. It has long been established that chromatin is accessible at active promoters and that promoter accessibility often results from the concerted action of transcription factors and chromatin-remodelling complexes (3). The model establishes the physical basis of promoter accessibility, showing on a large scale that nucleosome organization at promoters results at least in part from sequence-derived energy effects that (i) hinder DNA curving and nucleosome formation upstream of transcribed regions and (ii) facilitate nucleosomal formation in regions bordering this nucleosome instability region. The physical properties of DNA affecting promoter accessibility might contribute to some extent to gene expression. In extreme cases, they might on their own give rise to a nucleosome-free region that would be freely accessible to transcription factor binding. Alternatively, by destabilizing nucleosomes they might facilitate remodelling triggered by transcription factor binding and/or action of chromatin-remodelling complexes. Such a possibility is supported by our comparative analysis of Drosophila promoters and non-promoter regulatory regions. Our model predicts in both cases the existence of a region unfavourable for nucleosome formation that coincides with the nucleosome-depleted region commonly observed in chromatin at active regulatory regions. However, in promoters the centre of the observed trough is shifted towards the transcription start site when experimental biases are corrected, whereas the prediction and experimental data overlap perfectly at other regulatory regions. This suggests that, at promoters, repositioning of the nucleosome-free region might frequently occur as a consequence of the recruitment of some component of the basal transcription machinery. The recruitment of transcription factor IID, and in particular of the TATA-binding protein (TBP), might be responsible for this specific repositioning. Indeed, during the course of the activation of a well-studied higher eukaryote promoter, the β-interferon promoter, it was shown that a complex of activating transcription factors was first assembled upstream the transcription start site in a nucleosome-free region, and that, following recruitment of chromatin-remodelling complexes, neighbouring nucleosomes became more mobile, allowing TBP recruitment and repositioning of a nucleosome away from the promoter (34). If such a process occurred in many fly promoters, it would explain why, on average, the nucleosome-free region can be shifted away from the region that is unfavourable for nucleosome formation: this latter region would behave as an entry point for factors that would then promote recruitment of the basal transcription machinery which in turn would exclude nucleosome around the transcription start site. In most yeast promoters and in fly non-promoter regulatory regions, the physical properties of DNA would determine the location of the nucleosome-free region more directly. Strikingly, our analyses show that in Drosophila, the transcriptional rate appears to be dependent not only on regulatory factors and chromatin-modifying enzymes, but also on the physical properties of promoter DNA. Thus, in our proposed interpretation of fly promoter behaviour, the physical properties of DNA would favour the efficiency of upstream transcription factor recruitment, which would subsequently determine the efficiency of basal transcription machinery recruitment and activation, as well as the global efficiency of chromatin remodelling. In general, it appears that the importance of these physical properties of DNA for chromatin organization and gene regulation surpasses current expectations.
Our analysis also reveals some of the difficulties encountered in global nucleosome positioning analyses. ChIp-chip data can have systematic biases due to either the labelling procedure or the hybridization properties of the oligonucleotides when a systematic tiling strategy is used. Labelling by random priming can lead to biases in the relative representation of the nucleosomal DNA at the centre and the edges of the nucleosome. This can cause reduction in the apparent average length of individual nucleosomes and lead to an underappreciation of the extent of diversity of nucleosome positions. Furthermore, hybridization biases might be observed with non-isothermal array designs because, within a certain range, the efficiency of hybridization depends on the GC content of the oligonucleotide probe. Since there is an overlap between the sequence-dependent physical properties of DNA that affect DNA structure and flexibility and those that affect DNA hybridization, it might be difficult to unambiguously interpret the correlation between DNA sequence features and apparent chromatin organization. Indeed, AT-rich regions simultaneously correspond to large roll angle values affecting markedly the −ΔF value in our model, and are correlated with various parameters like major and minor groove size and mobility and free energy of bending, which were proposed to be correlated with nucleosome positions in yeast (15). Furthermore, they also affect DNA hybridization, and thus signal strength and reliability in the microarray analysis. Indeed, we observed in fly promoters that this can cause systematic biases in the data. We must keep in mind that it is also possible that these biases were not fully corrected, even when the ratio of chromatin to naked DNA was analysed, because systematic variations in signal intensity might cause systematic errors following background subtraction and intensity normalization. Such biases cannot, however, be fully responsible for the correlation we observed, because the correlation was also observed following direct determination of nucleosome position in both yeast and nematode by massive sequencing. Finally, biases due to MNase cleavage specificity were also observed with the fly data where this parameter was assessed. The yeast ChIp-chip data were not properly or not at all controlled for this parameter, whereas the massive sequencing of H2A.Z-containing nucleosomes in yeast revealed the existence of a sequence-dependent cleavage preference for MNase (13), which could also be responsible for systematic biases in nucleosome position determination and for part of the correlation between DNA sequence and experimental data. Nevertheless, even if such biases do cause local inaccuracies, the correlation between the prediction and the experimental data is strong enough to resist our attempts to take into account as much as possible potential and visible experimental biases. The sequence-dependent DNA physical properties clearly participate in chromatin organization and genome activity in various species. In particular, in Drosophila, the transcription rate appears remarkably affected by the physical properties of promoter DNA. This reveals the importance of these properties for chromatin organization and gene regulation. Accurate and unbiased large-scale nucleosome organization determination in combination with the ability to decipher such level of information from physical modelling of DNA should shed new light on the relationships between genome sequences and activities.
SUPPLEMENTARY DATA
Supplementary Data are available at NAR Online.
ACKNOWLEDGEMENTS
We thank B. Prum for having initiated this work. We thank O. Rando, S. Henikoff, S. Johnson and A. Fire for providing data. We thank M. Hoebeke and F. Picard for helpful advice, T. Strick, A. Kropfinger and S. Camier-Thuillier for critical reading of the manuscript. This work was supported by the Agence Nationale de la Recherche (NT05-3_41825 to C.T., NT05-1_41977 to T.G. and ANR-06-PCVI-2006 to C.V.), the ACI IMPBIO 2004 (C.T.), the Association pour la Recherche sur le Cancer (T.G.), the Centre National de la Recherche Scientifique and the French Ministère de l'Education et de la Recherche. Funding to pay the Open Acess publication charges for this article was provied by Centre National de la Recherche Scientifique.
Conflict of interest statement. None declared.
REFERENCES
- 1.Luger K, Mäder AW, Richmond RK, Sargent DF, Richmond TJ. Crystal structure of the nucleosome core particle at 2.8 Å resolution. Nature. 1997;389:251–260. doi: 10.1038/38444. [DOI] [PubMed] [Google Scholar]
- 2.van Holde K. Springer, New York: 1989. Chromatin. [Google Scholar]
- 3.Mellor J. The dynamics of chromatin remodelling at promoters. Mol. Cell. 2005;19:147–157. doi: 10.1016/j.molcel.2005.06.023. [DOI] [PubMed] [Google Scholar]
- 4.Felsenfeld G. Chromatin as an essential part of the transcriptional mechanism. Nature. 1992;355:219–224. doi: 10.1038/355219a0. [DOI] [PubMed] [Google Scholar]
- 5.Kornberg RD, Lorch Y. Twenty-five years of the nucleosome, fundamental particle of the eukaryote chromosome. Cell. 1999;98:285–294. doi: 10.1016/s0092-8674(00)81958-3. [DOI] [PubMed] [Google Scholar]
- 6.Satchwell SC, Drew HR, Travers AA. Sequence periodicities in chicken nucleosome core DNA. J. Mol. Biol. 1986;191:659–675. doi: 10.1016/0022-2836(86)90452-3. [DOI] [PubMed] [Google Scholar]
- 7.Shrader TE, Crothers DM. Artificial nucleosome positioning sequences. Proc. Natl Acad. Sci. USA. 1989;86:7418–7422. doi: 10.1073/pnas.86.19.7418. [DOI] [PMC free article] [PubMed] [Google Scholar]
- 8.Ioshikhes I, Bolshoy A, Derenshteyn K, Borodovsky M, Trifonov EN. Nucleosome DNA sequence pattern revealed by multiple alignment of experimentally mapped sequences. J. Mol. Biol. 1996;262:129–139. doi: 10.1006/jmbi.1996.0503. [DOI] [PubMed] [Google Scholar]
- 9.Widom J. Role of DNA sequence in nucleosome stability and dynamics. Q. Rev. Biophys. 2001;34:269–324. doi: 10.1017/s0033583501003699. [DOI] [PubMed] [Google Scholar]
- 10.Anselmi C, De Santis P, Paparcone R, Savino M, Scipioni A. From the sequence to the superstructural properties of DNAs. Biophys. Chem. 2002;95:23–47. doi: 10.1016/s0301-4622(01)00246-0. [DOI] [PubMed] [Google Scholar]
- 11.Sekinger EA, Moqtaderi Z, Struhl K. Intrinsic histone-DNA interactions and low nucleosome density are important for preferential accessibility of promoter regions in yeast. Mol. Cell. 2005;18:735–748. doi: 10.1016/j.molcel.2005.05.003. [DOI] [PubMed] [Google Scholar]
- 12.Yuan GC, Liu YJ, Dion MF, Slack MD, Wu LF, Altschuler SJ, Rando OJ. Genome-scale identification of nucleosome positions in S. cerevisiae. Science. 2005;309:626–630. doi: 10.1126/science.1112178. [DOI] [PubMed] [Google Scholar]
- 13.Albert I, Mavrich TN, Tomsho LP, Qi J, Zanton SJ, Schuster SC, Pugh F. Translational and rotational settings of H2A.Z nucleosomes across the Sacchoromyces cerevisiae genome. Nature. 2007;446:572–576. doi: 10.1038/nature05632. [DOI] [PubMed] [Google Scholar]
- 14.Johnson SM, Tan FJ, McCullough HL, Riordan DP, Fire AZ. Flexibility and constraint in the nucleosome core landscape of Caenorhabditis elegans chromatin. Genome Res. 2006;16:1505–1516. doi: 10.1101/gr.5560806. [DOI] [PMC free article] [PubMed] [Google Scholar]
- 15.Lee W, Tillo. D, Bray N, Morse RH, Davis RW, Hughes TR, Nislow C. A high-resolution atlas of nucleosome occupancy in yeast. Nat. Genet. 2007;39:1235–1244. doi: 10.1038/ng2117. [DOI] [PubMed] [Google Scholar]
- 16.Segal E, Fondufe-Mittendorf Y, Chen L, Thastrom A, Field Y, Moore IK, Wang JZ, Widom J. A genomic code for nucleosome positioning. Nature. 2006;442:772–778. doi: 10.1038/nature04979. [DOI] [PMC free article] [PubMed] [Google Scholar]
- 17.Ioshikhes IP, Albert I, Zanton SJ, Pugh BF. Nucleosome positions predicted through comparative genomics. Nat. Genet. 2006;38:1104–1105. doi: 10.1038/ng1878. [DOI] [PubMed] [Google Scholar]
- 18.Peckham HE, Thurman RE, Fu Y, Stamatoyannopoulos JA, Noble WS, Struhl K, Weng Z. Nucleosome positioning signals in genomic DNA. Genome Res. 2007;17:1170–1177. doi: 10.1101/gr.6101007. [DOI] [PMC free article] [PubMed] [Google Scholar]
- 19.Richmond TJ, Davey CA. The structure of DNA in the nucleosome core. Nature. 2003;423:145–150. doi: 10.1038/nature01595. [DOI] [PubMed] [Google Scholar]
- 20.Neukirch S. Extracting DNA twist rigidity from experimental supercoiling data. Phys. Rev. Lett. 2004;93:198107. doi: 10.1103/PhysRevLett.93.198107. [DOI] [PubMed] [Google Scholar]
- 21.Brower-Toland BD, Yeh RC, Smith CL, Lis JT, Peterson CL, Wang MD. Mechanical disruption of individual nucleosomes reveals a reversible multistage release of DNA. Proc. Natl Acad. Sci. USA. 2002;99:1960–1965. doi: 10.1073/pnas.022638399. [DOI] [PMC free article] [PubMed] [Google Scholar]
- 22.Tolstorukov MY, Colasanti AW, McCandlish DM, Olson WK, Zhurkin VB. A novel roll-and-slide mechanism of DNA folding in chromatin: implications for nucleosome positioning. J. Mol. Biol. 2007;371:725–738. doi: 10.1016/j.jmb.2007.05.048. [DOI] [PMC free article] [PubMed] [Google Scholar]
- 23.Olson WK, Gorin AA, Lu XJ, Hock LM, Zhurkin VB. DNA sequence-dependent deformability deduced from protein-DNA crystal complexes. Proc. Natl Acad. Sci. USA. 1998;95:11163–11168. doi: 10.1073/pnas.95.19.11163. [DOI] [PMC free article] [PubMed] [Google Scholar]
- 24.Lu XJ, Olson WK. 3DNA: a software package for the analysis, rebuilding and visualization of three-dimensional nucleic acid structures. Nucleic Acids Res. 2003;31:5108–5121. doi: 10.1093/nar/gkg680. [DOI] [PMC free article] [PubMed] [Google Scholar]
- 25.Mito Y, Henikoff JG, Henikoff S. Genome-scale profiling of histone H3.3 replacement patterns. Nat. Genet. 2005;37:1090–1097. doi: 10.1038/ng1637. [DOI] [PubMed] [Google Scholar]
- 26.Mito Y, Henikoff JG, Henikoff S. Histone replacement marks the boundaries of cis-regulatory domains. Science. 2007;315:1408–1411. doi: 10.1126/science.1134004. [DOI] [PubMed] [Google Scholar]
- 27.Mai X, Chou S, Struhl K. Preferential accessibility of the yeast his3 promoter is determined by a general property of the DNA sequence, not by specific elements. Mol. Cell Biol. 2000;20:6668–6676. doi: 10.1128/mcb.20.18.6668-6676.2000. [DOI] [PMC free article] [PubMed] [Google Scholar]
- 28.Lee CK, Shibata Y, Rao B, Strahl BD, Lieb JD. Evidence for nucleosome depletion at active regulatory regions genome-wide. Nat. Genet. 2004;36:900–905. doi: 10.1038/ng1400. [DOI] [PubMed] [Google Scholar]
- 29.Bernstein BE, Liu CL, Humphrey EL, Perlstein EO, Schreiber SL. Global nucleosome occupancy in yeast. Genome Biol. 2004;5 doi: 10.1186/gb-2004-5-9-r62. R62. [DOI] [PMC free article] [PubMed] [Google Scholar]
- 30.Schmid CD, Bucher P. ChIP-Seq data reveal nucleosome architecture of human promoters. Cell. 2007;131:831–832. doi: 10.1016/j.cell.2007.11.017. [DOI] [PubMed] [Google Scholar]
- 31.Whitehouse I, Rando OJ, Delrow J, Tsukiyama T. Chromatin remodelling at promoters suppresses antisense transcription. Nature. 2007;450:1031–1035. doi: 10.1038/nature06391. [DOI] [PubMed] [Google Scholar]
- 32.Woodcock CL, Dimitrov S. Higher-order structure of chromatin and chromosomes. Curr. Opin. Genet. Dev. 2001;11:130–135. doi: 10.1016/s0959-437x(00)00169-6. [DOI] [PubMed] [Google Scholar]
- 33.Woodcock CL, Skoultchi AI, Fan Y. Role of linker histone in chromatin structure and function: H1 stoichiometry and nucleosome repeat length. Chromosome Res. 2006;14:17–25. doi: 10.1007/s10577-005-1024-3. [DOI] [PubMed] [Google Scholar]
- 34.Lomvardas S, Thanos D. Nucleosome sliding via TBP DNA binding. in vivo. Cell. 2001;106:685–696. doi: 10.1016/s0092-8674(01)00490-1. [DOI] [PubMed] [Google Scholar]
- 35.Wiren M, Silverstein RA, Sinha I, Walfridsson J, Lee HM, Laurenson P, Pillus L, Robyr D, Grunstein M, Ekwall K. Genome-wide analysis of nucleosome density histone acetylation and HDAC function in fission yeast. EMBO J. 2005;24:2906–2918. doi: 10.1038/sj.emboj.7600758. [DOI] [PMC free article] [PubMed] [Google Scholar]
Associated Data
This section collects any data citations, data availability statements, or supplementary materials included in this article.