Abstract
Imaging of DNA, keyhole limpet hemocyanin, mouse monoclonal IgG, and glucose oxidase on a mica substrate has been accomplished by scanning electrochemical microscopy with a tungsten tip. The technique requires the use of a high relative humidity to form a thin film of water on the mica surface that allows electrochemical reactions to take place at the tip and produce a faradaic current (≈1 pA) that can be used to control tip position. The effect of relative humidity and surface pretreatment with buffer solutions on the ionic conductivity of a mica surface was investigated to find appropriate conditions for imaging. Resolution of the order of 1 nm was obtained.
High-resolution imaging of nanostructured materials, especially soft and sensitive biological samples, poses a great challenge in material science and biology. The structures of individual biological molecules at nanometer-scale resolution have been traditionally studied by high-resolution electron microscopy and x-ray crystallography. However, these techniques often require difficult sample-preparation procedures and potentially damaging experimental conditions or depend on the availability of obtaining crystalline samples. The atomic-force microscope has been extensively used to image biological samples and is especially convenient because the molecules can be observed under ambient or physiological conditions. However, atomic-force microscopy does not provide chemical information, and special precautions are required to prevent the tip from damaging or altering the sample. In the family of scanning probe microscopes (1), the scanning electrochemical (EC) microscope (SECM) allows for both structural and chemical information of the surface (so-called chemical imaging). However, the application of SECM has largely focused on analytical investigations, e.g., in studies of interfacial kinetics, rather than as a high-resolution imaging tool (2). In the amperometric mode, the SECM is similar to the better-known scanning tunneling microscope (STM), in that it measures the current flow through a conductive tip. However, it differs from the STM in that the current response is an EC one, and the sample is interrogated by solution species generated or reacting at the tip rather than by a strong interaction with the tip itself.
The resolution attainable with a SECM is largely governed by the tip size and the distance between tip and sample. Most SECM measurements are carried out with the sample under a thick liquid layer; under these conditions, the tip must be sheathed in an insulator so that only the very end is exposed to solution to achieve high resolution. SECM measurements can also be carried out in ambient or humid air. When a substrate, like mica, with a hydrophilic surface is exposed to air, a thin layer of water forms on the surface. As shown by Guckenberger et al. (3), imaging is possible within this thin liquid layer. As we have discussed previously (4, 5), the current that passes between tip and contact is a faradaic one, based on EC reactions that take place within the thin liquid layer. In this case, very high resolution can be attained with a tip without insulation, because only the end of the tip is in contact with the liquid layer. A similar approach was previously used to fabricate small metal or conductive polymer structures in polymer films by carrying out EC deposition in air (6–8). Etching and imaging of highly ordered pyrolytic graphite at nanometer resolution was also achieved by this approach (9). In the latter case, etching took place only when the highly ordered pyrolytic graphite was biased at a voltage >2.3 V with respect to the tip; a negative substrate bias did not generate a pattern, strongly suggesting that an EC oxidation occurs in the etching process.
Following the work of Guckenberger et al. (3), we recently carried out some preliminary SECM measurements on mica surface in humid air and reported the imaging of a Nafion thin film (4) and the deposition of silver nanostructures (5). In this paper, we describe the imaging of biological samples (DNA and some structurally well-characterized protein molecules) with this technique. The results are compared with those obtained by the more established techniques. Finally, we investigated the effects of humidity and various surface treatments (with different buffer solutions) on the conductance of a mica substrate.
Materials and Methods
Chemicals.
Plasmid DNA (2.96 kbp, 21.75 μg/ml) and keyhole limpet hemocyanin (KLH; molecular mass of ≈7–8 × 10⁶ Da) samples were kindly provided by B. L. Iverson and G. Chen (University of Texas, Austin). The mouse monoclonal IgG (11.0 mg/ml; molecular mass of 150 kDa) Ab sample was obtained from Jackson ImmunoResearch, and glucose oxidase (GOD; molecular mass of 160 kDa, from Aspergillus niger) was purchased from Roche Molecular Biochemicals. These samples were used as received in imaging without additional purification. Ir-Pt (20–80%) rods with a 0.25-mm diameter were obtained from FHC (Brunswick, ME), and W rods with a 0.5-mm diameter were obtained from Aldrich. Mica sheets were purchased from Spruce Pine Mica Company (Spruce, NC). Tris/EDTA (TE) buffer [10 mM Tris⋅HCl (pH 7.6)/1 mM EDTA] and phosphate buffer [0.12 mM NaH2PO4/0.84 mM NaCl/0.046 mM NaN3 (pH 7.4)] were prepared from reagent-grade chemicals and deionized water (Milli-Q; Millipore).
Instrumentation and Sample Preparation.
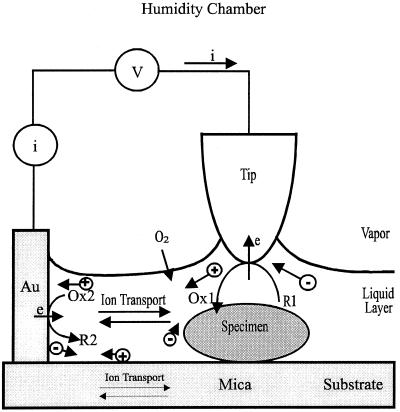
The instrument employed in the following studies was capable of both SECM and STM measurements with a current sensitivity of <0.05 pA (10). W tips were used in most of the work reported here and were prepared by electrochemically etching the 0.5-mm diameter wires in 3 M NaOH with a carbon plate counter electrode at 20 V rms until the tip was completely out of the solution. The SECM/STM scanning head was contained in a Faraday cage and a Plexiglas box in which the relative humidity (RH) of the atmosphere was controlled by various humidity-limiting solutions (11, 12). A nearly steady-state humidity within the box was usually attained within 1 hr as determined by monitoring the surface conductance of the mica sample or by measuring the RH with a humidity probe (model 6517-RH; Keithley). The tip-sample arrangement is shown in Fig. 1. In all experiments, the tip was laterally positioned ca. 1 mm away from the Au contact on the mica, and the imaging process was carried out in the constant current mode. In the ac-admittance measurements, a small ac voltage (10 mV peak-to-peak amplitude, 10 kHz) was superimposed on the dc bias, and the admittance was measured with a phase-sensitive detector (13, 14).
Figure 1.
Schematic diagram for the SECM chamber with controlled humidity, and the EC processes that control the current. The tip was located laterally ca. 1–2 mm away from the Au counter electrode. For illustration purposes, the thickness of the liquid layer is exaggerated to accommodate equations for the various EC processes. V, voltage bias between the tip and Au contact. i, current flow through the tip. R and Ox represent the reduced and oxidized forms of an electroactive species. ⊕ and ⊝ represent cations and anions in the liquid layer and in the mica sheet.
Throughout this work, 1 × 0.5 cm pieces of mica partially coated on one side with ca. 50-nm-thick Au contact, which served as the reference/counter electrode, were used as the substrates. Au deposition was carried out by vacuum evaporation. If not otherwise mentioned, the mica substrate was treated with a small drop (≈10 μl) of a phosphate buffer solution containing the specimen for ca. 10 min in the lab ambient (at ca. 25°C). The sample was then mounted on the SECM/STM and allowed to equilibrate with the atmosphere within the humidity chamber for ca. 1 hr before the scanning experiments were carried out.
The biological specimen and the mica substrate are normally covered by a thin layer of water (a few nanometers or less) at moderate RH. When the tip, biased with respect to the Au electrode, is brought into contact with the water layer containing a sufficient concentration of ions, a measurable current (≈pA) results. When the constant–current mode, as normally operated in STM, is used, the feedback mechanism will cause the tip to move up and down to maintain contact with the thin electrolyte layer. Therefore, the z-position of the tip provides information about the surface topology of the specimen.
Results
Surface Conductance of Mica—The Effects of Relative Humidity and Ion Concentration.
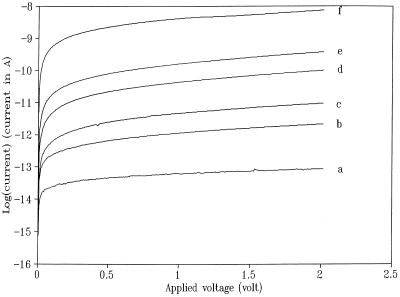
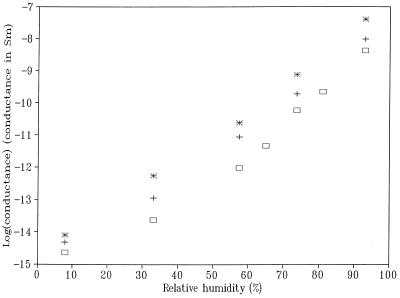
To obtain information about the surface conductivity of a mica substrate, after treatment with a buffer solution that can serve as a source of ions in the condensed liquid layer as a function of humidity, the following experiment was carried out. Two 50-nm-thick Au contacts separated by ca. 1 mm were deposited on a 1 × 0.8 cm piece of mica. A small drop (≈10 μl) of a buffer solution was spread over the gap to cover an area of ca. 0.3 × 0.8 cm. After partially drying in the ambient for ca. 10 min, the mica substrate was then allowed to equilibrate with the atmosphere within the humidity chamber for at least 1 hr before the current–voltage (iV) curves were obtained. Fig. 2 shows a series of semilogarithmic plots of iV curves for a bare mica substrate at different RH. On a very dry mica surface, the measured current was very small—ca. 20 fA at 2 V bias [with anhydrous Mg(ClO4)2 as the desiccant, in the chamber, RH < 10%]; it increased at least five orders of magnitude to 6.9 nA at 93% RH. Fig. 3 summarizes the conductance values measured at 2 V at various RH for the same mica sheet before and after the treatment with TE or phosphate buffer. As shown, the absolute conductance values of the bare mica surface increased slowly at low RH and more rapidly at high RH. A similar trend was reported previously (15) for the thickness of a water film on mica, as measured by ellipsometry, suggesting that observed conductance is closely related to the amount of water adsorbed on the mica surface. The average thickness of the water layer on a bare mica surface is about 0.4 nm at 70% RH (15). Note that although the surface conductance of the mica substrate was substantially enhanced (by one to two orders of magnitude) by the pretreatment with phosphate or TE buffer, similar behavior was observed for the RH dependence of the conductance with either. As demonstrated below, both buffer solutions can be successfully applied to image biological specimens. The conductance on untreated mica can probably be attributed to the presence of a small amount of ionic species that desorb from the mica or are included in the liquid layer from the air.
Figure 2.
A series of semilogarithmic plots of current–voltage curves for a bare mica substrate at different RH: 33% (a); 58% (b); 65% (c); 74% (d); 81% (e); and 93% (f).
Figure 3.
Conductance values at various RH for the same mica sheet before (□) and after (✠) the treatment with TE or phosphate (+) buffer. The conductance was measured as the slope of the current–voltage curve in the bias range of 1.5–2.0 V.
EC Behavior.
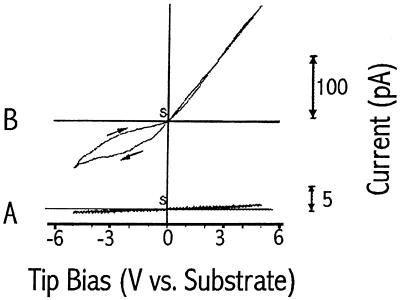
The current at the tip is attributed to oxidation or reduction of species in the liquid layer. Information about the mechanism of current flow was obtained from tip voltammetric curves under different conditions vs. the Au counter electrode. In these experiments, a rather blunt tip (radius of curvature ≈10 μm) was brought into contact with the mica substrate about 1 mm away from the Au contact, and the piezo-feedback was switched off to avoid changes in the tip–substrate gap during the voltage scan. For a blunt W tip on mica treated with TE buffer (Fig. 4A), the current was stable and increased almost linearly with applied voltage for positive tip bias. However, it saturated and showed considerable hysteresis on scan reversal with a negative tip bias. The observed EC behavior also depended on the pretreatment of the mica substrate. For example, the voltammetric behavior was very different when the mica was immersed in water for a few hours rather than treated with the TE buffer. In this case, the voltammetric curves at 100% RH at a blunt W tip (Fig. 4B) showed much smaller currents in the region of ±5 V. Thus, pretreatment of the mica substrate to provide ions in the water layer and thus increase its conductivity appears to be useful. After treatment with buffer solution, a sufficient number of ions are present on the mica surface to yield a conductivity useful for imaging purposes.
Figure 4.
Typical voltammetric curves at 100% RH and 25°C over a bare mica substrate (A) or a mica substrate treated with TE buffer solution (B). Radius of curvature of the W tip is ≈10 μm. In all cases, the voltage was scanned from 0 V (the starting point) in either direction and then returned to 0 V; scan rate, 0.2 V/s.
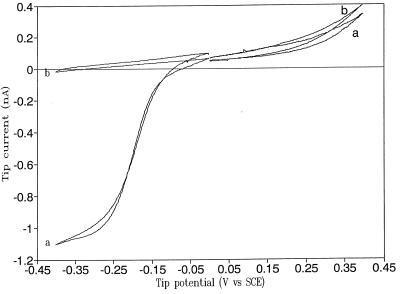
To get a rough estimate of the effective tip radius immersed in the water layer, which will produce a tip current of ca. 1 pA at 1 V bias, we compared the behavior in a liquid film to the well-known ultramicroelectrode behavior of a polyurethane-coated W tip in a bulk solution of 1 mM Ru(NH3)63+ in 10 mM NaClO4 (Fig. 5). A sigmoidal diffusion-limited current superimposed on a linear background current was obtained for the reduction of Ru(NH3)63+. From the equation for the steady-state current at an ultramicroelectrode, the effective radius of the tip is ca. 3 μm. Also shown in Fig. 5 is the anodic background current that is the result of the oxidation of W [in the absence of Ru(NH3)63+] at potentials positive of −0.4 V vs. SCE (curve b). The anodic background current at this tip at +0.5 V in this medium is about 1 nA. Thus, the observed pA current for a tip at a bias of 1 V vs. the large Au counter electrode would correspond to an estimated contact radius of <3 nm.
Figure 5.
Cyclic voltammograms of a polyurethane-coated W tip in deaerated 1 mM Ru(NH3)63+/10 mM NaClO4 solution (a) and 10 mM NaClO4 only (b). Potential scan rate is 5 mV/s.
SECM Behavior.
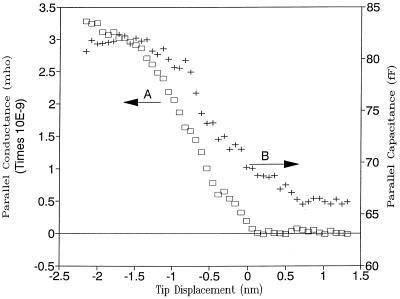
When a W tip (biased at +3 V) in air approached the sample at 3 nm/s, the current remained at 0 until it contacted the liquid layer, where the current increased very sharply, showing several orders of magnitude increase over a distance of a few nanometers. Accompanying this sharp increase in current as the tip contacted the liquid layer, both the parallel conductance and capacitance also increased very rapidly (see Fig. 6). The steady-state tip current provides the necessary feedback mechanism to control the tip position for high-resolution imaging.
Figure 6.
Typical parallel conductance (A) and parallel capacitance (B) vs. tip displacement curves for a blunt W tip at 100% RH at 25°C for a mica substrate treated with TE buffer solution. Tip bias was 3 V with respect to the Au counter electrode. The tip approached the substrate surface at 3 nm/s.
Imaging.
Because of the many potential pitfalls present in imaging with the STM, we used several structurally well-characterized biological molecules, which have distinctive three-dimensional structures and are hydrophilic on the majority of their surface to test the applicability of this technique.
DNA.
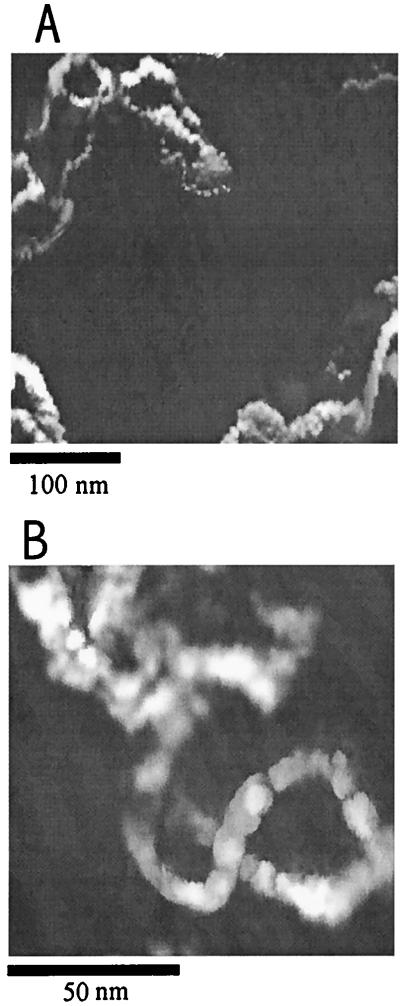
As reported by Guckenberger et al. (3), images of DNA on mica can be obtained by this technique. DNA on mica was prepared as follows: A small drop (≈10 μl) of a DNA specimen in TE buffer solution was placed on mica to cover an area of about 1 cm2 and left to adsorb for 5 min. The mica was then dipped in water for 1 s, partially dried for ca. 5 min in ambient air, and dipped again for 1 s in water. Excess water on the surface was carefully removed with tissue paper, and the sample was mounted on the SECM/STM and allowed to equilibrate with the atmosphere within the humidity chamber before the imaging was carried out. Fig. 7A shows the images of several DNA molecules on mica, taken with a sharp W tip biased at 3 V at 80% RH. A higher resolution image of a DNA molecule obtained by scanning over a small area is shown in Fig. 7B. The imaging was more stable with a positive tip bias. There was also a tendency to lose the image after repeated scans over the same area, presumably because electroactive species and water at or near the tip are depleted. Interestingly, the magnitude of the signal could be partially recovered if one waited a few minutes between different frames of imaging. The signal could also be recovered by imaging different areas. Because the tip is riding in a very thin water layer, it can interact with the molecules and thus affect the image to some extent. The tip may also move molecules around on the surface. Nevertheless, the main feature of the image of the DNA sample prepared under the conditions described above shows an irregular, supercoiled geometry.
Figure 7.
(A) Constant-current image of fragments of DNA specimen in humid air (80% RH at 25°C). The DNA specimen was deposited on a TE buffer-treated mica substrate. Image was taken with a sharp W tip at a reference current of 0.3 pA and a tip bias of 3 V. The tip raster rate was 0.25 Hz. (B) A high-resolution image of a DNA molecule obtained by scanning over a smaller area.
Proteins.
Ab (mouse monoclonal IgG), enzyme (e.g., GOD), and hemocyanin (KLH) molecules were also imaged by this technique. To minimize aggregate formation, low concentrations of protein were used. However, for imaging purposes, the protein concentration should be high enough to have sufficient coverage of protein molecules on the mica surface so that they can be found fairly easily. Solutions of IgG (15 μg/ml) and GOD (22.5 μg/ml) prepared in a phosphate buffer solution appear to be appropriate for this purpose. The solution preparation conditions, as described in Materials and Methods, involved adding a drop of buffer with protein to the mica surface and allowing it to equilibrate in the humidity chamber about 1 hr before imaging.
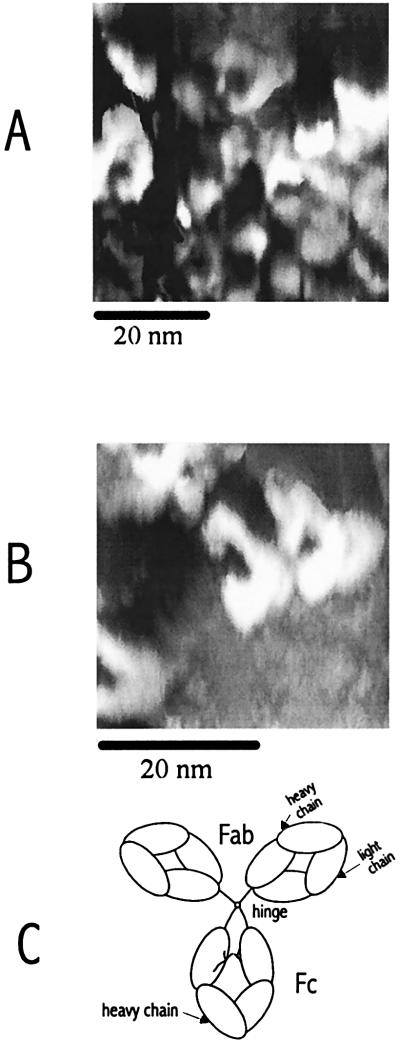
Fig. 8 shows a region of the mica surface that contains several mouse monoclonal IgG molecules. Most of the molecules of Ab were of similar size and had a characteristic quaternary structure: a C-shape with two arms and a body perhaps corresponding to the two Fab and one Fc fragments of the IgG molecule, as shown in Fig. 8C, a schematic drawing of the IgG molecule (16). Note that the apparent alignment in the Ab structure shown in Fig. 8B was somewhat coincidental and was not seen in Fig. 8A or other frames of images, suggesting that the IgG images obtained are not associated with tip artifacts. The images of native IgG molecules obtained by this technique are similar to those found with x-ray crystallography (17, 18) and transmission electron microscopy (TEM) (19). However, the apparent dimensions (≈12 × 9 nm) are significantly larger than those determined from x-ray crystallography (8.5 × 6 nm). This probably results from resolution limitations because of tip size, although the size found for a moist isolated molecule could differ from that found in crystals. Information in the z-axis direction is limited, because of the lack of a quantitative relation between the charge-transfer rate and the tip-sample distance for this system, but the approximate height of the molecule is 5 nm, which is somewhat higher than the TEM and x-ray data (≈4 nm).
Figure 8.
(A and B) Constant-current images showing several mouse monoclonal IgG molecules on mica substrates treated with phosphate buffer. The images were recorded with a W tip in humid air (80% RH at 25°C). The reference current was 1 pA at a tip bias of 1.5 V (vs. the Au contact). (C) Schematic of an IgG molecule showing two Fab arms and the Fc portion (16).
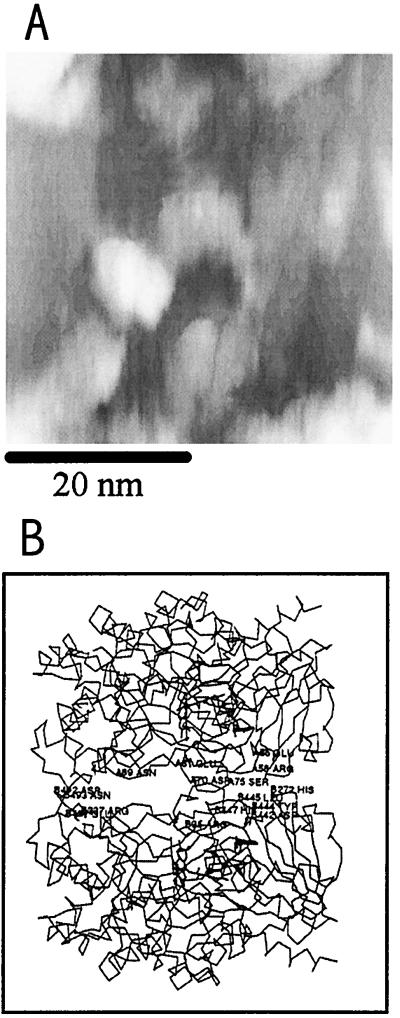
Fig. 9 shows the image of a group of GOD molecules on a mica surface at 81% RH. Most of them were of similar size. Some of the molecules show a dimeric structure, perhaps corresponding to the folded form of the two identical polypeptide chains of the GOD molecule. The monomeric unit is apparently a compact spheroid with dimensions of ≈8 × 4 nm. The top-view images of some of the molecules are observed as nearly circles with diameters of ca. 7 nm, which might represent the third dimension of the spheroidal monomeric unit. Contacts between two monomeric units forming the dimer are confined to a long, narrow stretch. The overall dimensions of the GOD molecules are thus ≈8 × 7 × 8 nm, which are significantly larger than those (6.0 × 5.2 × 7.7 nm) determined from x-ray crystallographic data on the partially deglycosylated enzyme (20).
Figure 9.
(A) Constant-current image showing several GOD molecules on mica substrates treated with phosphate buffer. The images were recorded with a W tip in humid air (80% RH at 25°C). The reference current was 1 pA at a tip bias of 1.5 V. (B) Cα tracing of the dimer structure of a GOD molecule (20). Contacts between molecules forming the dimer are confined to a long, narrow stretch.
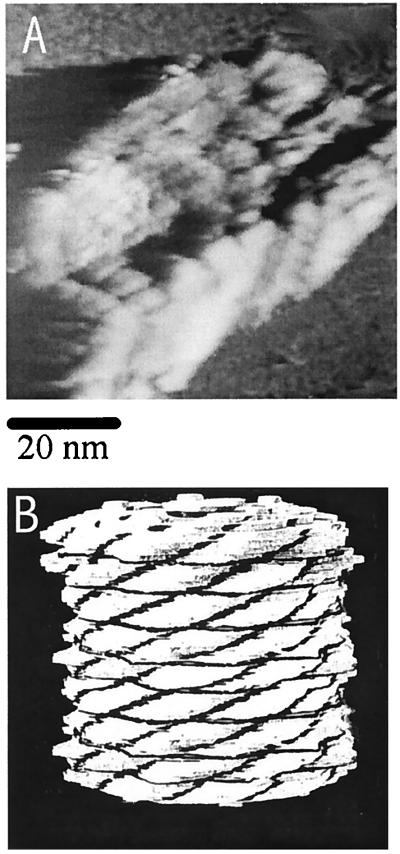
Finally, we chose KLH to investigate this imaging technique, because it is fairly large, and thus one can test the effect of the thickness of specimen. It also has a distinctive cylindrical profile with 6, 9, 12 … parallel rows, depending on the size of the molecule (21). Images of KLH molecules were taken at 65% RH with a W tip biased at 1.7 V, producing a reference current of 1 pA. Fig. 10A shows a cylindrical molecule with the suggestion of nine parallel sections. It has a rectangular profile with one dimension of 30–35 nm and the other dimension of 60–65 nm, which are close to those observed by TEM (21). The image does show some shadow artifacts on one side of the molecule opposite to the tip scan direction, perhaps the result of the tip–substrate interaction after the tip passes over the highest point. However, the shape of the molecule is similar to the model for the structure of a gastropod hemocyanin with six parallel rows proposed in 1972 by Mellema and Klug (22) based on a computer-processed three-dimensional reconstruction of the TEM data. The reconstructed image reported previously showed a hollow cylindrical molecule partly closed at both ends by a collar and possibly a central cap. The walls were made from 60 morphological units for a six-row species. Each morphological unit was of similar size, shape, and orientation and contained two oxygen-binding sites. An analogous Mellema and Klug model for a gastropod hemocyanin molecule with nine (instead of six) parallel rows is shown in Fig. 10B. This result suggests that a specimen thickness <10–20 nm may not pose serious limitations in this imaging technique as long as the surface water film provides an ion conductive path to the tip.
Figure 10.
(A) Constant-current image of a KLH molecule on a mica surface treated with phosphate buffer. The image was taken at 65% RH (25°C) with a W tip biased at 1.7 V with a reference current of 1 pA. (B) Analogous Mellema and Klug model (22) for a nine parallel-row Gastropod hemocyanin molecule.
Discussion
These results for DNA and several protein molecules on mica generally agree well with the findings reported previously and show that a very thin water film adsorbed on the surface plays an essential role in successful imaging. The conductance of the mica substrate/water film system depends strongly on not only the RH but also the surface treatment of the mica substrate. For example, the conductance of a bare mica surface can increase by at least five orders of magnitude as the RH is changed from <10% to 93%. It further increases by at least one order of magnitude at the same RH after the surface is treated with the TE buffer solution and rinsed. The enhanced conductance is attributed to the increased ion concentration in the thin electrolyte film on the mica substrate. The similarity between the observed RH dependence of the conductance and the water adsorption isotherm suggests that conductance is closely related to the amount of water adsorbed on the mica surface. The adsorption isotherm indicates initial weak interaction between water molecule and the mica surface followed by multilayer growth of water.
As summarized in Fig. 1, the EC signal observed at the tip could arise from both capacitive and faradaic processes. However, charging processes are transient and cannot account for a true steady-state direct current. Because the voltammetric curves are perturbed by resistive drops between the tip and Au contact, it is difficult to identify with certainty the nature of the faradaic processes at the tip. At W, candidate reactions are oxidation of water to O2 at high positive bias (and processes involving adsorbed species, e.g., oxidation of EDTA, azide, or adventitious impurities) and reduction of water or protons to H2, and reduction of dissolved O2 at negative tip bias. In addition to these processes, oxidation of the W to oxide (WO3) and, to a limited extent, reduction of native or electrochemically generated oxide at low bias region (to HxWO3−x) are possible. Note that the faradaic processes also generate ions that can contribute to the solution conductivity. At low bias, ions in the water layer also play an important role in establishing the double layers at both electrodes and provide charge compensation for electrogenerated species. They may also affect the hydrophilicity of the substrate surface and the thickness and structure of the water layer that forms on it. Because the conductance and capacitance, and hence the current, is highly sensitive to the distance as the tip approaches the mica substrate (see Fig. 6), it is possible, as predicted theoretically by Yuan et al. (23), to achieve nanometer resolution for the surface structures of many biological macromolecules with this mode of SECM. We should note that a previous report (24) also described “gas phase electrochemistry” in a thin film of liquid on an insulator surface, in agreement with the mechanism we have proposed.
The significantly larger estimated size of DNA and small protein molecules determined from images obtained by this technique as compared with other techniques (e.g., TEM) are probably because of the presence of water and salt around the molecules as well as the nonnegligible tip size, which limits the resolution. To obtain good resolution, as in other scanning probe techniques, the dimensions of the specimen should be large compared with the tip radius of curvature. It is also possible to deconvolute the images if one knows the exact tip shape and dimensions and the detailed mechanism of current feedback. One can also minimize the size deviation by optimizing the RH and the salt concentration to maintain an optimum water film thickness. Some distortions in the image may also be caused by deformation of the molecule by the tip during imaging, as frequently encountered in atomic force microscopic or STM images of biological samples (25–30). In spite of this discrepancy, the overall shapes of the DNA and protein molecules are well reproduced in this experiment and are similar to those determined from other more established techniques. These results give us confidence that this technique can reflect fairly accurately the native conformation of the DNA and protein molecules. They further indicate that a mica surface, which is atomically flat and can be easily modified chemically, is a suitable substrate for studying protein samples.
Conclusions
The images of biomacromolecules taken in humid air on a mica substrate demonstrate that the resolution can reach a few nanometers by this technique, although it is still not as high as that seen in STM of ordered conductive surfaces. Improved resolution should be possible by lowering the RH conditions to decrease the thickness of the water film but still keep the ionic conductivity of the mica substrate and the individual molecules high enough for detection. As stated above, the resolution is also a function of the exposed tip area, and perhaps this could be improved by treatment of the tip except at the very end with a hydrophobic agent to decrease the area above the contact point wet with water. The potential of this technique for high-resolution chemical imaging, as successfully applied in bulk liquid phase SECM studies, is very attractive. However, a better understanding and better control of the physical and chemical processes within the water film are needed. Moreover, to obtain high resolution routinely, improved detection sensitivity and the utilization of different feedback control techniques are also needed.
Acknowledgments
We thank Prof. B. L. Iverson and Dr. G. Chen for the generous donation of DNA and hemocyanin samples. We thank Drs. X.-H. Xu and C. Demaille for their helpful technique assistance, suggestions, and discussions. This work is supported by the Robert A. Welch Foundation and the National Science Foundation (CHE9870762).
Abbreviations
- EC
electrochemical
- SECM
scanning electrochemical microscope (or microscopy or microscopic)
- STM
scanning tunneling microscope (or microscopy or microscopic)
- KLH
keyhole limpet hemocyanin
- GOD
glucose oxidase
- RH
relative humidity
- TEM
transmission electron microscopy
References
- 1.Wickramasinghe H K, editor. Scanned Probe Microscopy, American Institute of Physics Conference Proceedings 241. New York: American Institute of Physics; 1992. [Google Scholar]
- 2.Bard A J, Fan F-R, Mirkin M V. In: Electroanalytical Chemistry. Bard A J, editor. Vol. 18. New York: Dekker; 1994. pp. 243–373. [Google Scholar]
- 3.Guckenberger R, Heim M, Ceve G, Knapp H, Wiegräbe W, Hillebrand A. Science. 1994;266:1538–1540. doi: 10.1126/science.7985024. [DOI] [PubMed] [Google Scholar]
- 4.Fan F-R F, Bard A J. Science. 1995;270:1849–1851. doi: 10.1126/science.270.5243.1849. [DOI] [PubMed] [Google Scholar]
- 5.Forouzan F, Bard A J. J Phys Chem. 1997;101:10876–10879. [Google Scholar]
- 6.Craston D H, Lin C W, Bard A J. J Electrochem Soc. 1988;135:785–786. [Google Scholar]
- 7.Hüsser O E, Craston D H, Bard A J. J Vac Sci Technol B. 1988;6:1873–1879. [Google Scholar]
- 8.Wuu Y-M, Fan F-R F, Bard A J. J Electrochem Soc. 1989;136:885–886. [Google Scholar]
- 9.McCarley R L, Hendricks S A, Bard A J. J Phys Chem. 1992;96:10089–10092. [Google Scholar]
- 10.Fan F-R F, Bard A J. J Electrochem Soc. 1989;136:3216–3222. [Google Scholar]
- 11.Dean J A, editor. Lange’s Handbook of Chemistry. 13th Ed. New York: McGraw–Hill; 1985. [Google Scholar]
- 12.Kirgintsev A N, Luk’yanov A V. Zh Neorg Khim. 1967;12:2032–2034. [Google Scholar]
- 13.Fan F-R F, Bard A J. J Electrochem Soc. 1981;128:945–952. [Google Scholar]
- 14.Fan F-R F, Bard A J. J Phys Chem. 1990;94:3761–3766. [Google Scholar]
- 15.Beaglehole D, Radlinska E Z, Ninham B W, Christenson H K. Phys Rev Lett. 1991;66:2084–2087. doi: 10.1103/PhysRevLett.66.2084. [DOI] [PubMed] [Google Scholar]
- 16.Burton D R. In: Molecular Genetics of Immunoglobulin. Calabi F, Neuberger M S, editors. Amsterdam: Elsevier; 1987. pp. 1–50. [Google Scholar]
- 17.Wells T N C, Stedman M, Leatherbarrow R J. Ultramicroscopy. 1992;42–44:1200–1203. doi: 10.1016/0304-3991(92)90424-i. [DOI] [PubMed] [Google Scholar]
- 18.Marquart M, Deisenhofer J, Huber R. J Mol Biol. 1980;141:369–391. doi: 10.1016/0022-2836(80)90252-1. [DOI] [PubMed] [Google Scholar]
- 19.Valentine R C, Green N M. J Mol Biol. 1967;27:615–617. doi: 10.1016/0022-2836(67)90063-0. [DOI] [PubMed] [Google Scholar]
- 20.Hecht H J, Kalisz H M, Hendle J, Schmid R D, Schomburg D. J Mol Biol. 1993;229:153–172. doi: 10.1006/jmbi.1993.1015. [DOI] [PubMed] [Google Scholar]
- 21.Van Bruggen E F J. In: Structure and Function of Invertebrate Respiratory Proteins. Wood E J, editor. London: Harwood; 1982. pp. 1–14. [Google Scholar]
- 22.Mellema J E, Klug A. Nature (London) 1972;239:146–150. doi: 10.1038/239146a0. [DOI] [PubMed] [Google Scholar]
- 23.Yuan J-Y, Shao Z, Gao C. Phys Rev Lett. 1991;67:863–866. doi: 10.1103/PhysRevLett.67.863. [DOI] [PubMed] [Google Scholar]
- 24.Fang Y, Leddy J. J Electroanal Chem. 1995;384:5–17. [Google Scholar]
- 25.Leatherbarrow R J, Stedman M, Wells T N C. J Mol Biol. 1991;221:361–365. doi: 10.1016/0022-2836(91)80056-z. [DOI] [PubMed] [Google Scholar]
- 26.Leggett G J, Davies M C, Jackson D E, Roberts C J, Tendler S J B, Williams P M. J Phys Chem. 1993;97:8852–8854. [Google Scholar]
- 27.Lin J N, Drake B, Lea A S, Hansma P K, Andrade J D. Langmuir. 1990;6:509–511. [Google Scholar]
- 28.Chi Q, Zhang J, Dong S, Wang E. J Chem Soc Faraday Trans. 1994;90:2057–2060. [Google Scholar]
- 29.Tang S L, McGhie A J. Langmuir. 1996;12:1088–1093. [Google Scholar]
- 30.Hansma H, Hoh J. Annu Rev Biophys Biomol Struct. 1994;23:115–139. doi: 10.1146/annurev.bb.23.060194.000555. [DOI] [PubMed] [Google Scholar]


