Abstract
We developed a technique for electrochemical detection of salivary mRNA employing a hairpin probe (HP). Steric hindrance (SH) suppresses unspecific signal and generates a signal-on amplification process for target detection. The stem-loop configuration brings the reporter end of the probe into close proximity with the surface and makes it unavailable for binding with the mediator. Target binding opens the hairpin structure of the probe, and the mediator can then bind to the accessible reporter. Horseradish peroxidase is utilized to generate electrochemical signal. This signal-on process is characterized by a low basal signal, a strong positive readout and a large dynamic range. The SH is controlled via hairpin design and electrical field. By applying electric field control to HPs, the limit of detection of RNA is about 0.4 fM, which is 10 000-fold more sensitive than conventional linear probes. Endogenous Interleukin-8 mRNA is detected with the HP, and good correlation with the quantitative PCR technique is obtained. The resultant process allows a simple setup and by reducing the number of steps it is suited for the point-of-care detection of specific nucleic acid sequences from complex body fluids such as saliva.
INTRODUCTION
Molecular analysis of body fluids provides the potential for early cancer detection and subsequent increased treatment efficacy (1–3). Molecular markers released from tumors find their way into blood and/or other body fluids, and specific detection of biomarkers may enable disease identification in a noninvasive and specific manner (4,5). Saliva is easily accessible in a noninvasive manner, and can be collected with less patient discomfort relative to blood. In addition, the levels of interfering material (cells, DNA, RNA and proteins) and inhibitory substances are lower and less complex in saliva than in blood. This advantage has recently been shown in a thorough study of oral cancer mRNA markers (6). mRNAs were identified through microarray and validated according to established guidelines (7) by quantitative PCR (qPCR). Detecting salivary mRNA biomarkers adds a new dimension to saliva as a valuable diagnostic fluid. In this study, we aimed to develop a unique methodology for on-site testing of salivary mRNA.
Electrochemistry is an excellent candidate for a point-of-care diagnostic method for RNA detection (8), not only because of its high sensitivity but also because of the simplicity of the instrument (9–13). However, due to the low concentration (∼fM) of salivary biomarkers and the complex background of saliva, conventional electrochemical amperometric detection methods do not meet the clinical diagnostic requirement of high signal-to-background ratio (SBR) for direct RNA detection in saliva.
Recently, Plaxco's group reported a novel method of applying redox-labeled hairpin probes (HPs) to enable oligonucleotide detection in various body fluids including serum and urine (14,15). This method successfully demonstrated the use of HPs as a switch between closed and open status during an electrochemical reaction. The results provided significant improvements in both sensitivity and specificity. In the context of saliva diagnostics, low copy-numbers of RNA biomarkers in saliva demand highly sensitive sensors to detect signal above background noise. Herein, we propose a method that couples an enzymatic amplification process with a target-induced conformational change based on an HP probe. This HP comprises a loop component with a sequence complementary to the target and a stem component labeled with a reporter at one end. Without target binding, the proximity to the sensor surface creates steric hindrance (SH), which inhibits signal amplification by preventing mediator access to the probe reporter label. This built-in SH is removed after the bio-recognition component verifies the target specificity, making the reporter label accessible to the mediator-peroxidase conjugate and generating a current signal. Therefore, only the specific target can generate an amplified current, even if present in low copy numbers and in a complex mixture. The SH effect is controllable in this HP-based electrochemical sensor by optimizing probe design and the surface electrical field. Our selective amplification method suppresses nonspecific signal to background levels, overcoming key hurdles in developing point-of-care nucleic acid detection systems for salivary RNA markers and for other general use.
MATERIALS AND METHODS
Oligonucleotide probes and RNA
HPLC-purified oligonucleotides were custom synthesized (Operon Inc., Alabama, USA). The probe sequence allowed for the formation of a hairpin structure. The loop and half of the hairpin stem (3′-end) contained target recognition sequences, and HPs were labeled with biotin

or biotin-(tetra-ethyleneglycol) TEG (the structure as shown above) on the 5′-end and with fluorescein on the 3′-end (detailed structures are shown in Supplementary materials I). The biotin label bound to streptavidin as an anchor to the chip surface, and the fluorescein label allowed for binding of the signal mediator. We investigated the following configurations of the 5′-linker from the probe to the chip surface: biotin link, biotin-TEG, biotin-9 thymidines (T9) and biotin-TEG-T9. Biotin-TEG had an extra spacer with mixed polarity based on triethylene glycol containing oxygen atoms connecting the biotin and the oligo chain. Different spacing designs may confer better accessibility of the biotin to the streptavidin, and could serve as an adjustable length linker for the SH effect.
Interleukin-8 (IL-8) mRNA (NM_000584) (16) has been proposed as a salivary biomarker for oral cancer and was selected for detection. For the purpose of establishing the validity of the method, in vitro transcribed (IVT) IL-8 RNAs were used as a target for standard quantitative measurements. Details of IVT RNA generation are described in the Supplementary materials II section. Endogenous mRNAs were detected from clinical samples. For detecting endogenous IL-8 from saliva samples, a lysis process was carried out by mixing the saliva 1:1 with AVL viral lysis buffer (QIAGEN, California, USA) for 15 min at room temperature. Details of saliva collection and qPCR measurements are described in the Supplementary materials III-IX.
Surface preparation
The surface preparation of the gold electrochemical sensor was performed as follows (17,18):
Probe immobilization
The gold electrodes were precoated with a self-assembled monolayer of mercaptoundecanoic acid (MUDA), terminated by a carboxyl group (18). The gold surface was activated by a 4 μl mixture of 50% 1-ethyl-3-(3-dimethylaminopropyl) carbodiimide hydrochloride (EDC, Biacore Inc., New Jersey, USA) and 50% N-hydroxysuccinimide (NHS) (Biacore) for 10 min. The sensors were rinsed with DI water (18.3 MΩ cm) and dried with nitrogen gas. A total of 4 μl of 5 mg/ml amine-PEO2-Biotin labeling reagent (Ez-Biotin) (Pierce Inc., Illinois, USA) was loaded to the gold surface, followed by rinsing and drying. Ethanolamine-HCl (1.0 M, pH 8.5, Biacore) was loaded for inactivation of the un-reacted EDC/NHS activated surface. Next, 0.5 mg/ml streptavidin (VWR Corp., California, USA) in PBS (pH 7.2, Invitrogen, California, USA) was incubated on the electrode for 10 min to produce streptavidin-coated electrodes. A total of 4 μl of 5′-biotinylated and 3′-fluorescein dual-labeled HP in Tris-HCl buffer (pH 7.5, Invitrogen, California, USA) was immobilized onto the electrodes for 30 min via the interactions between streptavidin on the surfaces and the biotin label on the probes. The surface density of the oligo probe achieved using this immobilization strategy was reported to be ∼3.4 × 10¹² molecules/cm2 (19). Excessive HP was removed by a thorough rinse with DI water and dried with nitrogen gas.
Target hybridization
The surface was incubated for 5 min with the target-containing sample prepared in 6 × saline-sodium citrate buffer (6 × SSC, 0.09 M sodium citrate, with 0.9 M NaCl, pH 7.0, Invitrogen, California, USA) with the addition of 10 mM MgCl2 (Sigma Corp., Missouri, USA). During hybridization, a cyclic square-wave electric field was applied at 30 cycles of +200 mV for 1 s and −300 mV for 9 s. After hybridization, the electrodes were rinsed with DI water and dried with nitrogen gas.
Electrochemical detection
The electrochemical readout was performed using an electrochemical workstation according to the manufacturer's instructions. Briefly, anti-fluorescein-Horseradish peroxidase (HRP) (Roche, Indiana, USA) diluted in PBS with 0.5% casein blocking buffer (Blocker Casein in PBS, Pierce, pH 7.4) was added to the fluorescein label on the HP or the detector probes. Then, 3, 3′, 5, 5′ tetramethylbenzidine low activity (TMB/H2O2, Neogen Corp., Kentucky, USA) substrate was loaded, and amperometric detection was carried out by applying −200 mV potential versus gold to each electrode unit, followed by parallel signal read-out after 60 s of equilibration (17,18).
The electrochemical sensor was a 16-unit gold array. For each unit, there were three electrodes including the working electrode (WE), counter electrode (CE) and reference electrode (RE) (18). The RE was determined to be +218 mV versus SCE by measuring cyclic voltammetric curves of 0.1 mM [Fe(CN)6]3-/4-. All electric potentials described in this report are in reference to the gold RE (+218 mV versus SCE). The advantages of this small electrode array are that the signal read-out of the 16 electrodes can be obtained simultaneously, and only 4 μl of sample solution is needed for detection. In our experiments, the electrochemical signal was the current generated by the redox of the HRP reporter enzyme. TMB continually regenerated reduced HRP via a 2-electron step, which amplified the current signal. The current was proportional to the surface concentration of hybridized target (18). All experiments were performed at room temperature.
RESULTS AND DISCUSSION
Hairpin-induced specific amplification
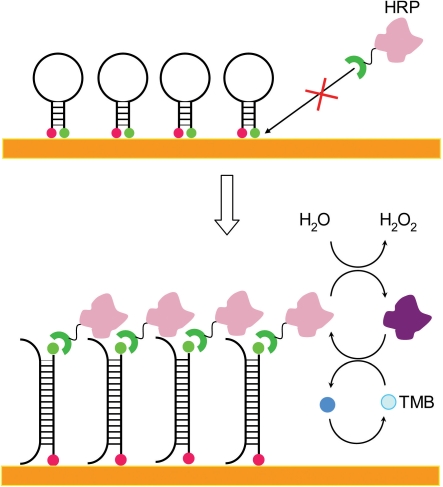
Detection of a specific target using the current approach was accomplished via a combination of sandwich-like signal amplification by HRP and TMB/H2O2 as well as selective hybridization by the HP design. This method was based on the SH effect: the surface near the HP inhibits the HRP conjugate binding to target-free probes. Therefore, the distance between the surface and reporter label on the probe was a key factor to the detection process. Upon target binding, the HP opened and the reporter was away from the surface, resulting in reduced restriction from the surface. Conjugated HRP bound to the fluorescein and generated current, constituting a signal-on process (Figure 1).
Figure 1.
Illustration of the specific signal amplification in HP electrochemical detection. When no target bound to the probe, the hairpin was closed. HRP could not form an effective complex and no signal was observed. After hybridization with target, the hairpin opened up and the HRP complex was formed. TMB regenerated the reactive HRP, thus amplifying the current signal.
We compared four IL-8 specific HPs with and without 5′-linkers, which exhibited different levels of SH due to varying distances between the reporters and the electrode surface (Table 1). The length and flexibility of linkers were adjusted by the length of the TEG or an overhang spacer (T9) at the 5′-biotin labeled end. The longitudinal size of biotin-TEG was approximately 3 nm from molecular mechanics calculations (MM2) (20). Single stranded DNA was in a coiled state on the electrode when no force was applied. The coil was probably stretched to permit conjugate binding when the electrochemical detection was carried out at negative potential (21,22). Although the exact length of the T9 linker is not known, it was likely >3 nm under the negative potential, if duplex DNA is 9 bp × 0.28 nm/bp. The size of HRP is approximately 4 × 6.7 × 11.8 nm, according to protein crystal data (23).
Table 1.
Oligonucleotide sequences for IL-8 and S100A8
| Designation | Sequence (5′ to 3′) | 5′-label | 3′-label |
|---|---|---|---|
| IL-8 HPL0a,b | GAG GGT TGC TCA GCC CTC TTC AAA AAC TTC TCC ACA ACC CTC | Biotin | Fluorescein |
| IL-8 HPL1a,b | GAG GGT TGC TCA GCC CTC TTC AAA AAC TTC TCC ACA ACC CTC | BiotinTEG | Fluorescein |
| IL-8 HPL2a,b | TTT TTT TTT GAG GGT TGC TCA GCC CTC TTC AAA AAC TTC TCC ACA ACC CTC | Biotin | Fluorescein |
| IL-8 HPL3a,b | TTT TTT TTT GAG GGT TGC TCA GCC CTC TTC AAA AAC TTC TCC ACA ACC CTC | BiotinTEG | Fluorescein |
| IL-8 CPc | TTT TTT TAT GAA TTC TCA GCC CTC | Biotin | – |
| IL-8 DPc | TTC AAA AAC TTC TCC ACA ACC CTC | – | Fluorescein |
| IL-8 HPa,b | GAG GGT TGC TCA GCC CTC TTC AAA AAC TTC TCC ACA ACC CTC | Biotin | Fluorescein |
| S100A8 HPa,b | GTG TCC TCT TTG AAC CAG ACG TCT GCA CCC TTT TTC CTG ATA TAC TGA GGA CAC | Biotin | Fluorescein |
bThe target recognition sequences are listed in italic font. The stem sections of the hairpins are underlined.
cIL-8 CP is the capture probe with biotin label in dual probes detection. IL-8 DP is the detect probe with fluorescein label in dual probes detection.
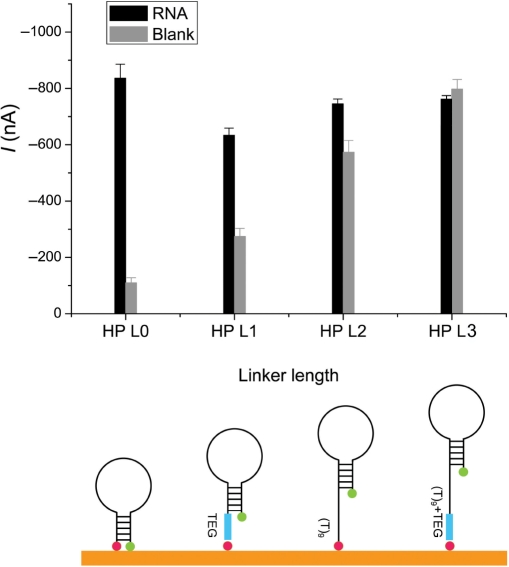
Figure 2 shows the SH effects from different HP designs. For the probe with the longest linker (TEG−T9), the fluorescein was far away from the surface even when the hairpin was closed. The mediator complex was formed and SH effect was very small. Hybridization to the target only increased the distance of the HRP complex from the electrodes. Therefore, the signal decreased upon binding and recognition resulted in a very weak signal-off process (Figure 2). Signals with bound target were at similar levels for all four probes and the blank signal decreased with decreasing linker length. For the HP without a linker, the reporter was very close to the surface in the closed state. Therefore, the SH effect was very strong, and the lowest background was observed (SBR=8 : 1).
Figure 2.
Comparison of IL-8 HPs with different linker lengths. The HP sequences for IL-8 are listed in Table 1 as IL-8 HPL0, IL-8 HPL1, IL-8 HPL2 and IL-8 HPL3. The hairpin was closed in the blank control and opened after hybridization with RNA. The concentration of IL-8 RNA was 5 nM. The mean and SD of four experiments are shown. The configurations of the HPs with different linker length are shown schematically.
Specificity
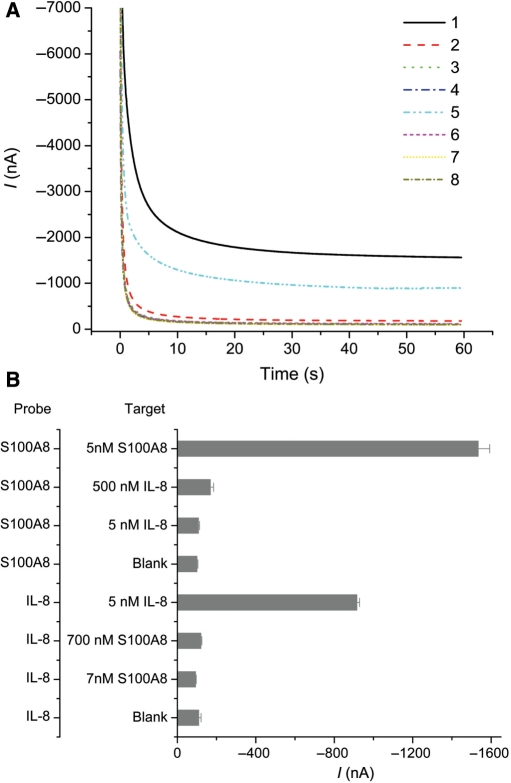
The specificity of HP without a linker was tested with cross-detection of two targets, and the results are shown in Figure 3. As a reference control, we used the mRNA for S100 calcium-binding protein A8 (S100A8 mRNA, NM_002964), which is highly expressed in saliva and has no oral cancer relevance. For each probe, a comparison between the complementary and noncomplementary IVT RNA target was carried out at concentrations of 5 nM and 500 nM for IL-8, and 7 nM and 700 nM for S100A8. Even noncomplementary targets that were over-expressed by 100-fold gave little signal increase for the IL-8- and S100A8-specific probes. Complementary target signals were >20 SDs (SDV) higher than the blank control. Both probes showed good RNA discrimination for 5 nM of IL-8 and 7 nM of S100A8.
Figure 3.
Cross-detection with two sets of IVT RNA applying HP: IL-8 and S100A8. (A) The amperometric signals for eight samples. (1)–(4) applied HPs for S100A8 and the targeting RNA were (1) 7 nM S100A8, (2) 500 nM IL-8, (3) 5 nM IL-8 and (4) buffer only, respectively. (5)–(8) used HPs for IL-8, and the targeting RNA were (5) 5 nM IL-8, (6) 700 nM S100A8, (7) 7 nM S100A8 and (8) buffer only, respectively. (B) Bar charts of the same eight samples in (A). The sequences for HPs are listed in Table 1 as IL-8 HP and S100A8 HP. Mean and SD of four individual experiments are shown.
Control of SBR with hybridization efficiency
A major concern of the RNA sensor is the SBR. In the current HP designs, the SBR depended on the ratio of the numbers with an open or closed HP. Background levels were associated with the closed state when no specific target was bound, and signal was generated from the open state after target hybridization. These closed or open states during recognition required high efficiencies for both the intramolecular and intermolecular hybridization.
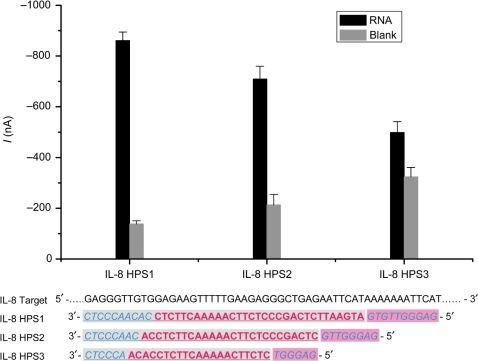
To increase hybridization efficiency and optimize the SBR of this sensor, we modified the hairpin structure by changing both the stem and loop length. Three HPs with different stem–loop lengths were studied (sequences listed in Table 2). In all three probes, the 3′-end stem component was complementary to the target RNA, together with the loop. The probe with the short stem (6 bp) and the duplex (21 + 6 bp) had a high background and low signal (HPS3 in Figure 4). The probe with the longest stem (10 bp) and the duplex (10 + 31 bp) had the lowest blank signal and the highest signal for target (HPS1), indicating a better closed state when no target was bound and a better open state when hybridized with target. Complementary HP sequences included both the whole loop and half of the stem, providing lower free energy after target hybridization. Thus, once target was bound to the loop, even the very long stem could be opened due to its complementary sequence to the target. Since high hybridization efficiency benefits both the sensitivity and specificity, a good SBR was achieved. In contrast, it is difficult to determine the optimized probe sequence with the traditional linear probe (LP) (24). The long sequence was beneficial to the hybridization efficiency, but generates high background.
Table 2.
Oligonucleotide sequences for IL-8 HP with different stem-loop structures
| Designation | Sequence (5′ to 3′) | Stem (bp) | Loop (nt) | Duplex (bp) |
|---|---|---|---|---|
| IL-8 HPS1a,b,c | GAG GGT TGT GAT GAA TTC TCA GCC CTC TTC AAA AAC TTC TCC ACA ACC CTC | 10 | 31 | 41 |
| IL-8 HPS2a,b,c | GAG GGT TGC TCA GCC CTC TTC AAA AAC TTC TCC ACA ACC CTC | 8 | 26 | 34 |
| IL-8 HPS3a,b,c | GAG GGT CTC TTC AAA AAC TTC TCC ACA ACC CTC | 6 | 21 | 27 |
Figure 4.
Comparison of IL-8 HPs with different stem-loop designs. The sequences of three HPs are listed in Table 2 as IL-8 HPS1, IL-8 HPS2 and IL-8 HPS3. The hairpin was closed in the blank control and opened after hybridizing with the RNA. The underlined sequences were complementary to the target RNA. Sequences in italics indicate the stem and sequences in bold form the loop. HPS1: 10 bp in the stem and 41 bp in the duplex; HPS2: 8 bp in the stem and 34 bp in the duplex; HPS3: 6 bp in the stem and 27 bp in the duplex. The concentration of IL-8 RNA was 5 nM. The mean and SD of four experiments are shown.
Detection of spiked RNA in saliva
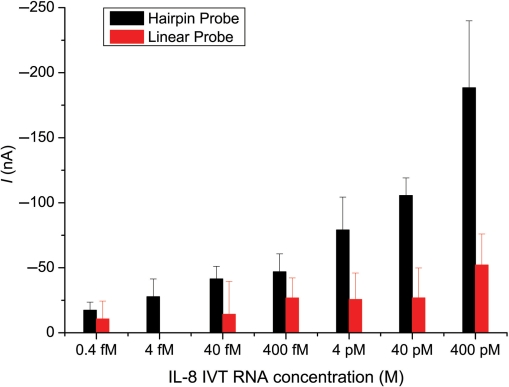
With proper HP design and cooperation from the SH effect, we can detect salivary RNA biomarker sequences over a wide dynamic range of target concentration. Figure 5 shows the relationship between the concentration and the current signal in buffer. For comparison, the original system with two LPs for each target was also examined, using previously published methods (24). Briefly, both probes were designed to be complementary to adjacent stretches of the target sequence. The ‘capture probe’ was immobilized on the electrode with a 5′-end biotin label. The ‘detector probe’ had a 3′-fluorescein label to bind with the anti-fluorescein-HRP. Our results show that good SBR for detecting IL-8 was obtained with HP, but poorer performance was seen with LP.
Figure 5.
Salivary IL-8 RNA detection by the LP and HP. LPs were IL-8 CP and IL-8 DP, and HP was IL-8 HP as listed in Table 1. Blank control signals were subtracted from the measured signals. Mean and SD of four experiments are shown. The data point of the 4 fM target for LP is not displayed, because its value was below that of the blank control.
We defined the limit of detection (LOD) as the concentration with a signal of at least 2 SDV above the background level. According to the criteria, the LOD for HP was about 0.4 fM. For the LPs, the LOD of IL-8 was about 400 pM, which is about 10 000-fold higher than for the HP (Figure 5).
Detection of endogenous mRNA in saliva
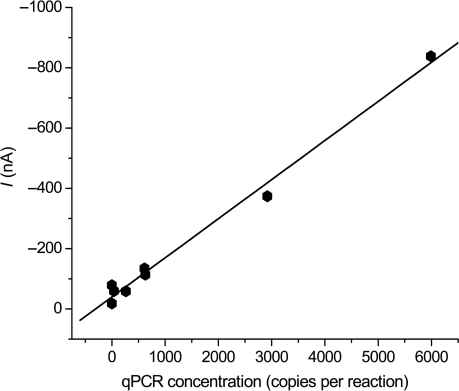
We then proceeded to detect endogenous IL-8 mRNA in saliva samples. Changes in signal levels between different saliva samples were observed. IL-8 mRNA in eight clinical saliva samples were measured using the present optimized HP design. Since endogenous mRNA in saliva is combined with other macromolecules which mask detection, a lysis procedure was carried out before the electrochemical assay to release masked RNA. We observed a good correlation between the electrochemical signals for saliva samples and the qPCR results, as shown in Figure 6. Higher electrochemical signals were observed in the saliva samples containing a higher level of IL-8 mRNAs as determined by qPCR measurement. In addition to the PCR measurement, these results support the existence of mRNA in saliva. Our results also show that endogenous mRNA can be detected in saliva by an electrochemical method without PCR amplification, which meets the sensitivity requirement for point-of-care salivary diagnostics.
Figure 6.
Correlation between amperometric signals using HP and concentrations determined by qPCR of IL-8 mRNA for the same set of clinical saliva samples. The R2 for linear regression was 0.99.
For detection of DNA oligonucleotides using various electrochemistry-associated methods, LOD in the fM range have been achieved. These methods include nano-particle-linked secondary probes (25), anodic stripping voltammetry of silver nanoparticles deposited in a multi-step reduction process (26) and electronic DNA sensors based on target-induced strand displacement mechanisms (15). mRNA has a longer sequence and more complicated secondary structure than oligos. To capture specific mRNA targets, a characteristic fragment of mRNA must be chosen carefully. Secondary mRNA structure may reduce hybridization between the capture probe and the target. In this study, we chose the mRNA fragment with minimal secondary structure, as calculated by the Mfold web server (27). Probe design also required thorough consideration of loop sequence, stem length and probe secondary structure. Considering the intrinsic 2D or 3D structure of the RNA, the following principles were applied for both linear and HP design:
Affinity of probe to the target mRNA: mRNA secondary structure and secondary structure of probe sequences which are complimentary to the target RNA, including quadruplex and hairpin, were considered. Sequences without stable secondary structures were selected based on quadruplex and M-fold calculations. Formation of self-dimers and hybridization stability also were considered based on thermodynamic calculations.
For optimal HP performance, half of the stem (3′-end), together with the loop was designed to be complementary to the target RNA. Since the 5′-end of the stem was immobilized onto the surface via biotin-streptavidin for all the HPs in this study, only the 3′-stem was free during the hybridization process. Sharing the 3′-end of the stem with the loop for duplex formation resulted in higher hybridization efficiency and more changes in the SH effect.
In summary, we developed an effective method for electrochemical detection of mRNA using HP with high sensitivity, high specificity and a large dynamic range (fM–nM in buffer system and spiked saliva). We also demonstrated that this technique works well for directly detecting endogenous mRNA without the need for PCR amplification.
SUPPLEMENTARY DATA
Supplementary Data are available at NAR Online.
ACKNOWLEDGEMENTS
This work was supported by funds from the National Institutes of Health/National Institute of Dental and Craniofacial Research (UO1DE 017790, UO1DE015018 and RO1DE017593) and the National Aeronautics and Space Administration/National Space Biomedical Research Institute (TD00406). We appreciate the help of Dr Jia Ming Chen in editing the paper. Funding to pay the Open Access publication charges for this article was provided by a grant from NIH NIDCR.
Conflict of interest statement. None declared.
REFERENCES
- 1.Mandel ID. The diagnostic uses of saliva. J. Oral Pathol. Med. 1990;19:119–125. doi: 10.1111/j.1600-0714.1990.tb00809.x. [DOI] [PubMed] [Google Scholar]
- 2.Mandel ID. Salivary diagnosis - more than a lick and a promise. J. Am. Dent. Assoc. 1993;124:85–87. doi: 10.14219/jada.archive.1993.0007. [DOI] [PubMed] [Google Scholar]
- 3.Wong DT. Salivary diagnostics powered by nanotechnologies, proteomics and genomics. J. Am. Dent. Assoc. 2006;137:313–321. doi: 10.14219/jada.archive.2006.0180. [DOI] [PubMed] [Google Scholar]
- 4.Gormally E, Vineis P, Matullo G, Veglia F, Caboux E, Le Roux E, Peluso M, Garte S, Guarrera S, Munnia A, et al. TP53 and KRAS2 mutations in plasma DNA of healthy subjects and subsequent cancer occurrence: a prospective study. Cancer Res. 2006;66:6871–6876. doi: 10.1158/0008-5472.CAN-05-4556. [DOI] [PubMed] [Google Scholar]
- 5.Herr AE, Hatch AV, Throckmorton DJ, Tran HM, Brennan JS, Giannobile WV, Singh AK. Microfluidic immunoassays as rapid saliva-based clinical diagnostics. Proc. Natl Acad. Sci. USA. 2007;104:5268–5273. doi: 10.1073/pnas.0607254104. [DOI] [PMC free article] [PubMed] [Google Scholar]
- 6.Li Y, St John M.AR, Zhou XF, Kim Y, Sinha U, Jordan R.CK, Eisele D, Abemayor E, Elashoff D, Park NH, et al. Salivary transcriptome diagnostics for oral cancer detection. Clin. Cancer Res. 2004;10:8442–8450. doi: 10.1158/1078-0432.CCR-04-1167. [DOI] [PubMed] [Google Scholar]
- 7.Pepe MS, Etzioni R, Feng ZD, Potter JD, Thompson ML, Thornquist M, Winget M, Yasui Y. Phases of biomarker development for early detection of cancer. J. Natl. Cancer Inst. 2001;93:1054–1061. doi: 10.1093/jnci/93.14.1054. [DOI] [PubMed] [Google Scholar]
- 8.Hahn S, Mergenthaler S, Zimmermann B, Holzgreve W. Nucleic acid based biosensors: the desires of the user. Bioelectrochemistry. 2005;67:151–154. doi: 10.1016/j.bioelechem.2004.07.006. [DOI] [PubMed] [Google Scholar]
- 9.Liao W, Cui XT. Reagentless aptamer based impedance biosensor for monitoring a neuro-inflammatory cytokine PDGF. Biosens. Bioelectron. 2007;23:218–224. doi: 10.1016/j.bios.2007.04.004. [DOI] [PubMed] [Google Scholar]
- 10.Wei F, Chen CL, Zhai L, Zhang N, Zhao XS. Recognition of single nucleotide polymorphisms using scanning potential hairpin denaturation. J. Am. Chem. Soc. 2005;127:5306–5307. doi: 10.1021/ja043661v. [DOI] [PubMed] [Google Scholar]
- 11.Wei F, Qu P, Zhai L, Chen CL, Wang HF, Zhao XS. Electric potential induced dissociation of hybridized DNA with hairpin motif immobilized on silicon surface. Langmuir. 2006;22:6280–6285. doi: 10.1021/la060602h. [DOI] [PubMed] [Google Scholar]
- 12.Wei F, Sun B, Guo Y, Zhao XS. Monitoring DNA hybridization on alkyl modified silicon surface through capacitance measurement. Biosens. Bioelectron. 2003;18:1157–1163. doi: 10.1016/s0956-5663(03)00002-2. [DOI] [PubMed] [Google Scholar]
- 13.Wei F, Sun B, Liao W, Ouyang JH, Zhao XS. Achieving differentiation of single-base mutations through hairpin oligonucleotide and electric potential control. Biosens. Bioelectron. 2003;18:1149–1155. doi: 10.1016/s0956-5663(02)00249-x. [DOI] [PubMed] [Google Scholar]
- 14.Lubin AA, Lai RY, Baker BR, Heeger AJ, Plaxco KW. Sequence-specific, electronic detection of oligonucleotides in blood, soil, and foodstuffs with the reagentless, reusable E-DNA sensor. Anal. Chem. 2006;78:5671–5677. doi: 10.1021/ac0601819. [DOI] [PubMed] [Google Scholar]
- 15.Xiao Y, Lubin AA, Baker BR, Plaxco KW, Heeger AJ. Single-step electronic detection of femtomolar DNA by target-induced strand displacement in an electrode-bound duplex. Proc. Natl Acad. Sci. USA. 2006;103:16677–16680. doi: 10.1073/pnas.0607693103. [DOI] [PMC free article] [PubMed] [Google Scholar]
- 16.St John MAR, Li Y, Zhou XF, Denny P, Ho CM, Montemagno C, Shi WY, Qi FX, Wu B, Sinha U, et al. Interleukin 6 and interleukin 8 as potential biomarkers for oral cavity and oropharyngeal squamous cell carcinoma. Arch. Otolaryngol. Head Neck Surg. 2004;130:929–935. doi: 10.1001/archotol.130.8.929. [DOI] [PubMed] [Google Scholar]
- 17.Gau JJ, Lan EH, Dunn B, Ho CM, Woo J.CS. A MEMS based amperometric detector for E-Coli bacteria using self-assembled monolayers. Biosens. Bioelectron. 2001;16:745–755. doi: 10.1016/s0956-5663(01)00216-0. [DOI] [PubMed] [Google Scholar]
- 18.Gau V, Ma SC, Wang H, Tsukuda J, Kibler J, Haake DA. Electrochemical molecular analysis without nucleic acid amplification. Methods. 2005;37:73–83. doi: 10.1016/j.ymeth.2005.05.008. [DOI] [PMC free article] [PubMed] [Google Scholar]
- 19.Su XD, Wu YJ, Robelek R, Knoll W. Surface plasmon resonance spectroscopy and quartz crystal microbalance study of streptavidin film structure effects on biotinylated DNA assembly and target DNA hybridization. Langmuir. 2005;21:348–353. doi: 10.1021/la047997u. [DOI] [PubMed] [Google Scholar]
- 20.Allinger NL. Conformational-analysis.130. Mm2 - hydrocarbon force-field utilizing V1 and V2 Torsional Terms. J. Am. Chem. Soc. 1977;99:8127–8134. [Google Scholar]
- 21.Rant U, Arinaga K, Tornow M, Kim YW, Netz RR, Fujita S, Yokoyama N, Abstreiter G. Dissimilar kinetic behavior of electrically manipulated single- and double-stranded DNA tethered to a gold surface. Biophys. J. 2006;90:3666–3671. doi: 10.1529/biophysj.105.078857. [DOI] [PMC free article] [PubMed] [Google Scholar]
- 22.van Oijen AM, Blainey PC, Crampton DJ, Richardson CC, Ellenberger T, Xie XS. Single-molecule kinetics of lambda exonuclease reveal base dependence and dynamic disorder. Science. 2003;301:1235–1238. doi: 10.1126/science.1084387. [DOI] [PubMed] [Google Scholar]
- 23.Berglund GI, Carlsson GH, Smith AT, Szoke H, Henriksen A, Hajdu J. The catalytic pathway of horseradish peroxidase at high resolution. Nature. 2002;417:463–468. doi: 10.1038/417463a. [DOI] [PubMed] [Google Scholar]
- 24.Liao JC, Mastali M, Gau V, Suchard MA, Moller AK, Bruckner DA, Babbitt JT, Li Y, Gornbein J, Landaw EM, et al. Use of electrochemical DNA biosensors for rapid molecular identification of uropathogens in clinical urine specimens. J. Clin. Microbiol. 2006;44:561–570. doi: 10.1128/JCM.44.2.561-570.2006. [DOI] [PMC free article] [PubMed] [Google Scholar]
- 25.Park SJ, Taton TA, Mirkin CA. Array-based electrical detection of DNA with nanoparticle probes. Science. 2002;295:1503–1506. doi: 10.1126/science.1067003. [DOI] [PubMed] [Google Scholar]
- 26.Hwang S, Kim E, Kwak J. Electrochemical detection of DNA hybridization using biometallization. Anal. Chem. 2005;77:579–584. doi: 10.1021/ac048778g. [DOI] [PubMed] [Google Scholar]
- 27.Zuker M. Mfold web server for nucleic acid folding and hybridization prediction. Nucleic Acids Res. 2003;31:3406–3415. doi: 10.1093/nar/gkg595. [DOI] [PMC free article] [PubMed] [Google Scholar]
- 28.SantaLucia J. A unified view of polymer, dumbbell, and oligonucleotide DNA nearest-neighbor thermodynamics. Proc. Natl Acad. Sci. USA. 1998;95:1460–1465. doi: 10.1073/pnas.95.4.1460. [DOI] [PMC free article] [PubMed] [Google Scholar]
Associated Data
This section collects any data citations, data availability statements, or supplementary materials included in this article.


