Abstract
The aim of this study was to relate the pitch of high-rate electrical stimulation delivered to individual cochlear implant electrodes to electrode insertion depth and insertion angle. The patient (CH1) was able to provide pitch matches between electric and acoustic stimulation because he had auditory thresholds in his nonimplanted ear ranging between 30 and 60 dB HL over the range, 250 Hz to 8 kHz. Electrode depth and insertion angle were measured from high-resolution computed tomography (CT) scans of the patient’s temporal bones. The scans were used to create a 3D image volume reconstruction of the cochlea, which allowed visualization of electrode position within the scala. The method of limits was used to establish pitch matches between acoustic pure tones and electric stimulation (a 1,652-pps, unmodulated, pulse train). The pitch matching data demonstrated that, for insertion angles of greater than 450 degrees or greater than approximately 20 mm insertion depth, pitch saturated at approximately 420 Hz. From 20 to 15 mm insertion depth pitch estimates were about one-half octave lower than the Greenwood function. From 13 to 3 mm insertion depth the pitch estimates were approximately one octave lower than the Greenwood function. The pitch match for an electrode only 3.4 mm into the cochlea was 3,447 Hz. These data are consistent with other reports, e.g., Boëx et al. (2006), of a frequency-to-place map for the electrically stimulated cochlea in which perceived pitches for stimulation on individual electrodes are significantly lower than those predicted by the Greenwood function for stimulation at the level of the hair cell.
Keywords: CT, 3D image reconstruction
It is reasonable to suppose that energy in the input signal should be directed to the correct place in the electrically stimulated cochlea if patients fit with a cochlear implant are to achieve a high level of speech and music recognition. If this does not happen, then frequencies in the input signal, e.g. formants, will be misrepresented. A misrepresentation of frequency, depending on severity, should cause (1) difficulties in adapting to electrical stimulation, (2) a low asymptote for performance, or (3) both (see, for example, Skinner et al. 1995; Dorman et al. 1997; Fu and Shannon 1999a, b; Fu et al. 2002; Dorman and Ketten 2003; Rosen et al. 1999).
Creating an appropriate input-frequency to place-of-stimulation map (a frequency-place map, for short) for a given patient is not a trivial undertaking. Standard frequency-place maps, e.g., those generated by Greenwood (1990), assume stimulation at the level of the hair cell. However, hair cells are usually absent in implant patients after conventional implant surgery. The remaining neural targets, dendrites and cell bodies in the spiral ganglion, do not have the same relationship to distance along the cochlear partition as hair cells (Kawano et al. 1996; Sridhar et al. 2006). Thus, the Greenwood frequency-place (or frequency to distance along the cochlea) map is not likely to be appropriate for cochlear implant patients.
The creation of an alternative map to the Greenwood map for implant patients requires the examination of patients who have acoustic hearing over a wide range of frequencies in one ear and a cochlear implant in the other ear. Because patients with normal or near-normal hearing in one ear are not generally eligible for a cochlear implant, there are very few opportunities to obtain information about an electrical frequency-to-place map.
When the prototype for the Ineraid cochlear implant was first evaluated by research volunteers, Eddington et al. (1978) tested a unilaterally deaf patient. Electrical stimulation was directed to electrodes inserted 19 and 25 mm from the round window. Eddington et al. found that the acoustic-to-electric pitch matches were similar to those expected from the Greenwood frequency-place map. However, other studies have not had a similar outcome.
Blamey et al. (1996) tested 13 patients fit with the Nucleus 22 implant who had measurable, but very poor (thresholds between 85 dB at 250 Hz to 109 dB at 4 kHz) hearing in the nonimplanted ear. The most common outcome was acoustic to electric pitch matches that were far lower than predicted by the Greenwood function. A similar outcome was obtained by James et al. (2001).
Boëx et al. (2006) tested six patients fit with Clarion implant systems who, most generally, had better hearing thresholds in the nonimplanted ear than the patients in Blamey et al. (1996) and James et al. (2001). For example, patient H70 had a 0 dB HL threshold at 250 Hz and a 45-dB HL threshold at 4 kHz. Thus, the pitch matching data from this patient population were less compromised than the data from previous studies by hearing loss and associated, abnormal cochlear function in the nonimplanted ear. When frequency-place maps were constructed using distance from the round window as a metric, then acoustic matches to electrical stimulation were lower than predicted by the Greenwood function by one to more than two octaves. When maps were constructed using insertion angle as the metric, most matches were approximately one octave lower than predicted by the Greenwood function. The common finding from all of the studies reviewed above was a pitch match that was lower than predicted by the Greenwood function for stimulation of hair cells.
We have conducted acoustic-to-electric pitch matching experiments with a patient (CH1) whose hearing in his nonimplanted ear improved significantly after surgery for a cochlear implant. At issue in this report is whether patient CH1’s pitch matches are similar to the pitch matches shown by patients tested previously, i.e., an octave or more lower than predicted by the Greenwood equation for stimulation of hair cells.
METHODS
Subject
The patient was a 57-year-old male who had a 13-year history of hearing loss. In 1993 he had a sudden, profound sensorineural hearing loss in his right ear. He was evaluated 10 years later because of decreased hearing in his left ear. Hearing levels were poorer than 90 dB HL in the right ear and between 40–75 dB HL in the left ear; the losses in both ears were sensorineural. Hearing was evaluated four times over a 15-month period; the right ear remained stable while the left ear fluctuated between a mild-to-moderate and moderate-to-severe sensorineural hearing loss. Etiology for the left ear was a probable Meniere-like autoimmune disorder.
The right ear was implanted with a MedEl Combi 40+ cochlear implant in 2004. The surgeon reported a full insertion of the electrode array. At hookup the patient reported nonauditory stimulation with electrode 12. As a consequence the device was programmed with 11 active electrodes.
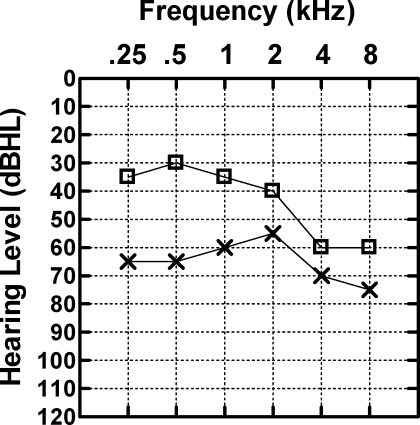
Fifteen months after device hookup, the patient entered a research study of amplification for the nonimplanted ear. The left ear was reevaluated and thresholds were found to be within the mild-to-moderate range. Pre- and postimplant audiograms for the nonimplanted ear are shown in Figure 1. The changes in hearing levels pre- and postimplant are consistent with a fluctuating hearing loss from a Meniere-like autoimmune disorder. CH1’s speech understanding scores obtained 18 months after device hookup are shown in Table 1.
FIG. 1.
Pre-implant audiogram (x–x) and post-implant audiogram (□–□) from CH1’s nonimplanted ear.
TABLE 1.
Percent correct scores for CH1 for material directed to the nonimplanted and implanted ears
| Nonimplanted ear | Implanted ear | Both ears | |
|---|---|---|---|
| CNC words | 96 | 68 | 96 |
| Vowels | 83 | 61 | 96 |
| Consonants | 95 | 56 | 94 |
| Sentences Quiet | 99 | 97 | 99 |
| Sentences at +10 | 92 | 68 | 92 |
| Sentences at +5 | 56 | 15 | 67 |
| Sentences at 0 | 4 | 7 | 25 |
+10, +5, and 0 refer to signal-to-noise ratios in dB.
The stimulus material is described in Spahr and Dorman (2004).
The research described below was reviewed and approved by the Institutional Review Board at Arizona State University.
Radiographic evaluation
Boex et al. method
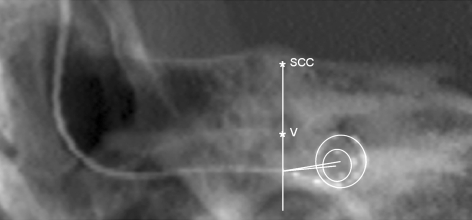
A summed voxel projection of high-resolution CT scan data was used to create a radiograph-type image (see Fig. 2) from which electrode insertion angle was estimated in the manner described by Boëx et al. (2006).
FIG. 2.
Electrode insertion angle calculated using the method of Boëx et al. (2006). The line passing through the top of the superior semicircular canal (ssc) and the middle of the vestibule (v) crosses the electrode array at the estimated location. The line from the r.w. to the center of the first turn of the spiral made by the electrode array is the 0 degree reference line for measurement of insertion angle.
3D image volumes
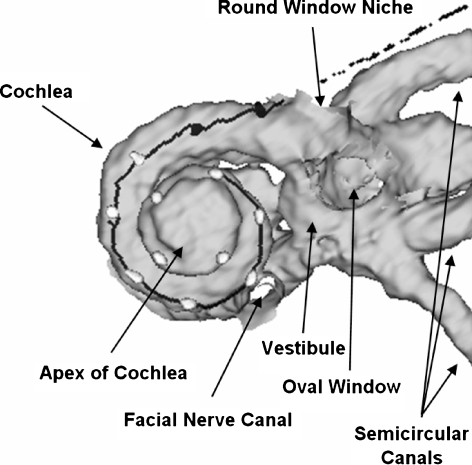
High-resolution CT scans (100 μm voxels) of the patient’s temporal bones were taken and the scan data were used to build 3D image volumes of the implanted and nonimplanted ears. Normally, to build a 3D image volume of electrodes in the cochlea, patients are scanned before implantation to create an artifact free image of the cochlea and then a postimplant image with electrodes in place is registered to the pre-implant image. Because we had no pre-implant scans for CH1, the CT data from the nonimplanted ear were mirrored and used as the artifact free image of the cochlea. This procedure is generally acceptable for persons with normal cochlear anatomy. For CH1 the data sets from the left and right cochlea were registered to one another and matched on cochlear anatomy based on a 20-mm cubic region of the temporal bone with the cochlea at the center. This subvolume was resized to 50 μm voxels and the boundary between the fluid/tissue space of the cochlea and the bone of the otic capsule was marked to outline the cochlear canal. Using 3D rendering software (Analyze 7.0; Robb 2001) the 3D path of the electrode array through the cochlear canal and the location of the electrode contacts was visualized and measured (see Fig. 3). In addition, the positions of the round window, the outer wall of the cochlear canal, cochlear height, and the number of turns of the cochlea were measured with ±100 μm precision and marked. As CT does not image the small nonbony structures of the cochlea, such as the basilar membrane, organ of Corti, and Reissner’s membrane, it is impossible to make a direct measure of the length of the cochlea. However, an estimate can be derived based on the 3D bony outline of the cochlea. Having a 3D volume of the patient’s cochlea, with the electrode array marked, also allows for predicting if the array is in scala tympani or scala vestibuli by comparing midmodiolar views with a 3D cochlear atlas generated from orthogonal-plane fluorescence optical sectioning microscopy (OPFOS) (Voie et al. 1993). Unlike CT, OPFOS is capable of high-resolution imaging of the small tissue, as well as bony structures, of an excised cochlea.
FIG. 3.
Right: 3D image volume reconstruction of CH1’s cochlea and position of electrodes in the cochlea. Filled circles represent electrodes in the scala tympani; open circles represent electrodes in the scala vestibuli.
Pitch-matching protocol
Acoustic-to-electric pitch matches were obtained for high-rate stimulation delivered to each of the 11 electrodes. Pitch-matching data were collected on two occasions, approximately three weeks apart, to assess the reliability of the pitch matches.
The following procedure was used to generate an unmodulated, high rate, pulse train at a single electrode. The same procedure was used with all 11 electrodes. First, a speech processor map (MAP) was created with only one electrode activated. The threshold and maximum comfortable loudness levels for that electrode were imported from the patient’s clinical MAP. The center frequency of the input filter for the channel was set to 1 kHz using the clinical software (CI Studio). Then a 500-ms, 1-kHz pure tone was delivered to the auxiliary input of the signal processor. This procedure resulted in a 1,652-pps, unmodulated, pulse train at the electrode. The output was verified using a dummy resistance box (detector Combi 40+) and a Tektronix TDS 2014 digital oscilloscope.
Pitch matching of acoustic pure tones to electrical stimulation was accomplished using a method of limits procedure with three ascending and three descending runs. The “pitch match” was the average of the termination points of the ascending and descending runs.
First loudness for both acoustic and electric signals was adjusted to a level of 5 (“comfortable”) on a 1–10 point scale. Then stimulation to the implanted ear (a 500-ms, 1-kHz tone resulting in a 1,652-pps pulse train) was followed by a 500-ms pure tone of variable frequency delivered to the nonimplanted ear via one channel of Sennheiser Linear II HD 250 stereo headphones. The interval between the tones delivered to the implant and to the headphone was 300 ms. The starting frequency for stimulation to a given electrode was determined by a process in which frequencies from 200 to 4,000 Hz were played to the nonimplanted ear and the patient was asked which of the stimuli was in the “ball park” for stimulation delivered to the implanted ear. Once the starting frequency had been determined, the step size for the method of limits was set to 1% of the starting frequency. To avoid errors of habituation and anticipation with this psychophysical method, the starting frequency for each run was varied over a 10- to 300-Hz range. Thus, the subject was not able to predict the number of trials before reaching a pitch match. The subject was given several practice runs over a 30-min period before initial data collection commenced. The pure tone stimuli were generated in MATLAB and were controlled by custom software.
RESULTS
Electrode position
The insertion angle for each electrode is shown in Table 2. This angle is a measure of the degrees rotation counter clockwise from the 0 degree reference line, as described by Boëx et al. (2006), to the center of each electrode and provides a measure of the depth of insertion of the electrode array. Table 3 shows data derived from analyses of the 3D image volume data, i.e., the depth of insertion for individual electrodes, whether the electrodes were in the scala tympani or scala vestibuli, the position of the electrodes within the scala, i.e., medial, center, or lateral, and the distance from the midmodiolar axis to the (1) lateral wall of the cochlea, (2) to the electrode, and (3) to the medial wall of the cochlea. The Greenwood prediction for the frequency associated with each electrode location was calculated from the image volume data (see Table 4) using the following formula: CF = A(10ax − k) where A = 166.67, k = 0.88, x = distance from apex (mm),  , where F = 20,000 Hz and Ls = patient’s Basilar membrane length = 33.1 mm.
TABLE 2.
Electrode insertion angle
| Electrode | Insertion angle |
|---|---|
| 1 | 612 |
| 2 | 534 |
| 3 | 469 |
| 4 | 377 |
| 5 | 324 |
| 6 | 269 |
| 7 | 222 |
| 8 | 168 |
| 9 | 122 |
| 10 | 76 |
| 11 | 31 |
| 12 | 5 |
TABLE 3.
Measurements from 3D image volume reconstruction
| Distance from round window (mm) | Location | Position | Midmodiolar axis to lateral wall (mm) | Midmodiolar axis to electrode (mm) | Midmodiolar axis to medial wall (mm) | |
|---|---|---|---|---|---|---|
| e12 | 1.0 | st | l | 4.8 | 4.7 | 3.0 |
| e11 | 3.4 | st | c | 4.2 | 3.5 | 2.5 |
| e10 | 6.0 | sv | c | 4.0 | 3.2 | 2.3 |
| e9 | 8.3 | sv | l | 3.5 | 3.1 | 1.3 |
| e8 | 10.6 | sv | l | 3.2 | 2.9 | 1.1 |
| e7 | 12.7 | sv | l | 2.9 | 2.9 | 0.8 |
| e6 | 14.8 | sv | l | 2.8 | 2.7 | 0.6 |
| e5 | 16.9 | sv | l | 2.5 | 2.3 | 0.6 |
| e4 | 19.0 | sv | l | 2.2 | 2.0 | 0.5 |
| e3 | 21.1 | sv | l | 1.9 | 1.8 | 0.3 |
| e2 | 23.0 | sv | l | 1.9 | 1.8 | 0.3 |
| e1 | 25.1 | sv | l | 1.6 | 1.5 | 0.3 |
Distance from the modiolus to the medial and lateral walls and to the electrode is referenced to a midmodiolar line.
st = scala tympani, sv = scala vestibuli, l = lateral, c = center
TABLE 4.
For electrodes 1–11: center frequency for each input filter, perceived pitch, and standard deviation of pitch estimates for high rate stimulation delivered to electrodes 1–11 (average of two test sessions), and Greenwood frequency-place prediction of pitch
| Electrode | Input filter CF | Pitch at electrode | Greenwood CF |
|---|---|---|---|
| 1 | 235 | 441 (50) | 317 |
| 2 | 318 | 404 (36) | 425 |
| 3 | 430 | 397 (15) | 560 |
| 4 | 581 | 495 (31) | 763 |
| 5 | 785 | 666 (23) | 1,036 |
| 6 | 1,061 | 927 (49) | 1,399 |
| 7 | 1,434 | 1,065 (50) | 1,911 |
| 8 | 1,938 | 1,230 (56) | 2,586 |
| 9 | 2,619 | 1,550 (55) | 3,623 |
| 10 | 3,540 | 2,584 (83) | 5,046 |
| 11 | 4,785 | 3,449 (170) | 7,347 |
The main results of the 3D image volume analyses were that (1) only the two most basal electrodes were in the scala tympani, (2) all but two of the electrodes were lying laterally in the scala (as expected with the Med El electrode array), and (3) the location of electrode 12—1 mm from the round window—is consistent with nonauditory stimulation from that electrode.
Pitch matching
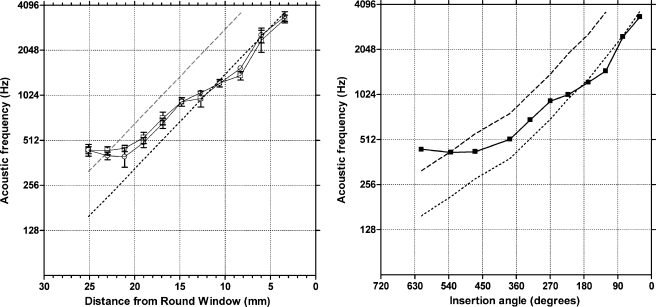
The pitch matching results are shown in Figure 4a and b. Figure 4a shows the data plotted as a function of distance of the electrode from the round window. The data from the two administrations of the pitch-matching test are very similar, suggesting a high level of test–retest reliability. From 20 to 15 mm insertion depth pitch estimates are about one-half octave lower than the Greenwood prediction. From 13 to 3 mm insertion depth the pitch estimates are generally one octave lower than the Greenwood prediction. Within a test session there was variability in the pitch match for each electrode stimulated (see the standard deviations in Table 4 and Fig. 4a). For example, for a signal with a pitch of approximately 1 kHz the standard deviation was 50 Hz. The mean standard deviation for a pitch match at 1 kHz for normal hearing listeners in our laboratory is 21 Hz.
FIG. 4.
Pitch matches for high-rate electrical stimulation as a function of electrode position (in mm) from the round window (a) and as a function of insertion angle (b). In a, results from two test runs are plotted. The averaged data are plotted in b. Error bars=± 1 standard deviation. The dashed line indicates the Greenwood frequency-place function. The dotted line lies one octave lower than the Greenwood function.
Figure 4b shows the pitch matching data, averaged over the two test sessions, as a function of insertion angle. The data indicate a flattening of pitch beyond about 450 degrees insertion angle.
DISCUSSION
As detailed in the introduction, it is very rare to find patients with a cochlear implant in one ear and good hearing sensitivity for a wide range of frequencies in the other ear. For that reason the pitch-matching data provided by CH1 are of interest. Previous studies with patients who presented, most generally, with poorer hearing thresholds than CH1’s, indicated that the pitch of high-rate electrical stimulation was lower than the pitch predicted by Greenwood’s frequency-position function. CH1’s data are in agreement with these outcomes.
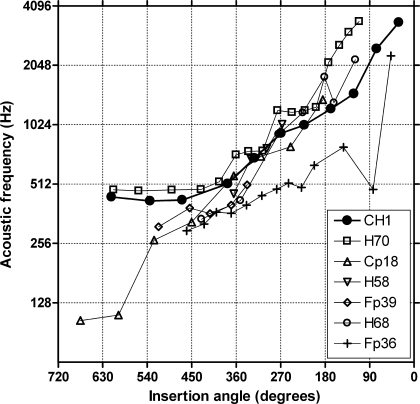
CH1’s pitch matching data are plotted along with the pitch-matching data from the patients studied by Boëx et al. (2006) in Figure 5. For all but one of the patients (Fp36), pitch matches range within approximately 0.75 octave between approximately 180 and 450 degrees insertion angle. At some angles, i.e., approximately 225 and 310 degrees, the agreement in pitch match is extremely high. If an average pitch match as a function of insertion angle were obtained from Figure 5, then those values could be used to set up signal processors (in terms of frequency to electrode maps) for conventional implant patients for whom CT data were available.
FIG. 5.
Pitch matching for CH1 (filled circles) and the patients tested by Boëx et al. (2006).
In the introduction we noted that if frequencies in the input signal were not output to the correct place in the electrically stimulated cochlea then signals would be misrepresented. Inspection of Table 4 suggests that low frequencies, between 200 and 300 Hz, have been upshifted and higher frequencies have, most generally, been downshifted. The magnitude of the downshift varied from 86 Hz at 581 Hz to 1,336 Hz at 4.7 kHz. On one hand, the misrepresentation of frequency is likely to be one part of an account of CH1’s modest vowel (61% correct) and consonant (56% correct) recognition scores. On the other hand, the CNC score (68% correct) is above average and the score in quiet for relatively difficult sentence material (97% correct) is near perfect. These outcomes reflect the ability of cortical processing to accommodate to an abnormal input and to use sentence context in the service of speech understanding.
The data provided by CH1 speak to the issue of whether an implant can be of benefit to an individual who is unilaterally deaf and who has only a mild-to-moderate hearing loss in the good ear. As shown in Table 1, when scores were not at the ceiling for the nonimplanted ear, small improvements in performance were obtained when electric stimulation was added to acoustic stimulation. Moreover, the patient indicated that the implant was very valuable in everyday situations. The improvement in performance when electric and acoustic stimulation were combined is consistent with previous reports for patients with residual low-frequency hearing ipsilateral and/or contralateral to an ear with a cochlear implant (e.g., Ching et al. 2004; Gantz et al. 2005; Kiefer et al. 2005; Kong et al. 2005; v. Ilberg et al. 1999). Given these outcomes, a clinical trial of the value of cochlear implants for the unilaterally deaf should be considered.
Acknowledgement
This work was supported by NIDCD R01 DC 00654-16 to M.F.D., by NIDCD F32 DC 00653802 to R.G., by NIDCD R01 DC000581 to M.S., and by NIDCD R21 DC006665 to C.F. We thank Dr. C. Boëx for providing data plotted in Figure 5.
References
- Boëx C, Baud L, Cosendai G, Sigrist A, Kos M-I, Pelizzone M. Acoustic to electric pitch comparisons in cochlear implant subjects with residual hearing. J. Assoc. Res. Otolaryngol. 7(2):110–124, 2006. [DOI] [PMC free article] [PubMed]
- Blamey O, Dooley G, Parisi E, Clark G. Pitch comparisons of acoustically and electrically evoked auditory sensations. Hear. Res. 99:139–150, 1996. [DOI] [PubMed]
- Ching T, Incerti P, Hill M. Binaural benefits for adults who use hearing aids and cochlear implants in opposite ears. Ear Hear. 25:9–21, 2004. [DOI] [PubMed]
- Dorman MF, Ketten D. Adaptation by a cochlear-implant patient to upward shifts in the frequency representation of speech. Ear Hear. 24:457–460, 2003. [DOI] [PubMed]
- Dorman MF, Loizou P, Rainey D. Simulating the effect of cochlear-implant electrode insertion depth on speech understanding. J. Acoust. Soc. Am. 102(5):2993–2996, 1997. [DOI] [PubMed]
- Eddington D, Dobelle W, Brackmann, D, Mladejovsky M, Parkin J. Auditory prosthesis research with multiple channel intracochlear stimulation in man. Ann. Otol. Rhinol. Laryngol. 87(6, part 2, Suppl. 53):1–39, 1978. [PubMed]
- Fu Q-J, Shannon R. Effects of electrode configuration and frequency allocation on vowel recognition with the Nucleus-22 cochlear implant. Ear Hear. 20(4):332–344, 1999a. [DOI] [PubMed]
- Fu Q-J, Shannon R. Recognition of spectrally degraded and frequency-shifted vowels in acoustic and electric hearing. J. Acoust. Soc. Am. 105(3):1889–1900, 1999b. [DOI] [PubMed]
- Fu Q-J, Shannon R, Galvin J. Perceptual learning following changes in the frequency-to-electrode assignment with the Nucleus-22 cochlear implant. J. Acoust. Soc. Am. 112(4):1664–1674, 2002. [DOI] [PubMed]
- Gantz B, Turner C, Gfeller K, Lowder M. Preservation of hearing in cochlear implant surgery: advantages of combined electrical and acoustical speech processing. Laryngoscope 115:796–802, 2005. [DOI] [PubMed]
- Greenwood D. A cochlear frequency-position function for several species—29 years later. J. Acoust. Soc. Am. 87(6):2592–2605, 1990. [DOI] [PubMed]
- James C, Blamey P, Shallop L, Incerti P, Nicholas A. Contralateral masking in cochlear implant users with residual hearing in the non-implanted ear. Audiol. Neuro-otol. 6:87–97, 2001. [DOI] [PubMed]
- Kawano A, Seldon H, Clark G. Computer-aided three-dimensional reconstruction in human cochlear maps: measurement of the lengths of organ of Corti, outer wall, inner wall and Rosenthal’s canal. Ann. Otol. Rhinol. Laryngol. 105:701–709, 1996. [DOI] [PubMed]
- Kiefer J, Pok M, Adunka O, Sturzebecher E, Baumgartner W, Schmidt M, Tillein J, Ye Q, Gstoettner W. Combined electric and acoustic stimulation of the auditory system: results of a clinical study. Audiol. Neuro-Otol. 10(3):134–144, 2005. [DOI] [PubMed]
- Kong Y-L, Stickney G, Zeng F-G. Speech and melody recognition in binaurally combined acoustic and electric hearing. J. Acoust. Soc. Am. 117(3):1351–1361, 2005. [DOI] [PubMed]
- Robb R. The biomedical imaging resource at Mayo Clinic. IEEE Medical Imaging 20:854–867, 2001. [DOI] [PubMed]
- Rosen S, Faulkner A, Wilkinson L. Adaptation by normal listeners to upward spectral shifts of speech: implications for cochlear implants. J. Acoust. Soc. Am. 106(6):3629–3636, 1999. [DOI] [PubMed]
- Skinner M, Holden L, Holden T. Effect of frequency boundary assignment on speech recognition with the SPEAK speech-coding strategy. Ann. Otol. Rhinol. Laryng. Suppl 166:307–311, 1995. [PubMed]
- Spahr A, Dorman M. Performance of patients fit with Advanced Bionics CII and Nucleus 3G cochlear implant devices. Arch. Oto. - Head Neck Sur. 130(5):624–628, 2004. [DOI] [PubMed]
- Sridhar D, Stakhovskaya O, Leake PA. A frequency-position map for the human spiral ganglion. Audiol. Neuro-otol. 11(Suppl 1):16–20, 2006. [DOI] [PMC free article] [PubMed]
- v. Ilberg C, Kiefer J, Tillein J, Pfenningdorff T, Hartmann R, Sturzebecker E, Klinke R. Electric-acoustic stimulation of the auditory system. ORL 61:334–340, 1999. [DOI] [PubMed]
- Voie AH, Burns DH, Spelman FA. Orthogonal-plane fluorescence optical sectioning: three dimensional imaging of macroscopic biological specimens. J Microsc 170:229–236, 1993. [DOI] [PubMed]


