

Abstract
Background
Depressive symptoms of varying severity are prevalent in up to 63% of Alzheimer disease (AD) patients and often result in greater cognitive decline and increased caregiver burden. The current study aimed to determine the neural correlates of depressive symptoms in a sample of AD patients.
Methods
Using the Cornell Scale for Depression in Dementia, we assessed 56 patients who met criteria for probable AD. Data obtained from Technetium-99m ethyl cysteinate dimer single photon emission computed tomography (SPECT) were analyzed with the use of a magnetic resonance imaging–derived region of interest (ROI) anatomic template before and after atrophy correction and statistical parametric mapping (SPM). The following 4 frontal ROIs were investigated bilaterally: middle frontal gyrus (Brodmann's area [BA] 46), orbitofrontal cortex (BA 11), superior prefrontal (BA 8/9) and anterior cingulate (BA 24/25/32/33).
Results
Depressive symptoms were present in 27 of the AD patients (48%). Patients with depressive symptoms showed less perfusion in the right superior and bilateral middle frontal gyri (p < 0.005), left superior frontal (p < 0.05) and anterior cingulate gyri (p < 0.005) before atrophy correction. SPM analyses revealed significantly lower perfusion in bilateral dorsolateral and superior prefrontal cortex of patients with depressive symptoms (right, p < 0.005; left, p < 0.05). SPECT ROI analyses with atrophy correction revealed trends similar to data without atrophy correction but did not reach statistical significance.
Conclusion
In this study, depressive symptoms in AD patients were associated with relative hypoperfusion in the prefrontal cortex when they were compared with AD patients without depressive symptoms. These findings are consistent with previous reports in studies of primary depression suggesting that these regions are involved in affect and emotional regulation.
Medical subject headings: Alzheimer disease; depression; tomography, emission-computed, single-photon; magnetic resonance imaging
Abstract
Objectif
Les symptômes dépressifs de gravité variable sont prévalents dans une proportion pouvant atteindre 63 % chez les patients atteints de la maladie d'Alzheimer (MA), produisent souvent un déclin cognitif plus important et alourdissent le fardeau imposé aux soignants. L'étude visait à déterminer les corrélats neuronaux des symptômes dépressifs dans un échantillon de patients atteints de MA.
Méthodes
On a utilisé l'échelle de dépression de Cornell pour les patients atteints de démence pour évaluer 56 patients répondant aux critères d'une MA probable. On a analysé les données tirées d'une tomographie d'émission monophotonique (TEM) à un seul dimère d'éthyl cystéinate au technetium-99m en utilisant un modèle anatomique de zone concernée dérivée de l'imagerie par résonance magnétique avant et après correction pour l'atrophie et configuration paramétrique statistique (CPS). On a étudié les quatre ZC frontales suivantes des deux côtés : circonvolution frontale moyenne (zone de Brodmann [ZB] 46), cortex orbitofrontal (ZB 11), circonvolution préfrontale supérieure (ZB 8/9) et antérieure (ZB 24/25/32/33).
Résultats
Vingt-sept des patients atteints de MA (48 %) présentaient des symptômes de dépression. Ces patients montraient aussi une perfusion moindre des circonvolutions supérieure droite et frontale moyenne bilatérale (p < 0,005), de la circonvolution frontale supérieure gauche (p < 0,05) et antérieure (p < 0,005) avant correction de l'atrophie. Les analyses de CPS ont révélé une perfusion beaucoup moins importante du cortex dorsolatéral bilatéral et préfrontal supérieur chez les patients qui présentaient des symptômes dépressifs (droite, p < 0,005; gauche, p < 0,05). Les analyses SPECT des zones concernées après correction pour l'atrophie ont révélé des tendances semblables aux données obtenues sans correction pour l'atrophie, mais elles n'ont pas atteint une niveau statistiquement significatif.
Conclusion
Cette étude établit un lien entre les symptômes dépressifs chez les patients atteints de MA et une hypoperfusion relative du cortex préfrontal comparativement aux patients atteints de MA ne présentant pas de symptômes dépressifs. Ces constatations concordent avec des rapports antérieurs d'études portant sur la dépression primitive qui indiquent que ces régions jouent un rôle dans la régulation de l'affect et des émotions.
Introduction
Depressive symptoms of varying severity are prevalent in up to 63% of patients with Alzheimer disease (AD)1 and, when present, can result in more rapid cognitive decline and increased caregiver burden.2,3 Although both the psychiatric and neurologic literature acknowledge the occurrence of affective and psychotic features in patients with AD, very little is known about the underlying mechanisms of depressive symptoms in this patient population. Certain AD studies have emphasized such psychosocial factors as functional and cognitive disability, whereas others have stressed the neurobiological underpinnings.4 As in primary depression, it is likely that depressive symptoms in AD are multifactorial.
Abnormalities in limbic-frontal circuitry have been associated with depressive symptoms in subjects without dementia. Known substrates of executive function, such as the dorsolateral prefrontal region, have consistently shown abnormally reduced baseline function in clinical depression.5 The etiology is not well understood, but a neurobiological rather than reactive phenomenon seems likely. Mayberg and colleagues6 proposed a working model of primary depression that involves 3 interconnected frontal regions: the dorsal, ventral and rostral cingulate. The dorsal compartment is thought to be involved in cognitive aspects of negative emotion, such as apathy, impaired attention and dysexecutive syndrome, whereas the ventral compartment may mediate the circadian and vegetative aspects of depression, such as disturbed sleep and appetite. The rostral cingulate mediates interactions between the dorsal and ventral cortical subcortical pathways.6 In the depressed state, subjects without dementia show hyperactivation of the anterior cingulate, particularly subgenual cingulate area 25, with hypoactivation of dorsolateral prefrontal cortex,7 a pattern that is modified when there is an antidepressant treatment response8. How these regions may be involved in depressive symptoms associated with AD has yet to be fully elucidated.
Single photon emission computed tomography (SPECT) studies have been useful in furthering knowledge of brain–behaviour relationships in AD, but few studies have investigated possible regional perfusion correlates of depressive symptoms in AD. One 99mTc-hexamethyl propyleneamine oxime (HMPAO)–SPECT study reported selective hypoperfusion in the bilateral anterior and posterior cingulate gyri and precuneus in AD patients with depression, using statistical parametric mapping (SPM).9 A longitudinal HMPAO-SPECT study of dementia and depression reported an increase in perfusion in the right cingulate gyrus and right cerebellum in dementia patients who had significantly less depression at 2-year follow-up, but this study only included 10 subjects with varying types of dementia.10 Similarly, an 18F-fluorodeoxyglucose positron emission tomography (PET) study reported decreased activity in the superior frontal cortex bilaterally and the left anterior cingulate gyrus in 8 AD patients with depressive symptoms.11
The diagnosis of depression in AD patients is not straightforward. Research suggests that the reported frequency of depression varies substantially with both the method of assessment and the person being interviewed.12 For example, cognitive impairment in AD patients may limit their ability to report depressive symptoms to clinicians,3 whereas caregivers often overreport depressive symptoms in the patient.13 Another challenge has to do with the tools used to assess depression in AD patients. Most traditional depression scales were not designed for use with patients suffering from dementia, or even for elderly subjects.14,15 The Cornell Scale for Depression in Dementia (CSDD)14 was specifically designed for use in the dementia population and is based on combined caregiver and patient interviews. Recent studies suggest that the CSDD shows promise in the detection, quantification and management of depression in AD.3,12,16
The current study aimed to use SPECT imaging and the CSDD to investigate regional perfusion correlates of depressive symptoms in a sample of AD patients. Specifically, it was hypothesized that depressive symptoms in AD would be associated with decreased perfusion ratios in the areas of the superior, middle and orbitofrontal and anterior cingulate regions, postulated to be involved in the cognitive–behavioural circuitry for depressive states. We investigated this relation with 3 different techniques. First, we examined the SPECT data, using a region-of-interest (ROI) analysis based on a magnetic resonance imaging (MRI)–derived anatomic template. Second, owing to the presence of brain atrophy in many patients, we included an analysis of SPECT data with atrophy correction of perfusion values that used estimates of brain tissue volume measured by MRI. Third, we used SPM to confirm ROI findings. SPM examined total cerebral blood flow distribution differences between the 2 groups in the entire brain and not just in specific ROIs.
Methods
Participants
The study patients were recruited from a referral-based outpatient memory clinic at the Sunnybrook Health Sciences Centre, as part of the Sunnybrook Dementia Study, which is a longitudinal observational neuroimaging study of AD and other dementias. All patients were fluent in English and had adequate visual and auditory acuity to complete neuropsychological testing. As part of the longitudinal study, patients received a comprehensive clinical evaluation, including detailed medical history, neurologic examination, routine laboratory investigation and neuropsychological testing with a standardized test battery. The presence of cerebrovascular risk factors was ascertained, including arterial hypertension, diabetes, hyperlipidemia and “other cardiac disorders” such as coronary artery disease. Patients were consecutively enrolled and were included if they met the study criteria, which included a historical profile compatible with AD, with insidious onset and gradual decline. Further, all patients in this study met the National Institute of Neurological and Communicative Disorders and Stroke–Alzheimer's Disease and Related Disorders Association criteria for probable or possible AD.17 As well, patients met the Diagnostic and Statistical Manual of Mental Disorders (fourth edition; DSM-IV)18 criteria for dementia. A final inclusion criteria was that participants' SPECT, MRI and neuropsychological testing was to be completed within a consecutive 3-month period. Patients were excluded if they had a history of significant head trauma, psychotic disorder unrelated to dementia, psychoactive substance abuse, major depressive disorder or any other psychiatric or neurologic illness.
Depressive symptoms were assessed with the CSDD.14 The CSDD is a 19-item, clinician-administered depression scale developed to measure depressive symptom severity in older adults with dementia. Significant depressive symptoms were based on a score of 8 or more on the CSDD (range 0–38). Patients were also rated (with MRI scans) on the severity of white matter hyperintensities noted to be associated with depression and dementia.19 White matter hyperintensities were rated according to the Age-Related White Matter Changes scale,20 a visual rating scale with good interrater reliability and face validity.
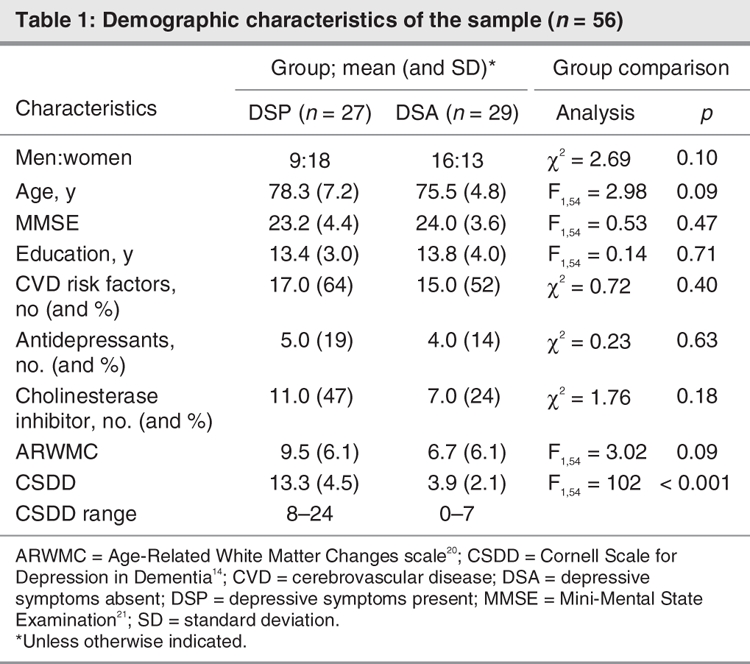
In total, 56 patients with AD were included in the study (25 men and 31 women; mean age 76.8, standard deviation [SD] 6.2 years, see Table 1). The mean Mini-Mental State Examination (MMSE)21 score for all participants was 23.6 (SD 4.0), showing mild impairment. Twenty-seven patients (48%) showed evidence of depressive symptoms with scores of 8 or higher on the CSDD (range 8–24). In the group with depressive symptoms present (DSP), CSDD scores were as follows: 8–10 in 9 patients, 11–13 in 9 patients, 14–16 in 5 patients and 18–24 in 7 patients.
Table 1
SPECT scans and regional perfusion ratios
SPECT imaging used a triple-head gamma camera (Prism 3000XP; Phillips Medical Systems Inc., Cleveland, Ohio) and was performed a minimum of 30 minutes and a maximum of 120 minutes after injection of 20 mCi (740 MBq) of the radiopharmaceutical Technetium-99m ethyl cysteinate dimer. Each view consisted of a 128 × 128 pixel image with a typical reconstructed image resolution of 9.7 mm full width at half maximum. Total imaging time was 19 minutes. Reconstruction was performed by using a ramp-filtered back-projection algorithm followed by a 3-dimensional restoration postfilter (Wiener filter, multiplier 1.0). Ellipses were fit to the approximate location of the outline of the head in each transaxial image, and a calculated attenuation correction applied.22 Reconstructed images were coregistered to a SPECT template that was an average of 28 healthy elderly control scans. A T1-weighted MRI with dimensions similar to the SPECT template was the source of 79 bilateral ROIs.23 To obtain ROI intensity values, we used a common transformation to move each SPECT from SPECT template space into MRI space. Because the cerebellum is frequently used to normalize SPECT counts,24,25 mean perfusion in ROIs was referenced to the cerebellum to provide semiquantitative measures of regional perfusion.
Regions of interest
Prefrontal and anterior cingulate cortices were chosen as target regions hypothesized to be adversely affected by depression. The prefrontal regions (Fig. 1) included the middle frontal gyrus (Brodmann's area [BA] 46), orbitofrontal cortex (BA 11) and superior prefrontal (BA 8/9) regions; the anterior cingulate ROIs included the combined dorsal (BA 25) and middle (BA 24/32/33) regions. Three additional ROIs were assigned as control regions to investigate perfusion in areas typically affected in AD: posterior cingulate (BA 23/31), angular gyrus (BA 39) and superior parietal (BA 7).26,27
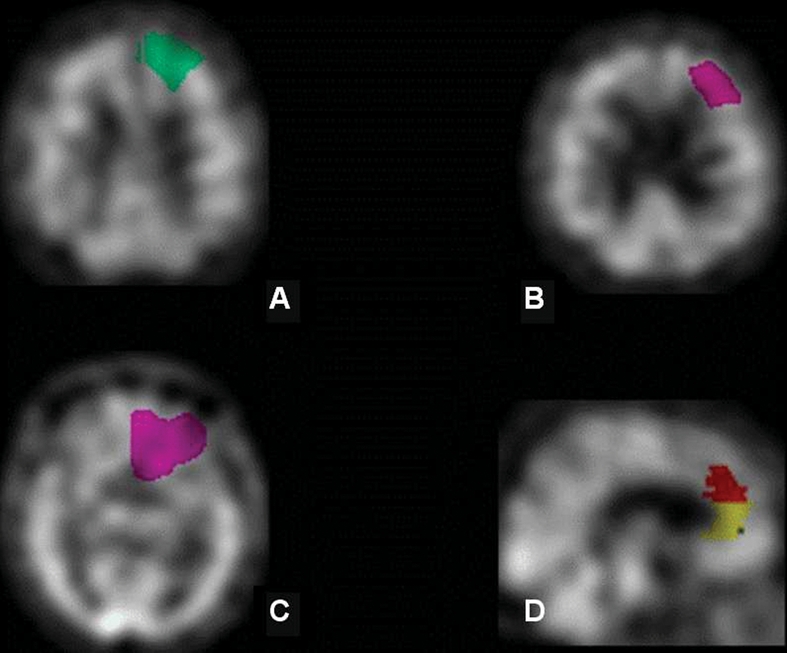
Fig. 1: Frontal regions as defined by the single photon emission computed tomography region of interest template: (A) superior frontal gyrus (BA 8/9), (B) middle frontal gyrus (BA 46), (C) orbitofrontal cortex (BA 11), (D) anterior cingulate cortex (BA 25/24). BA = Brodmann's area.
Magnetic resonance imaging
MRI acquisition
All brain images were acquired with a 1.5-T Signa MR imager (GE Medical Systems, Milwaukee, Wis.). Three image sets were acquired in the same imaging session: T1-weighted (axial 3D spoiled gradient [SPGR] echo, with echo time [TE] 5 ms, repetition time [TR] 35 ms, flip angle 35°, number of excitations [NEX] 1, field of view [FOV] 22 × 16.5 cm, in-plane resolution 0.859 × 0.859 mm and slice thickness 1.2–1.4 mm ), proton-density (PD) and T2-weighted images (interleaved axial spin echo, with TEs 30 and 80 ms, TR 3 s, NEX 0.5, FOV 20 × 20 cm, in-plane resolution 0.781 × 0.781 mm and slice thickness 3 mm).
MRI-based pixel-by-pixel partial volume correction
A previously described computerized MRI-based partial volume correction algorithm originally developed for PET was modified for use with SPECT images.28 The algorithm compensates for the limited spatial resolution of the SPECT images by using higher-resolution segmented MR data to determine the fractional contributions of anatomical structures to observed SPECT voxel activities. MR brain extraction and automated tissue segmentation was accomplished by using a modified version of previously described methods.29 This is a multispectral approach that uses the PD/T2 images for brain extraction, followed by a T1-based segmentation where local intensity histograms are fitted to 4 Gaussian curves to derive a cut-off used to classify each voxel as white matter (WM), grey matter (GM) or cerebrospinal fluid (CSF). Following the procedure of Bencherif and colleagues,28 binary WM, GM and CSF masks were generated from the segmented MR and smoothed by the estimated point spread function of the SPECT scanner. The smoothed WM and CSF masks were thresholded to obtain masks containing only pixels that were members of the tissue type in question with high probability. SPECT data were interpolated to the same pixel dimensions as the MR image. The interpolated SPECT data were then coregistered to the MR image. The masks were applied to the coregistered SPECT data for calculation of mean WM and CSF uptake. This is a slight deviation from the original Bencherif algorithm, which called for coregistration of MR–PET (MR–SPECT) in PET (SPECT) space, that is, down-sampling the higher spatial resolution MR images to PET (SPECT) pixel dimensions during coregistration and applying the corrections in PET (SPECT) space. The current calculations were performed in higher-resolution MR space for improved accuracy. The smoothed WM and CSF binary masks were then scaled by their respective mean uptake values and subtracted from the coregistered original SPECT to remove WM and CSF “spill-in” counts from GM voxels. Finally, the resulting image was divided by the smoothed GM mask to compensate for the “spill-out” of GM counts to surrounding tissues.
Image analysis by SPM
Data analysis was also conducted with SPM software version 230,31 running under the MATLAB Version 7 on Windows XP. Unlike the ROI method, SPM does not analyze data according to predefined regions. Instead, it performs unbiased voxel-by-voxel analysis of the entire brain image and produces a visual representation of the results. Images in each group were normalized into approximate Talairach space by transforming them into Montreal Neurological Institute (MNI) space. After the completion of the normalization, we also checked the images individually to detect normalization errors. Subsequently, the images were smoothed with an isotropic Gaussian kernel of 12 mm full width at half maximum to increase the signal-to-noise ratio. Each image was scaled to 50 with the proportional scaling option, which minimizes intersubject variability. SPECT images of groups with and without depression were compared by using the independent t test option, and the height threshold was set to less than 0.01 and 0.05 to produce 2 sets of results for comparison with the results obtained with the ROI method. Only cluster level p values < 0.05, corrected for multiple comparisons, were considered significant. Since the coordinate system of Talairach and Tournoux32,33 is not exactly the same as that of the MNI, we converted MNI coordinates into Talairach coordinates by using mni2tal script (www.mrc-cbu.cam.ac.uk/Imaging/Common/mnispace.shtml). In addition, we visually inspected the location of areas of significant change in perfusion in MNI space by superimposing them on Colin27 MRI, which is also normalized to MNI space.
Statistical analysis
We performed data analysis with SPSS software version 11.0 (SPSS Inc., Chicago, Ill.). To explore whether the groups differed significantly on demographic measures, an analysis of variance (ANOVA) was performed on continuous variables that included age and years of education. Categorical variables, such as sex, were compared with χ2 analysis. We used multivariate ANOVA (MANOVA) to compare mean perfusion ratios in DSP patients and in patients with depressive symptoms absent (DSA), for both the uncorrected and atrophy-corrected data sets. To assess the relation between each ROI and the severity of depression (measured by the CSDD raw score), we applied Pearson's correlation test. The level of significance was p < 0.05.
Results
Patients and behaviours
No significant differences were observed between the DSP and DSA groups with respect to age, cognitive status, sex or level of education (Table 1). The CSDD score was not significantly correlated with age, sex, education level, duration of illness or MMSE performance. The 2 groups were also compared on cerebrovascular risk factors, use of cholinesterase inhibitors or antidepressants, and severity of WM disease. No significant differences were seen between the 2 groups (DSP v. DSA) on any of these measures. Four DSA patients were taking antidepressants (mean CSDD score 3.3, SD 2.9), and 5 DSP patients were taking antidepressants (mean CSDD score 15.4, SD 3.9).
ROI analyses
Mean perfusion ratios in DSP and DSA groups are listed in Table 2. MANOVA results indicate a significant overall group difference on mean perfusion (F8,47 = 2.49, p = 0.02). Univariate analyses showed that DSP patients had significantly lower perfusion in the right superior (F1,54 = 11.3, p = 0.001; Cohen's d = 0.9; r = 0.45) and bilateral middle frontal gyrus (left, F1,54 = 8.02, p = 0.006; Cohen's d = 0.4, r = 0.21; right, F1,54 = 9.02, p = 0.004; Cohen's d = 0.7, r = 0.32). Decreased perfusion was also evident in the left superior frontal gyrus (F1,54 = 4.12, p = 0.047), but it was not of the same magnitude (Cohen's d = 0.4, r = 0.21). Perfusion in the anterior cingulate bilaterally (left, F1,54 = 7.88, p < 0.007; Cohen's d = 0.8, r = 0.34; right, F1,54 = 9.22, p < 0.007; Cohen's d = 0.7, r = 0.35) was also significantly lower in the DSP group (Fig. 2). No significant perfusion differences were seen in the orbitofrontal cortex, but there was a trend toward decreased perfusion in the left orbitofrontal region (F1,54 = 3.41, p = 0.07; Cohen's d = 0.4, r = 0.22). Significant but weak negative correlations were seen between the CSDD raw score and perfusion ratios in the bilateral anterior cingulate (left, r = –0.31, p = 0.02; right, r = –0.28, p = 0.036) and the right superior prefrontal region (r = –0.28, p = 0.037). We also analyzed data with age, years of education and disease severity included as covariates in the model (see Table 2). With age and education included as covariates in the model, the group difference remained significant (F8,45 = 2.24, p < 0.05), with lower perfusion in the bilateral frontal and cingulate gyri in the DSP group. The 2 groups did not differ significantly in any of the control ROIs (posterior cingulate, angular gyrus and superior parietal).
Table 2

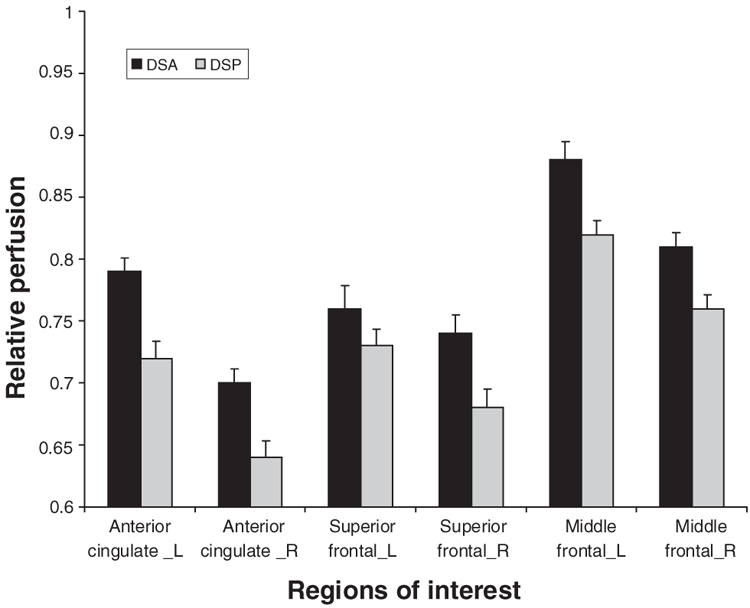
Fig. 2: Histogram comparing single photon emission computed tomography perfusion ratios (referenced to the cerebellum) in 6 frontal regions of interest in depressive symptoms present (DSP) and depressive symptoms absent (DSA) patients.
Partial volume correction results
Five DSP subjects from the original sample were excluded from the partial volume correction analysis because of poor MRI scan quality, giving a total of 51 subjects in the partial volume–corrected data set. MANCOVA controlling for years of education and disease revealed a trend toward group differences in mean perfusion (F8,40 = 2.0, p = 0.07). Exploratory univariate analyses indicated similar patterns of decreased perfusion in the DSP group in the right superior (F3,47 = 5.15, p < 0.05; Cohen's d = 0.4, r = 0.23) and middle (F3,47 = 4.5, p < 0.05; Cohen's d = 0.5, r = 0.24) prefrontal cortex, as well as in the right (F3,47 = 4.68, p < 0.05; Cohen's d = 0.6, r = 0.27) and left (F3,47 = 5.09, p < 0.05; Cohen's d = 0.6, r = 0.29) anterior cingulate.
SPM whole brain analysis
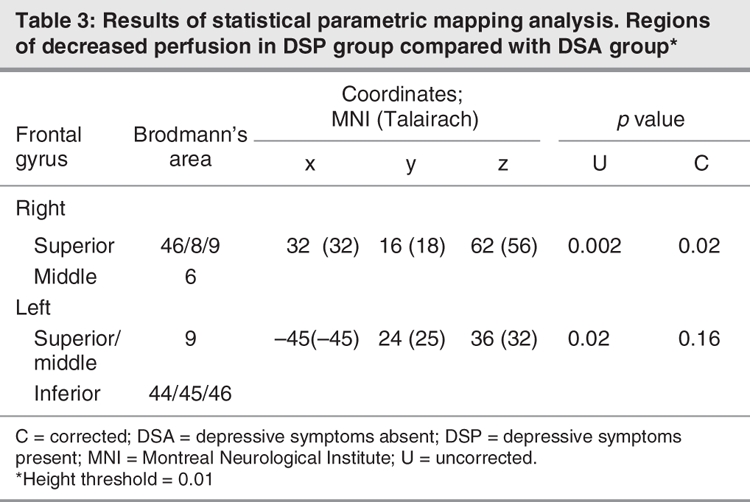
Comparison of the DSP and DSA groups using SPM analyses are shown in Figure 3. The coordinates of areas with significantly less perfusion in the DSP group are listed in Table 3 (height threshold 0.01). The right dorsolateral and superior prefrontal regions constituted the major regions of perfusion differences between the DSP and DSA groups (pcorrected < 0.005). Similar patterns were seen in the left dorsolateral and superior prefrontal cortex, based on uncorrected p values (puncorrected < 0.05). No significant differences were seen in the anterior cingulate region. No regions had a significant increase in perfusion in either group.
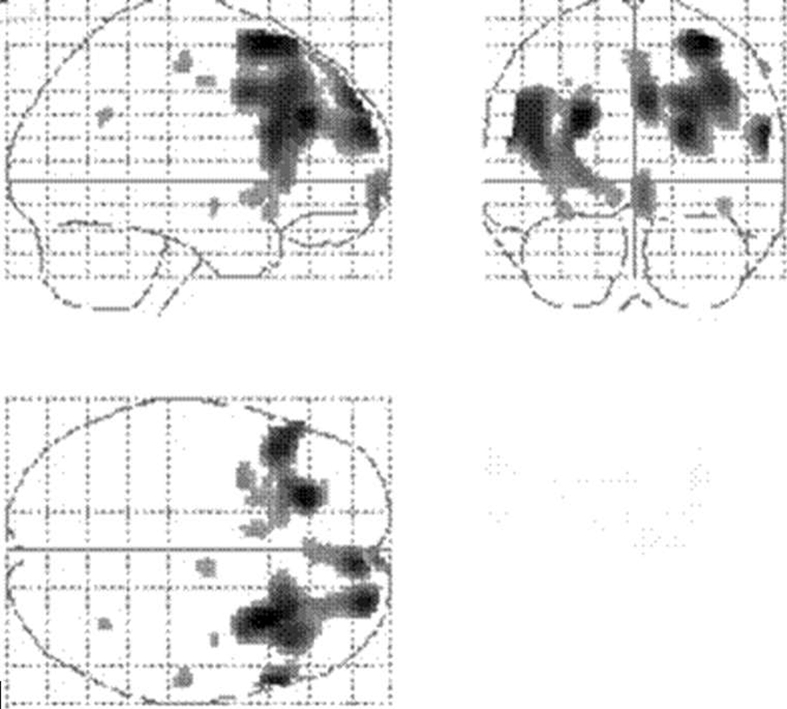
Fig. 3: Statistical parametric mapping projections showing the areas of reduced cerebral perfusion in patients with depressive symptoms (height threshold = 0.01).
Table 3
Atrophy
An atrophy ratio was calculated for the 8 ROIs, comparing the number of voxels originally assigned to a specific ROI with the number of voxels in that same ROI after atrophy correction. Mean ratios for the 8 ROIs were compared between the 2 AD groups. ANOVA did not reveal any significant differences in amount of atrophy between DSP and DSA groups. Atrophy ratios did not correlate with raw scores on the CSDD.
Concomitant medications
Of the 56 participants, 18 were taking a cholinesterase inhibitor (11 DSP v. 7 DSA) at the time of their scan; the 2 groups were not significantly different according to Fisher's exact tests (p > 0.05). Perfusion in the 8 ROIs did not significantly differ in those individuals using cholinesterase inhibitors compared with those who were not (F8,47 = 0.94, ns), nor did perfusion differ in participants using antidepressants compared with those who were not (F8,47 = 1.07, ns). Four DSA patients were taking antidepressants (mean CSDD score 3.3, SD 2.9) and 5 DSP patients were taking antidepressants (mean CSDD score 15.4, SD 3.9). An additional analysis excluding all subjects on antidepressants (n = 47) revealed similar findings. Although the sample size was smaller, univariate analyses showed that DSP patients had significantly lower perfusion in the right superior (F1,45 = 6.8, p = 0.01) and bilateral middle frontal gyrus (left, F1,45 = 5.5, p = 0.02; right, F1,45 = 5.3, p = 0.03) and anterior cingulate bilaterally (left, F1,45 = 4.8, p = 0.03; right, F1,45 = 5.3, p = 0.02). Further, 3 patients in the DSP group were taking benzodiazepine (lorazepam) as needed, and 2 were on small doses of risperidone. Two patients in the DSA group were also taking benzodiazepine (1 lorazepam, 1 alprazolam) as needed.
Apathy
Apathy includes symptoms such as reduction or lack of interest, productivity, will, initiative and affective response toward positive or negative events.34,35 Apathy is also the most frequent behavioural symptom in AD and can often co-occur with depression.36,37 It has been associated with decreased perfusion in the orbito-and middle frontal38 and the anterior cingulate regions.34 To examine potential effects of coexisting apathy in our sample, we investigated the relation between apathy subscore on the Neuropsychiatric Inventory (NPI)12 and perfusion in the 8 ROIs. NPI scores were available for 37 of the 56 patients. Both the depression (r = 0.65, p < 0.001) and apathy (r = 0.52, p < 0.005) subscores were highly correlated with the CSDD. No significant correlations were found between the apathy subscore and perfusion in the ROIs.
Discussion
The current study suggests that, when compared with AD patients without depressive symptoms, AD patients with depressive symptoms have relative hypoperfusion in the prefrontal cortex. Both ROI and SPM analyses showed decreased perfusion in the bilateral superior frontal and middle frontal cortices corresponding to BAs 8/9 and 46, respectively. Differences in atrophy were examined by correcting for tissue loss in the sample. A group comparison suggested no difference in atrophy between the 2 groups, nor was the amount of atrophy related to depression scores. It is possible that 2 components may be contributing to the relative hypoperfusion seen in AD patients with depressive symptoms. There is a structural component related to an actual loss of tissue in the ROIs that was seen equally in both groups and a functional component indexed by the lower perfusion that was seen on SPECT in the DSP group. It may be that subtracting out the structural component reduced sensitivity in the sample size we had available.
These imaging findings are consistent with previous reports in primary and secondary depression studies suggesting that these regions, along with the hippocampus and amygdala, may be involved in affect and emotional regulation.5,39,40 As for the anterior cingulate, the ROI group comparison indicated significantly lower perfusion in AD patients with depressive symptoms, but we could not confirm this finding with SPM analysis. No relation between the orbitofrontal cortex and depressive symptoms was evident in the current study even though this region has been implicated in major depression studies.41
Relations were further investigated with correlation analyses, which suggested an inverse correlation between CSDD (higher score indicates a greater severity of depressive symptoms) and perfusion in the superior prefrontal and anterior cingulate regions, in keeping with studies that have investigated depressive symptoms in AD. A previous study of AD reported an association between the presence of depressive symptoms (n = 19/53, 33%), defined as depressed mood including melancholia and sadness, and decreased normalized glucose metabolic rates in the superior frontal and left anterior cingulate cortices bilaterally.11 That study assessed depressive symptoms with the NPI subscale for depression. The NPI scale, while advantageous in that it quantifies depression in the context of other neuropsychiatric symptoms, lacks sensitivity and has a limited range for quantifying depressive symptoms.3 A similar study examined perfusion differences between AD patients with and without depression, using the Hamilton Depression Rating Scale42 and HMPAO-SPECT imaging with SPM analysis. It found perfusion differences in the anterior cingulate and precunei bilaterally in a small group of AD patients with depression (n = 8) compared with patients without depression (n = 35).9 Our study differs from this study in some important details. First, we used the CSDD,14 a rating scale specifically designed for elderly patients with dementia, which has been shown to have high interrater reliability, internal consistency and sensitivity.2,3 Our study is among the first to incorporate the use of the CSDD, which may be more sensitive for detecting depressive symptoms in an AD population16 (it is also currently being used in a National Institute of Mental Health clinical trial investigating treatment for depressive symptoms in AD).
The previous study did not provide adequate detail as to the method used to dichotomize patients on the basis of Hamilton Depression Rating Scale scores. Although patients were also interviewed by a psychiatrist, this interview was not used to assess the presence and severity of depression. We also used a novel quantitative ROI analysis method23 in addition to SPM analysis31 to test whether frontal regions chosen a priori would show lower perfusion in the DSP versus DSA groups. Last, our results are based on a larger sample of AD patients with depressive symptoms (n = 27), compared with the previous studies, which included a maximum of 19 patients with depressive symptoms.
Hypoperfusion of the bilateral anterior cingulate has previously been reported in AD patients with apathy34 and depression.9 Conversely, hyperactivation of the anterior cingulate has been reported in subjects without dementia in the depressed state.8 In one study, hyperactivation on electroencephalographic analysis of Brodmann's areas 24 and 32 in the pretreatment phase predicted favourable treatment response to antidepressants, suggesting that hyperactivation in the rostral cingulate may represent a compensatory reaction to depression.43 In the current study, anterior cingulate perfusion differences were found when with the ROI methodology but were not reproduced by SPM analysis with a threshold level of p < 0.01. It should be noted that, when the threshold level was lowered (p < 0.05), the anterior cingulate and the insula did differ between the 2 groups. These results and those of previous studies support the working model of primary depression suggesting that the rostral cingulate plays a key role in integrating the dorsal and ventral compartments and acts as a gateway through which limbic motivation influences goal-directed behaviour.7,34,43
The current study also supports a greater role for the right hemisphere in depressive symptoms associated with AD. Both SPM and ROI analyses revealed a stronger relation between lower right hemisphere perfusion and depressive symptoms. In general, depression is reported with lesions of either frontal lobe, whereas mania is more often reported with lesions to right frontal lobe. Left hemisphere and, specifically, left frontal damage have been associated most commonly with depressed mood with subjects showing a dysphoric reaction manifested by feelings of despair, hopelessness and anger.44 Whether depressive symptoms can follow right frontal lesions is more controversial. Some investigators have found depression related to lesions in the right frontal area,45 but these patients generally have more psychological symptoms overall, including irritability, loss of interest and difficulty in concentration. Apathy and depression are both common behavioural symptoms associated with AD; therefore, right hemisphere involvement may reflect the co-occurrence of 2 common behavioural symptoms in this group of patients. We attempted to address the co-occurrence of apathy in our sample by using the apathy subscore of the NPI.46 Apathy score did not correlate with perfusion; however, the limited range for scoring apathy on the NPI may reduce sensitivity with this sample size. More detailed assessment of apathy and depressive symptoms, using structured interviews in a larger AD sample, should be explored in further studies.
Depressive symptoms were present in 48% of AD patients. These results are consistent with previous studies that have used various different rating scales to assess depression in dementia.2,3 Participants in this sample did not differ on the presence of cerebrovascular risk factors or WM hyperintensities, 2 factors that can be associated with depression in dementia.47,48 The current study included only AD patients; additional research that includes a sample of healthy, age-and sex-matched elderly control subjects would provide additional information on the extent to which depressive symptoms in AD patients correlate with perfusion deficits when compared with a healthy sample. In addition, subjects in the 2 groups were not compared on a clinical scale for dementia severity, and as a result, it is possible that patients in the 2 groups could have had different dementia severities not picked up by their performance on the MMSE. It should also be noted that participants in this study did not receive a formal psychiatric assessment using a structured interview; therefore, a formal diagnosis of depression based on the criteria of the DSM-IV, text revised edition,49 could not be confirmed. The current study focused on the correlates of depressive symptoms in AD, which are specific and can effect functioning in both minor and major depression.50,51 Therefore, depressive symptoms seen in AD may be significant regardless of whether a patient meets criteria for major depressive disorder. Although there has been some suggestion that depressive symptoms in AD are a psychological reaction to the knowledge of having the disease, our findings support the possibility that the neuropathological processes involved in AD play a role in behavioural as well as more commonly reported cognitive dysfunction.
Acknowledgments
We acknowledge the Government of Ontario/Paul and Adelle Deacon Graduate Scholarships in Science and Technology, the L.C. Campbell Foundation, the Canadian Institutes of Health Research, Alzheimer Society of Canada, and the Alzheimer's Association for their support. We are grateful for the assistance received from Isabel Lam and Isabelle Guimont with data collection and database entry. We also thank Christopher Scott and Mario Masellis for their review and helpful comments.
Footnotes
Contributors: Ms. Levy-Cooperman and Drs. Burhan and Black designed the study. Mses. Levy-Cooperman and Kusano, Messrs. Rafi-Tari and Ramirez and Drs. Caldwell and Black acquired the data, which Ms. Levy-Cooperman and Drs. Burhan and Black analyzed. Mses. Levy-Cooperman and Kusano and Dr. Burhan wrote the article, which Drs. Burhan, Caldwell and Black and Messrs. Rafi-Tari and Ramirez reviewed. All authors gave final approval for publication.
Competing interests: None declared for Ms. Levy-Cooperman, Mr. Rafi-Tari, Ms. Kusano, Mr. Ramirez and Drs. Caldwell and Black. Dr. Burhan has received speaker fees from Pfizer.
Correspondence to: Dr. N. Levy-Cooperman, Cognitive Neurology Research Unit, A421, Sunnybrook Health Sciences Centre, 2075 Bayview Ave., Toronto ON M4N 3M5; fax 416 480-4552; naama.levy@sunnybrook.ca
References
- 1.Burns A, Jacoby R, Levy R. Behavioral abnormalities and psychiatric symptoms in Alzheimer's disease: preliminary findings. Int Psychogeriatr 1990;2:25-36. [DOI] [PubMed]
- 2.Wragg RE, Jeste DV. Overview of depression and psychosis in Alzheimer's disease. Am J Psychiatry 1989;146:577-87. [DOI] [PubMed]
- 3.Lyketsos CG, Lee HB. Diagnosis and treatment of depression in Alzheimer's disease. a practical update for the clinician. Dement Geriatr Cogn Disord 2004;17:55-64. [DOI] [PubMed]
- 4.Migliorelli R, Teson A, Sabe L, et al. Prevalence and correlates of dysthymia and major depression among patients with Alzheimer's disease. Am J Psychiatry 1995;152:37-44. [DOI] [PubMed]
- 5.Davidson RJ, Pizzagalli D, Nitschke JB, et al. Depression: perspectives from affective neuroscience. Annu Rev Psychol 2002;53:545-74. [DOI] [PubMed]
- 6.Mayberg HS. Depression and frontal-subcortical circuits:focus on prefrontal-limbic interactions. In: Lichter DG, Cummings JL, editors. Frontal-subcortical circuits in psychiatric and neurological disorders. New York: The Guilford Press; 2001. p. 177-206.
- 7.Seminowicz DA, Mayberg HS, McIntosh AR, et al. Limbic-frontal circuitry in major depression: a path modeling metanalysis. Neuroimage 2004;22:409-18. [DOI] [PubMed]
- 8.Mayberg HS, Brannan SK, Tekell JL, et al. Regional metabolic effects of fluoxetine in major depression: serial changes and relationship to clinical response. Biol Psychiatry 2000;48:830-43. [DOI] [PubMed]
- 9.Liao YC, Liu RS, Lee YC, et al. Selective hypoperfusion of anterior cingulate gyrus in depressed AD patients: a brain SPECT finding by statistical parametric mapping. Dement Geriatr Cogn Disord 2003;16:238-44. [DOI] [PubMed]
- 10.Halloran E, Prentice N, Murray CL, et al. Follow-up study of depression in the elderly. Clinical and SPECT data. Br J Psychiatry 1999;175:252-8. [DOI] [PubMed]
- 11.Hirono N, Mori E, Ishii K, et al. Frontal lobe hypometabolism and depression in Alzheimer's disease. Neurology 1998;50:380-3. [DOI] [PubMed]
- 12.Cummings JL, Ross W, Absher J, et al. Depressive symptoms in Alzheimer disease: assessment and determinants. Alzheimer Dis Assoc Disord 1995;9:87-93. [DOI] [PubMed]
- 13.Rosenberg PB, Mielke MM, Lyketsos CG. Caregiver assessment of patients' depression in Alzheimer disease: longitudinal analysis in a drug treatment study. Am J Geriatr Psychiatry 2005;13:822-6. [DOI] [PubMed]
- 14.Alexopoulos GS, Abrams RC, Young RC, et al. Cornell Scale for Depression in Dementia. Biol Psychiatry 1988;23:271-84. [DOI] [PubMed]
- 15.Yesavage JA, Brink TL, Rose TL, et al. Development and validation of a geriatric depression screening scale: a preliminary report. J Psychiatr Res 1982;17:37-49. [DOI] [PubMed]
- 16.Ballard C, Bannister C, Solis M, et al. The prevalence, associations and symptoms of depression amongst dementia sufferers. J Affect Disord 1996;36:135-44. [DOI] [PubMed]
- 17.McKhann G, Drachman D, Folstein M, et al. Clinical diagnosis of Alzheimer's disease: report of the NINCDS-ADRDA Work Group under the auspices of Department of Health and Human Services Task Force on Alzheimer's Disease. Neurology 1984;34:939-44. [DOI] [PubMed]
- 18.American Psychologiocal Association. Diagnostic and statistical manual of mental disorders. 4th ed. Washington: The Association; 1994.
- 19.Camargo EE. Brain SPECT in neurology and psychiatry. J Nucl Med 2001;42:611-23. [PubMed]
- 20.Wahlund LO, Barkhof F, Fazekas F, et al. A new rating scale for age-related white matter changes applicable to MRI and CT. Stroke 2001;32:1318-22. [DOI] [PubMed]
- 21.Folstein MF, Folstein SE, McHugh PR. “Mini-mental state.” A practical method for grading the cognitive state of patients for the clinician. J Psychiatr Res 1975;12:189-98. [DOI] [PubMed]
- 22.Chang LT. A method for attenuation correction in radionuclide computed tomography. IEEE Trans Nucl Sci 1978;25:638-43.
- 23.Lobaugh NJ, Caldwell CB, Black SE, et al. Three brain SPECT region-of-interest templates in elderly people: normative values, hemispheric asymmetries, and a comparison of single-and multihead cameras. J Nucl Med 2000;41:45-56. [PubMed]
- 24.Pickut BA, Dierckx RA, Dobbeleir A, et al. Validation of the cerebellum as a reference region for SPECT quantification in patients suffering from dementia of the Alzheimer type. Psychiatry Res 1999;90:103-12. [DOI] [PubMed]
- 25.Talbot PR, Lloyd JJ, Snowden JS, et al. Choice of reference region in the quantification of single-photon emission tomography in primary degenerative dementia. Eur J Nucl Med 1994;21:503-8. [DOI] [PubMed]
- 26.Callen DJ, Black SE, Caldwell CB. Limbic system perfusion in Alzheimer's disease measured by MRI-coregistered HMPAO SPECT. Eur J Nucl Med Mol Imaging 2002;29:899-906. [DOI] [PubMed]
- 27.Holman BL, Johnson KA, Gerada B, et al. The scintigraphic appearance of Alzheimer's disease: a prospective study using technetium-99m-HMPAO SPECT. J Nucl Med 1992;33:181-5. [PubMed]
- 28.Bencherif B, Stumpf MJ, Links JM, et al. Application of MRI-based partial-volume correction to the analysis of PET images of mu-opioid receptors using statistical parametric mapping. J Nucl Med 2004;45:402-8. [PubMed]
- 29.Kovacevic N, Lobaugh NJ, Bronskill MJ, et al. A robust method for extraction and automatic segmentation of brain images. Neuroimage 2002;17:1087-100. [DOI] [PubMed]
- 30.Friston KJ, Frith CD, Liddle PF, et al. Comparing functional (PET) images: the assessment of significant change. J Cereb Blood Flow Metab 1991;11:690-9. [DOI] [PubMed]
- 31.Friston KJ, Holmes AP, Worsley KJ, et al. Statistical parametric maps in functional imaging: a general linear approach. Hum Brain Mapp 1995;2:189-210.
- 32.Talairach J, Tournoux P. Co-planar stereotaxic atlas of the human brain. New York: Thieme Medical Publishers; 1988.
- 33.Brett M, Johnsrude IS, Owen AM. The problem of functional localization in the human brain. Nat Rev Neurosci 2002;3:243-9. [DOI] [PubMed]
- 34.Migneco O, Benoit M, Koulibaly PM, et al. Perfusion brain SPECT and statistical parametric mapping analysis indicate that apathy is a cingulate syndrome: a study in Alzheimer's disease and non-demented patients. Neuroimage 2001;13:896-902. [DOI] [PubMed]
- 35.Starkstein SE, Ingram L, Garau ML, et al. On the overlap between apathy and depression in dementia. J Neurol Neurosurg Psychiatry 2005;76:1070-4. [DOI] [PMC free article] [PubMed]
- 36.Starkstein SE, Jorge R, Mizrahi R, et al. A prospective longitudinal study of apathy in Alzheimer's disease. J Neurol Neurosurg Psychiatry 2006;77:8-11. [DOI] [PMC free article] [PubMed]
- 37.Landes AM, Sperry SD, Strauss ME. Prevalence of apathy, dysphoria, and depression in relation to dementia severity in Alzheimer's disease. J Neuropsychiatry Clin Neurosci 2005;17:342-9. [DOI] [PubMed]
- 38.Benoit M, Clairet S, Koulibaly PM, et al. Brain perfusion correlates of the apathy inventory dimensions of Alzheimer's disease. Int J Geriatr Psychiatry 2004;19:864-9. [DOI] [PubMed]
- 39.de Asis JM, Stern E, Alexopoulos GS, et al. Hippocampal and anterior cingulate activation deficits in patients with geriatric depression. Am J Psychiatry 2001;158:1321-3. [DOI] [PubMed]
- 40.Liotti M, Mayberg HS. The role of functional neuroimaging in the neuropsychology of depression. J Clin Exp Neuropsychol 2001;23:121-36. [DOI] [PubMed]
- 41.Bremner JD, Vythilingam M, Vermetten E, et al. Reduced volume of orbitofrontal cortex in major depression. Biol Psychiatry 2002;51:273-9. [DOI] [PubMed]
- 42.Hamilton M. A rating scale for depression. J Neurol Neurosurg Psychiatry 1960;23:56-62. [DOI] [PMC free article] [PubMed]
- 43.Pizzagalli D, Pascual-Marqui RD, Nitschke JB, et al. Anterior cingulate activity as a predictor of degree of treatment response in major depression: evidence from brain electrical tomography analysis. Am J Psychiatry 2001;158:405-15. [DOI] [PubMed]
- 44.Morris PL, Robinson RG, Raphael B, et al. Lesion location and poststroke depression. J Neuropsychiatry Clin Neurosci 1996;8:399-403. [DOI] [PubMed]
- 45.Stuss DT, Gow CA, Hetherington CR. “No longer Gage”: frontal lobe dysfunction and emotional changes. J Consult Clin Psychol 1992;60:349-59. [DOI] [PubMed]
- 46.Cummings JL, Mega M, Gray K, et al. The Neuropsychiatric Inventory: comprehensive assessment of psychopathology in dementia. Neurology 1994;44:2308-14. [DOI] [PubMed]
- 47.Oda K, Okubo Y, Ishida R, et al. Regional cerebral blood flow in depressed patients with white matter magnetic resonance hyperintensity. Biol Psychiatry 2003;53:150-6. [DOI] [PubMed]
- 48.Steffens DC, Bosworth HB, Provenzale JM, et al. Subcortical white matter lesions and functional impairment in geriatric depression. Depress Anxiety 2002;15:23-8. [DOI] [PubMed]
- 49.American Psychiatric Association. Diagnostic and statistical manual of mental disorders. 4th ed., text revised. Washington: The Association; 2000.
- 50.Starkstein SE, Jorge R, Mizrahi R, et al. The construct of minor and major depression in Alzheimer's disease. Am J Psychiatry 2005;162:2086-93. [DOI] [PubMed]
- 51.Starkstein SE, Mizrahi R, Garau L. Specificity of symptoms of depression in Alzheimer disease: a longitudinal analysis. Am J Geriatr Psychiatry 2005;13:802-7. [DOI] [PubMed]