

Abstract
We recently implicated a cluster of nine single nucleotide polymorphisms from seven cholesterol-related genes in the risk of Alzheimer’s disease (AD) in a European cohort, and we proposed calculating an aggregate cholesterol-related genetic score (CREGS) to characterize a person’s risk. In a separate study, we found that apolipoprotein E (APOE) ε4 gene dose, an established AD risk factor, was correlated with fluorodeoxyglucose (FDG) positron emission tomography (PET) measurements of hypometabolism in AD-affected brain regions in a cognitively normal American cohort, and we proposed using PET as a presymptomatic endophenotype to help assess putative modifiers of AD risk. Thus, the objective in the present study is to determine whether CREGS is related to PET measurements of hypometabolism in AD-affected brain regions. DNA and PET data from 141 cognitively normal late middle-aged APOE ε4 homozygotes, heterozygotes and non-carriers were analyzed to evaluate the relationship between CREGS and regional PET measurements. Cholesterol-related genetic risk scores were associated with hypometabolism in AD-affected brain regions, even when controlling for the effects of APOE ε4 gene dose. The results support the role of cholesterol-related genes in the predisposition to AD, and support the value of neuroimaging in the presymptomatic assessment of putative modifiers of AD risk.
Keywords: Alzheimer’s Disease, Genetics, Cholesterol, Positron Emission Tomography, Endophenotype
INTRODUCTION
Alzheimer’s disease (AD) is the most common form of dementia in older people. Heritability estimates suggest that genetic variations may account for about 80% of AD risk (Gatz et al., 2006), and researchers continue to search for these genetic risk factors in the hope of contributing to the scientific understanding, early detection and tracking, diagnosis, treatment and prevention of this disorder (Papassotiropoulos et al., 2006). To date, the best established genetic risk factors for AD include relatively rare mutations of the presenilin 1 (PS1), presenilin 2 (PS2), and amyloid precursor protein (APP) genes (http://www.molgen.ua.ac.be/ADMutations/) and a common variant of the apolipoprotein E (APOE) gene (Corder et al., 1993; Farrer et al., 1997). Whereas the PS1, PS2, and APP mutations account for many cases of AD with dementia onset before age 60 and autosomal dominant inheritance, the APOE ε4 allele increases the susceptibility to (but is not sufficient to cause) many cases of AD with dementia onset after age 60. APOE ε4 gene dose--the number of ε4 alleles in a person’s APOE genotype--is associated with a higher risk of late-onset AD and a younger median age at dementia onset (Corder et al., 1993).
While variants of the APOE protein have been shown to differentially influence the accumulation of amyloid in the formation of neuritic plaques (Wisniewski et al., 1994), the phosphorylation of tau in the formation of neurofibrillary tangles (Strittmatter et al., 1994), the vulnerability of neurons to AD pathology (Miyata and Smith, 1996), and other suggested pathogenic processes (Mahley and Huang, 2006), APOE is best known as the major transporter of cholesterol in the blood and central nervous system (Mahley, 1988). The role of APOE in the risk of AD and several other neurobiological, epidemiological, and clinical findings have raised the possibility that dysregulated cholesterol levels may increase the risk of AD, as well as the possibility that statins and other cholesterol-modifying medications may be helpful in the disorder’s treatment and prevention (Shobab et al., 2005; Wolozin, 2004; Wolozin et al., 2007).
In a European case-control study, we recently investigated a cluster of cholesterol-related genes in the risk of AD, focusing on cholesterol- and lipid-related single nucleotide polymorphisms [SNPs] implicated in prior single-gene association studies of AD, and used a set-association method to characterize the combined contribution of the candidate SNPs (Papassotiropoulos et al., 2005). This compound genetic association study implicated a cluster of nine SNPs from seven genes (including the APOE ε4 allele) in the risk of AD, which were used to calculate an aggregate cholesterol-related genetic risk score (CREGS) in each subject. In this sample, CREGS distinguished between 74% of AD cases and controls when the APOE ε4 allele was included in the calculation, CREGS distinguished between 66% of cases and controls when the APOE ε4 allele was not included in the calculation, and the APOE ε4 allele alone distinguished between 66% of cases and controls. Supporting the biological relevance of the proposed score, we also reported a significant positive correlation between CREGS and cerebrospinal fluid levels of 24S-hydoxycholesterol, the major catabolite of cholesterol in the central nervous system, in an independent European sample of non-demented elderly subjects (Papassotiropoulos et al., 2005).
In an American fluorodeoxyglucose (FDG) positron emission tomography (PET) study of cognitively normal, late-middle-aged persons, we demonstrated significant correlations between APOE ε4 gene dose (i.e., three levels of genetic risk for AD) and hypometabolism specifically in the posterior cingulate, precuneus, parietal, temporal, and frontal brain regions previously shown to be preferentially affected in patients with Alzheimer’s dementia (Reiman et al., 2005). Based on these findings, we proposed using PET to provide a quantitative presymptomatic endophenotype—a measurable feature that is more closely related to disease-susceptibility than the clinical syndrome itself—to help assess the individual and aggregate effects of putative modifiers of AD risk.
In this study, we used baseline PET data from our cognitively normal American samples to determine the extent to which CREGS is correlated with hypometabolism in AD-affected brain regions, further suggesting the value of brain imaging in the pre-symptomatic assessment of putative modifiers of AD risk. Correlations were performed with and without the contribution of APOE ε4 gene dose to the calculation of each person’s CREGS.
METHODS
Subjects
Newspaper ads were used to recruit cognitively normal volunteers 47–68 years of age who reported a first-degree family history of probable AD, understood they would not receive any information about their APOE genotype, provided their informed consent, and were studied under guidelines approved by the human subjects committees at Banner Good Samaritan Medical Center and the Mayo Clinic. Venous blood samples were drawn and APOE genotypes characterized with analysis involving restriction-fragment-length polymorphisms (Crook et al., 1994).
Clinical ratings, neuropsychological tests, volumetric magnetic resonance imaging (MRI), and fluorodeoxyglucose PET were performed in APOE ε4 homozygotes, heterozygotes, and noncarriers as previously described (Reiman et al., 1996; Reiman et al., 2005). At the time of their initial visit, the subjects had scores of at least 28 on the Folstein Mini-Mental State Examination (MMSE) and less than 10 on the Hamilton Depression Rating Scale (HAM-D), did not satisfy criteria for a current psychiatric disorder using a structured psychiatric interview, did not use centrally acting medications for at least 2 weeks before their PET session, and had a normal neurological exam. At the time of study enrollment, each APOE ε4 heterozygote (all with the ε3/ε4 genotype) and ε4 noncarrier was individually matched to an ε4 homozygote for his or her gender, age (within 3 years), and educational level (within 2 years).
To correlate CREGS with lower regional CMRgl, CREGS was calculated and PET images analyzed in 141 of the 160 cognitively normal persons with two copies, one copy and no copies of the APOE ε4 allele who had participated in a previous study (Reiman et al., 2005) (DNA from the other 19 subjects in this study was not available for the computation of CREGS). Participants included 29 APOE ε4 homozygotes, 42 ε4 heterozygotes (all with the ε3/ε4 genotype) and 70 ε4 non-carriers who were individually matched for their gender, age (within 3 years) and educational level (within 2 years).
Brain Imaging
Volumetric T1-weighted MRI and PET were performed as previously described (Reiman et al., 1996; Reiman et al., 2005). PET was performed with the 951/31 ECAT scanner (Siemens, Knoxville, Tenn.), a transmission scan, the intravenous injection of 10 mCi of 18F-fluorodeoxyglucose a 60-min dynamic sequence of emission scans as the subjects, who had fasted for at least 4 hours, lay quietly with eyes closed in a darkened room. Regional analyses were performed using the PET images (counts relative to the whole brain uptake) acquired during the last 30 min.
An automated algorithm (SPM, Wellcome Department of Cognitive Neurology, London, U.K.) was used to linearly and non-linearly deform each person’s PET image into the coordinates of a standard brain atlas, normalize for absolute measurements using proportionate scaling, and generate statistical parametric maps of the correlations between CREGS and lower regional CMRgl with and without including the contribution of APOE ε4 gene dose in the calculation of CREGS (P<0.005, uncorrected for multiple comparisons). This statistical map was superimposed onto a map of CMRgl reductions in previously studied patients with Alzheimer’s dementia (Alexander et al., 2002) and a spatially standardized, volume-rendered MRI. Significance levels were then adjusted for the number of resolution elements in the AD-affected posterior cingulate, precuneus, parietotemporal, and frontal brain regions postulated to be preferentially affected in cognitively normal persons at genetic risk for AD using the small-volume correction procedure in SPM. In subsequent sub-group analyses, statistical parametric maps were then generated and superimposed onto the map of AD-related CMRgl reductions to determine whether observed correlations between CREGS and lower CMRgl in AD-related regions were present in the aggregate APOE ε4 carrier subgroup (with and without the contribution of APOE ε4 gene dose in the CREGS score) and in the homozygote, heterozygote and non-carrier subgroups.
CREGS
Calculation of each person’s CREGS was based on a cluster of polymorphisms associated with AD in an exclusive European sample as previously described (Papassotiropoulos et al., 2005). The SUMSTAT program (http://www.genemapping.cn/sumstat.html), which was developed for statistical analysis with the set-association method (Hoh et al., 2001), was used for the definition of the polymorphic cluster. The set-association method uses relevant sources of genetic information, such as allelic association and Hardy-Weinberg disequilibrium (HWD). Information is combined over multiple markers and genes in the genome, quality control is improved by trimming SNPs with high HWD values, and permutation testing limits the overall false-positive rate (Hoh et al., 2001). For each candidate marker, two chi-square statistics were computed: one for the allelic association with disease status and one for the HWD in cases. The products of these statistics for each marker were then ranked from largest to smallest. Progressively larger sums (Sj) are then calculated over the j largest chi-square statistics. For example, S1 is the largest chi-square statistic of association. S2 is the sum of the largest and second largest. S3 is the sum of the largest, second largest and third largest, etc. The empirical significance level (Pj) for each Sj is evaluated by permutation methods carried-out under the null hypothesis of no genetic association with AD. The smallest of the empirical significance levels (i.e. Pjmin) identifies the best and most parsimonious model predicting disease status. Importantly, the set-association method has been shown to be of superior power compared with conventional locus-by-locus analyses and to successfully capture statistical interactions between genes (Hoh et al., 2001; Kim et al., 2003; Maitland-van der Zee et al., 2005; Ott and Hoh, 2003; Papassotiropoulos et al., 2005).
After detection of the AD-associated SNPs, calculation of the CREGS was based upon the set-association statistic for each significant SNP. Thus, CREGS mirrors the number of individual risk alleles weighted by the contribution of each risk allele to the overall cluster. Hence, CREGS would be 0 in persons not carrying any risk allele; CREGS would be equal to the corresponding set-association statistic for the particular SNP (e.g., 1.8 for APOE4, 0.3 for OLR1) in persons carrying only one risk allele; and CREGS would be computed by adding the set-association statistics of the corresponding SNPs in person with two or more risk alleles. Depending on whether the APOE genotype was included to or excluded from CREGS, the maximal possible CREGS value is 2.5 (APOE4 not included), 4.3 (APOE4 included using the dominant model, which accounts for the presence or absence of any ε4 alleles in the person’s APOE genotype) and 6.1 (APOE4 included using the additive model, which accounts for the number of ε4 in the person’s APOE genotype [i.e., his or her APOE gene dose]). An adjustment for a possible protective role of the APOE2 allele was not performed because APOE2 failed to be part of the gene cluster exclusively of APOE4 in the European population.
SNPs in the APOE, SOAT1, APOE 5’-untranslated region, OLR1, CYP46A1, LPL, LIPA and APOA4 genes, which were implicated and used to calculate CREGS in our previous study, were used to calculate CREGS in the current study. APOE genotyping was performed as previously described. SNPs rs1044925 (SOAT1), rs405509 (APOE 5’-untranslated region), rs1050286 (OLR1), rs754203 (CYP46A1), rs268 (LPL), rs13500 (LIPA), rs328 (LPL) and rs5104 (APOA4) were analyzed by pyrosequencing™. The following forward, reverse and sequencing primers were used for these SNPs: 5’-biotin-CAT TTC CTT GAA ACC AAT CAC A-3’, 5’-TGA CTT CTC TTG AAT TAT TTT GCA-3’, 5’-TGC AGA CTA GTG AGT CTG TA-3’ for rs1044925; 5’-AGG TGG GGC ATA GAG GTC TT-3’, 5’-biotin-ATT CAT CCA GGC ACA GGA AA-3’, 5’-ACA CCT CGC CCA GT-3’ for rs405509; 5’-biotin-TGC TAT AAT TCC GAA ACA TAC AAG A-3’, 5’-TCC ATC TGT TTC TAT TCA GCG A-3’, 5’-ATT TGC ATA CCT GGC T-3’ for rs1050286; 5’-AAC GAG TTT CCC GTC CCA GA-3’, 5’-biotin-TCG GCA AGT GAG CAA CAG G-3’, 5’-CTG GGG CCC AGG AGC-3’ for rs754203; 5’-biotin-TGC TTG AGT TGT AGA AAG AAC CG-3’, 5’-GAG AAC GAG TCT TCA GGT ACA TTT T-3’, 5’-TCT TTT GGC TCT GAC TTT-3’ for rs268; 5’-ATA CAC CTG CTT CAC GTC CC-3’, 5’-biotin-CGC CCT GCC TAT ATT AAC CA-3’, 5’-CAT TTC CTT ACA ATA CTG TC-3’ for rs13500; 5’-biotin-ATT TGC AGA AAG GAA AGG CA-3’, 5’-GGA TGC CCA GTC AGC TTT AG-3’, 5’-GAA TGC TCA CCA GCC-3’ for rs328; 5’-CAA CCT GCG AGA GCT TCA G-3’, 5’-biotin-ACT CTC TCC ATG CGC TGT G-3’, 5’-CGC ACC CAG GTC A-3’ for rs5104.
Each person’s CREGS was calculated as the risk-weighted summation of his or her implicated SNPs, with or without the contribution of APOE ε4 gene dose, as follows:
APOE4 dose effect (1.78 × 0, 1, or 2)
+ SOAT1 effect (rs1044925 C allele) + (1.51 × 0 or 1)
+ APOE promoter effect (rs405509 A allele) + (0.30 × 0 or 1)
+ OLR1 effect (rs1050286 T allele) + (0.28 × 0 or 1)
+ CYP46 effect (rs754203 TT genotype) + (0.19 × 0 or 1)
+ LPL effect (rs268 TT genotype) + (0.07 × 0 or 1)
+ LIPA effect (rs13500 T allele) + (0.07 × 0 or 1)
+ LPL effect (rs328 GG genotype) + (0.06 × 0 or 1)
+ APOA4 effect (rs5104 AA genotype) + (0.05 × 0 or 1)
RESULTS
Correlations between CREGS and Hypometabolism in AD-Affected Brain Regions
To test the hypothesis that higher CREGS is associated with lower measurements of the cerebral metabolic rate for glucose (CMRgl) in AD-affected brain regions, we analyzed data from 141 cognitively normal subjects whose PET images and DNA remained available from a recent study. The subjects had APOE ε4-inclusive mean ± SD CREGS of 2.77 ± 1.62 and APOE ε4-exclusive CREGS of 1.51 ± 0.78. As expected, the distribution of CREGS-related SNPS in our American sample (which was primarily Caucasian) was not significantly different from that in the previously studied European sample. The baseline demographic features, clinical ratings, neuropsychological test scores, and APOE ε4-inclusive and APOE ε4-exclusive CREGS of the APOE ε4 homozygotes, heterozygotes and noncarriers in this study are summarized and compared using analysis of variance (ANOVA) in Table 1. (Modestly significant differences among these three subject groups in their low HAM-D and Complex Figure Copy Test scores did not survive correction for multiple comparisons.)
TABLE 1.
Characteristics, Clinical Ratings, and Neuropsychological Scores of the Subjects Studied with PET
| ε4 NON-CARRIERS N = 70 (mean ± SD) | ε4 HETEROZYGOTES N = 42 (mean ± SD) | ε4 HOMOZYGOTES N= 29 (mean ± SD) | ANOVA p-value | |
|---|---|---|---|---|
| Age (years) | 56.9 ± 4.6 | 55.8 ± 3.9 | 55.6 ± 5.1 | 0.29 |
| Gender (F / M) | 42/28 | 28/14 | 20/9 | 0.63 |
| Years of Education | 15.9 ± 1.5 | 15.4 ± 1.6 | 15.9 ± 1.3 | 0.14 |
| MMSE | 29.7 ± 0.6 | 29.9 ± 0.4 | 29.8 ± 0.6 | 0.40 |
| HAM-D | 2.25 ± 2.7 | 1.7 ± 1.8 | 3.5 ± 3.8 | 0.03 |
| AVLT | ||||
| Total Learning | 47.4 ± 8.0 | 48.6 ± 9.5 | 50.1 ± 9.8 | 0.37 |
| Short Term Memory | 9.4 ± 2.6 | 10.4 ± 2.4 | 10.2 ± 3.4 | 0.18 |
| Long Term Memory | 8.7 ± 3.0 | 10.0 ± 2.7 | 9.8 ± 3.3 | 0.08 |
| Complex Figure Test | ||||
| Copy | 35.0 ± 1.5 | 33.8 ± 2.9 | 34.3 ± 1.9 | 0.02 |
| Recall | 18.5 ± 6.1 | 18.8 ± 6.0 | 17.9 ± 6.6 | 0.83 |
| Boston Naming Test | 57.1 ± 3.3 | 56.7 ± 3.0 | 57.3 ± 2.5 | 0.64 |
| WAIS-R | ||||
| Information | 12.1 ± 2.2 | 12.3 ± 2.1 | 11.2 ± 2.0 | 0.43 |
| Digit Span | 11.3 ± 2.2 | 11.4 ± 2.8 | 11.2 ± 2.8 | 0.94 |
| Block Design | 12.1 ± 2.7 | 12.2 ± 2.7 | 12.3 ± 2.5 | 0.92 |
| Arithmetic | 12.1 ± 2.3 | 12.5 ± 2.2 | 11.5 ± 2.8 | 0.25 |
| Similarities | 12.6 ± 2.2 | 12.6 ± 2.0 | 12.1 ± 1.7 | 0.50 |
| COWAT | 44.0 ± 11.0 | 42.8 ± 11.4 | 47.3 ± 9.1 | 0.79 |
| WMS-R Orientation | 13.8 ± 0.4 | 13.9 ± 0.4 | 13.8 ± 0.4 | 0.51 |
| CREGS, including APOE e4 gene dose | 1.5 ± 0.8 | 3.3 ± 0.8 | 5.1 ± 0.8 | <0.001 |
| CREGS, excluding APOE e4 gene dose | 1.5 ± 0.8 | 1.6 ± 0.8 | 1.5 ± 0.8 | 0.86 |
Abbreviations: MMSE, Mini-Mental State Exam; HAM-D, Hamilton Depression Rating Scale; AVLT, Auditory Verbal learning Test; WAIS-R, Wechsler Adult Intelligence Scale-Revised; COWAT, Controlled Oral Word Association Test; WMS-R, Wechsler Memory Scale-Revised; CREGS, aggregate cholesterol-related genetic score.
As predicted, CREGS was significantly correlated with lower regional-to-whole brain PET measurements of CMRgl in the posterior cingulate, precuneus, parietotemporal, and frontal regions previously implicated in patients with Alzheimer’s dementia (Figure 1a; Table 2a). Supporting the relevance of CREGS to the risk of AD, the genetic risk scores continued to be significantly correlated with lower regional-to-whole brain CMRgl in the precuneus, parietotemporal, and frontal regions when the contribution of APOE ε4 gene dose was excluded (Figure 1b, Table 2b). Indeed, CREGS was not significantly associated with lower CMRgl outside the vicinity of the AD-affected brain regions and was not significantly associated with higher CMRgl anywhere in the brain, whether or not the contribution of APOE ε4 gene dose were included.
Figure 1a. Correlations between CREGS, Including the Contribution of APOE ε4 Gene Dose, and Lower CMRgl in Alzheimer’s-Affected Brain Regions.
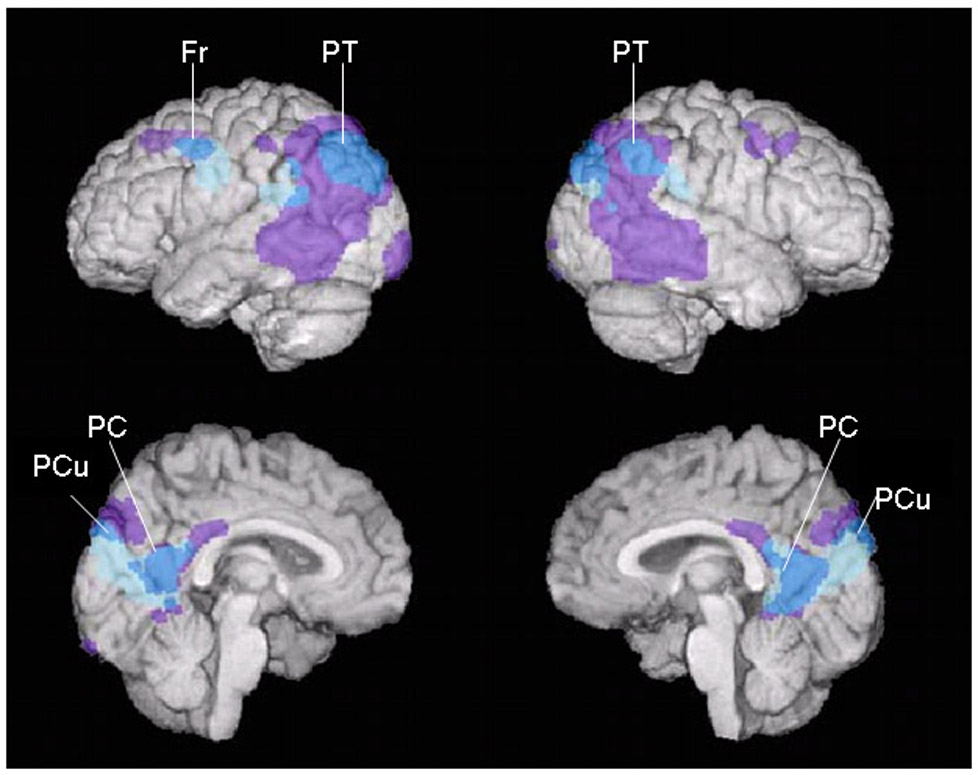
Negative correlations between CREGS, a) including and b) excluding the contribution APOE ε4 gene dose, and lower CMRgl (shown in blue, p<0.005, uncorrected for multiple comparisons) in cognitively normal, late middle-aged persons are projected onto the lateral and medial surfaces of the left and right cerebral hemispheres and shown in relationship to brain regions preferentially affected in an earlier PET study of patients with Alzheimer’s dementia (Alexander et al., 2002) (shown in purple). a) Significant correlations between APOE ε4-inclusive CREGS and lower CMRgl were observed bilaterally in the posterior cingulate (PC), precuneus (PCu), and parietotemporal (PT) cortex bilaterally and in the left frontal (F) cortex. b) Significant correlations between APOE ε4-exclusive CREGS and lower CMRgl were observed bilaterally in the precuneus (PCu) and parietotemporal (PT) cortex bilaterally and in the left frontal (F) cortex.
TABLE 2.
| TABLE 2a Location and Magnitude of Most Significant Correlations between Cholesterol Related Genetic Risk Scores, Including APOE ε4 Gene Dose Effects, and Lower Regional-to-Whole Brain CMRgl* | |||||
|---|---|---|---|---|---|
| Brain Region | Atlas Coordinates† | Correlation Coefficient | P-Value+ | ||
| X | Y | Z | |||
| Millimeters | |||||
| Posterior Cingulate | 0 | −57 | 19 | −0.31 | 7.9 × 10⁻⁵ |
| Precuneus | 6 | −74 | 33 | −0.29 | 2.0 × 10⁻⁴ |
| Left Parietotemporal | −46 | −66 | 42 | −0.38 | 2.3 × 10⁻⁶ |
| Right Parietotemporal | 38 | −74 | 35 | −0.29 | 2.2 × 10⁻⁴ |
| Left Frontal | −42 | −2 | 31 | −0.25 | 1.3 × 10⁻³ |
| TABLE 2b Location and Magnitude of Most Significant Correlations between Cholesterol Related Genetic Risk Scores, Excluding APOE ε4 Gene Dose Effects, and Lower Regional-to-Whole Brain CMRgl | |||||
|---|---|---|---|---|---|
| Brain Region | Atlas Coordinates† | Correlation Coefficient | P-Value+ | ||
| X | Y | Z | |||
| Millimeters | |||||
| Precuneus | −2 | −76 | 39 | −0.29 | 2.8 × 10⁻⁴ |
| Left Parietotemporal | −67 | −32 | 16 | −0.24 | 1.8 × 10⁻³ |
| −57 | −49 | 30 | −0.23 | 3.4 × 10⁻³ | |
| −51 | −62 | 43 | −0.25 | 1.7 × 10⁻³ | |
| Right Parietal | 63 | −22 | 23 | −0.28 | 3.1 × 10⁻⁴ |
| 61 | −39 | 41 | −0.26 | 1.0 × 10⁻³ | |
| 57 | −56 | 45 | −0.25 | 1.7 × 10⁻³ | |
| Left Frontal | −48 | 10 | 36 | −0.22 | 4.3 × 10⁻³ |
The data were extracted from voxels associated with the most significant correlations in each of the brain regions previously found to be associated with abnormally low CMRgl in patients with Alzheimer’s dementia (Alexander et al., 2002).
The reported significance levels are uncorrected for multiple comparisons; each of these correlations remained significant (p<0.05) after correcting for multiple comparisons in the relevant AD-related search regions.
The coordinates were obtained from Talairach and Tournoux (1998). X is the distance to the right (+) or left (−) of the midline, Y is the distance anterior (+) or posterior (−) to the anterior commissure, and Z is the distance superior (+) or inferior (−) to a horizontal plane through the anterior and posterior commissures.
The reported significance levels are uncorrected for multiple comparisons; correlations in the precuneus and left frontal regions remained significant (p<0.05) after correcting for multiple comparisons in the relevant AD-related search regions.
The coordinates were obtained from Talairach and Tournoux (1998). X is the distance to the right (+) or left (−) of the midline, Y is the distance anterior (+) or posterior (−) to the anterior commissure, and Z is the distance superior (+) or inferior (−) to a horizontal plane through the anterior and posterior commissures.
Figure 1b. Correlations between CREGS, Excluding the Contribution of APOE ε4 Gene Dose, and Lower CMRgl in Alzheimer’s-Affected Brain Regions.

Negative correlations between CREGS, a) including and b) excluding the contribution APOE ε4 gene dose, and lower CMRgl (shown in blue, p<0.005, uncorrected for multiple comparisons) in cognitively normal, late middle-aged persons are projected onto the lateral and medial surfaces of the left and right cerebral hemispheres and shown in relationship to brain regions preferentially affected in an earlier PET study of patients with Alzheimer’s dementia (Alexander et al., 2002) (shown in purple). a) Significant correlations between APOE ε4-inclusive CREGS and lower CMRgl were observed bilaterally in the posterior cingulate (PC), precuneus (PCu), and parietotemporal (PT) cortex bilaterally and in the left frontal (F) cortex. b) Significant correlations between APOE ε4-exclusive CREGS and lower CMRgl were observed bilaterally in the precuneus (PCu) and parietotemporal (PT) cortex bilaterally and in the left frontal (F) cortex.
In the subsequent sub-group analyses, CREGS was significantly correlated with lower regional-to-whole brain CMRgl in AD-affected precuneus and parietotemporal regions in the aggregate APOE ε4 carrier group (even when the contribution of APOE ε4 gene dose was excluded); CREGS was significantly correlated with lower regional-to-whole brain CMRgl in AD-affected precuneus and parietotemporal regions in the ε4 homozygotes, with lower regional-to-whole brain CMRgl in AD-affected posterior cingulate, precuneus, parietotemporal, and frontal regions in the ε4 heterozygotes, and with lower regional-to-whole brain CMRgl in AD-affected parietal and frontal regions in the ε4 non-carriers (p < 0.005, uncorrected for multiple comparisons); and CREGS was not significantly associated with increased CMRgl in AD-affected regions in any of these sub-groups. (Brain maps corresponding to these subsequent sub-group comparisons are available upon request.) As noted in Table 1, the APOE ε4 homozygotes, heterozygotes, and non-carriers did not differ significantly in their APOE ε4-exclusive CREGS (ANOVA, p=0.86), suggesting that the significant correlations between APOE ε4-exclusive CREGS and regional hypometabolism were not indirectly affected by the subjects’ APOE genotype.
DISCUSSION
This study examined inverse correlations between CREGS, a putative measure of AD risk, and PET measurements of regional CMRgl in cognitively normal late-middle-aged persons. CREGS was significantly correlated with lower CMRgl in brain regions previously found to be preferentially affected by AD. Supporting the biological relevance of these findings to the risk of AD, these inverse correlations were confined to the vicinity of AD-affected regions, were present whether or not the contribution of APOE ε4 gene dose was included in the calculation of CREGS, and were observed in separate analyses of the aggregate APOE ε4 carrier, homozygote, heterozygote and non-carrier groups despite the smaller sizes of these genetic sub-groups. Together, our findings provide further support for the role of brain imaging in the presymptomatic assessment of putative AD risk modifiers, provide further support for the role of a cluster of cholesterol-related genes in the risk of AD, and may support the promising role of cholesterol-lowering treatments in the primary prevention of AD.
In our prior study (Papassotiropoulos et al., 2005), we used a set-association algorithm (Hoh et al., 2001) to examine the combined contribution of different candidate SNPs to the risk of AD, an approach that may be more suitable to the genetic study of common multigenic disorders than the traditional analysis of individual SNPs. Capitalizing on the evidence that an impairment in cholesterol metabolism may contribute to the risk of AD, we implicated a cluster of 9 cholesterol related genes in the risk of AD, proposed the calculation of an aggregate genetic risk score, and supported the biological relevance of this aggregate score by showing its relationship to cerebrospinal fluid levels of the major metabolite of cholesterol in the brain. The brain imaging findings from our current study supports the computation of aggregate genetic scores for the risk of AD.
Whereas we previously proposed the calculation of CREGS from the study of European subjects, we now support the relevance of this genetic risk score in an independent sample of American subjects. Our findings underscore the importance and validity of CREGS in particular and aggregate genetic risk scores in general. Indeed, it may be possible to extend the calculation of aggregate genetic risk scores to include these and other yet unrecognized genes which have been estimated to account for about 80% of AD risk, and to extend this approach to the calculation of aggregate genetic risk scores for other common multigenic disorders.
As we previously proposed, PET could provide a quantitative presymptomatic endophenotype to help evaluate the individual and aggregate effects of putative genetic and non-genetic modifiers of AD risk (Reiman et al., 2005). As a complement to observational studies of older Alzheimer’s dementia cases and controls, our proposed endophenotype could provide prospective evaluation of putative risk modifiers, help address the potentially confounding effects of differential survival related to the putative risk modifier (e.g., the differential effects of CREGS on mortality due to cardiovascular and cerebrovascular causes), provide information about the individual or aggregate effects of the putative risk factor (e.g., CREGS with or without the contribution of APOE ε4 gene dose, as shown here, or in conjunction with other putative risk modifiers, such as serum cholesterol levels or statin treatment), and could permit the accurate measurement and real-time evaluation of a putative risk factor (e.g., mid-life serum cholesterol levels, which may be more strongly associated with AD risk and neuropathology than late-life levels) (Kivipelto and Solomon, 2006) years before the onset of symptoms. As a complement to prospective cohort studies, the endophenotype could provide information about the putative risk modifier without having to study many more healthy subjects or wait many years to determine whether or when they show clinical decline.
This study adds to the evidence that impairments in cholesterol metabolism may increase the AD pathology and risk, and it supports that possibility that cholesterol-lowering therapies may help in the treatment and prevention of this disorder (Puglielli et al., 2003; Shobab et al., 2005; Wolozin, 2004). Experimental studies suggest that cholesterol may promote the accumulation of the amyloid-β peptide (Aβ) and amyloid plaques, a cardinal feature of AD (Refolo et al., 2000; Sparks et al., 1994), and that cholesterol-lowering therapies may reduce the accumulation of Aβ and amyloid plaques (Fassbender et al., 2001; Howland et al., 1998; Hutter-Paier et al., 2004; Refolo et al., 2001; Sparks, 1996). Several longitudinal studies (Kalmijn et al., 2000; Kivipelto et al., 2002; Notkola et al., 1998; Whitmer et al., 2005), but not all (Tan et al., 2003), and one neuropathological study (Pappolla et al., 2003) have reported an association between higher mid-life serum cholesterol levels and a higher risk of subsequent AD. However, epidemiological studies investigating the relationship between late-life serum cholesterol levels and subsequent AD risk have generated conflicting findings (Kivipelto and Solomon, 2006; Mielke et al., 2005), suggesting that our proposed PET endophenotype might have particular value in the assessment of putative mid-life risk factors for AD, reducing the possibility of potentially confounding effects of older age or pre-clinical AD on the putative risk factor and reducing the time and number of subjects needed in a longitudinal study. Similarly, one longitudinal and several cross-sectional studies (Jick et al., 2000; Wolozin et al., 2000) have reported an association between the use of cholesterol-lowering hydroxymetholglutaryl-coenzyme A (HMG-CoA) reductase inhibitors (statins) and a lower risk of AD. However, other observational studies have failed to find an association on the incidence of dementia and have raised the possibility of potentially confounding effect of AD on statin treatment (Rockwood, 2006; Zandi et al., 2005), suggesting that our proposed PET endophenotype might be able to address this confound by permitting the assessment of putative AD protective factors many years before the possible onset of AD. A small clinical trial has suggested that the statin atorvastatin may slow clinical decline in patients with AD and multi-center clinical trials of this treatment are now in progress (Sparks et al., 2005). Findings from a recent prospective study using a large population database to examine the association between different statins and the risk of dementia suggested that, in particular, simvastatin may be associated with a reduced rate of incident dementia (Wolozin et al., 2007). To date, randomized clinical trials of non-demented elderly persons have failed to detect an association between statin use and a lower risk of cognitive decline or dementia, but these studies were not primarily intended to investigate the effects of treatment on AD risk (Shepherd et al., 2002). For example, subject selection criteria, clinical ratings, and neuropsychological assessments were not optimally suited for an AD prevention study, the number of subjects and study duration appear to be associated with limited statistical power, and the benefits of statins in late-middle-aged persons have not been studied.
Just as we have proposed the use of brain imaging as a presymptomatic endophenotype to assess the effects of putative AD risk modifiers, we have proposed the development of brain imaging measurements as presymptomatic surrogate therapeutic endpoints to help in the cost-effective evaluation of putative primary prevention therapies (Reiman et al., 2001). Indeed, we have suggested how PET could be used in cognitively normal APOE ε4 carriers to evaluate the effectiveness of putative primary prevention therapies to slow down progressive regional CMRgl declines without having to study thousands of healthy late-middle-aged persons or wait many years to determine whether or when persons in the clinical trial develop symptoms. Since an even modestly effective therapy would have a major impact on the incidence of AD, since cholesterol-lowering treatments have other benefits on the heart and brain, and since these treatments tend to be well tolerated and commonly used, we suggest the value of using PET to evaluate the efficacy of cholesterol-reducing treatments in the primary prevention of AD.
ACKNOWLEDGMENTS
This study was presented in July 2006 at the 10th International Conference on Alzheimer’s Disease and Related Disorders, Madrid. It was supported by the National Institute of Mental Health (RO1 MH57899 to EMR), the National Institute on Aging (EMR, P30 AG19610), the Arizona Alzheimer’s Consortium (Arizona Department of Health Services to EMR), the Banner Alzheimer Foundation (to EMR), the Mayo Clinic Foundation (to RJC), the Swiss National Science Foundation (PP00B-68859 to AP), the Helmut-Horten Stiftung (to AP), the EMDO Stiftung (to AP), and the Novartis Foundation for Biomedical Research (to AP). We thank Christine Burns, Sandra Yee-Benedetto, Carolyn Barbieri, Alisa Domb, Sandra Goodwin, Debbie Intorcia, Barbara Knight, Leslie Mullen, Anita Prouty, Oded Smilovici, Cole Reschke, Desiree Van Egmond, Katy Venisnik, Dr. Jessica Langbaum and Dr. Michael Hutton for their technical assistance.
Footnotes
Publisher's Disclaimer: This is a PDF file of an unedited manuscript that has been accepted for publication. As a service to our customers we are providing this early version of the manuscript. The manuscript will undergo copyediting, typesetting, and review of the resulting proof before it is published in its final citable form. Please note that during the production process errors may be discovered which could affect the content, and all legal disclaimers that apply to the journal pertain.
Reference List
- Alexander GE, Chen K, Pietrini P, Rapoport SI, Reiman EM. Longitudinal PET evaluation of cerebral metabolic decline in dementia: A potential outcome measure in Alzheimer's disease Treatment Studies. Am.J.Psychiatry. 2002;159:738–745. doi: 10.1176/appi.ajp.159.5.738. [DOI] [PubMed] [Google Scholar]
- Corder EH, Saunders AM, Strittmatter WJ, Schmechel DE, Gaskell PC, Small GW, Roses AD, Haines JL, Pericak-Vance MA. Gene dose of apolipoprotein E type 4 allele and the risk of Alzheimer's disease in late onset families. Science. 1993;261:921–923. doi: 10.1126/science.8346443. [DOI] [PubMed] [Google Scholar]
- Crook R, Hardy J, Duff K. Single-day apolipoprotein E genotyping. J.Neurosci.Methods. 1994;53:125–127. doi: 10.1016/0165-0270(94)90168-6. [DOI] [PubMed] [Google Scholar]
- Farrer LA, Cupples LA, Haines JL, Hyman B, Kukull WA, Mayeux R, Myers RH, Pericak-Vance MA, Risch N, Van Duijn CM. Effects of age, sex, and ethnicity on the association between apolipoprotein E genotype and Alzheimer disease. A meta-analysis. APOE and Alzheimer Disease Meta Analysis Consortium. JAMA. 1997;278:1349–1356. [PubMed] [Google Scholar]
- Fassbender K, Simons M, Bergmann C, Stroick M, Lutjohann D, Keller P, Runz H, Kuhl S, Bertsch T, Von BK, Hennerici M, Beyreuther K, Hartmann T. Simvastatin strongly reduces levels of Alzheimer's disease beta -amyloid peptides Abeta 42 and Abeta 40 in vitro and in vivo. Proc.Natl.Acad Sci U.S.A. 2001;98:5856–5861. doi: 10.1073/pnas.081620098. [DOI] [PMC free article] [PubMed] [Google Scholar]
- Gatz M, Reynolds CA, Fratiglioni L, Johansson B, Mortimer JA, Berg S, Fiske A, Pedersen NL. Role of genes and environments for explaining Alzheimer disease. Arch Gen Psychiatry. 2006;63:168–174. doi: 10.1001/archpsyc.63.2.168. [DOI] [PubMed] [Google Scholar]
- Hoh J, Wille A, Ott J. Trimming, weighting, and grouping SNPs in human case-control association studies. Genome Res. 2001;11:2115–2119. doi: 10.1101/gr.204001. [DOI] [PMC free article] [PubMed] [Google Scholar]
- Howland DS, Trusko SP, Savage MJ, Reaume AG, Lang DM, Hirsch JD, Maeda N, Siman R, Greenberg BD, Scott RW, Flood DG. Modulation of secreted beta-amyloid precursor protein and amyloid beta-peptide in brain by cholesterol. J Biol.Chem. 1998;273:16576–16582. doi: 10.1074/jbc.273.26.16576. [DOI] [PubMed] [Google Scholar]
- Hutter-Paier B, Huttunen HJ, Puglielli L, Eckman CB, Kim DY, Hofmeister A, Moir RD, Domnitz SB, Frosch MP, Windisch M, Kovacs DM. The ACAT inhibitor CP-113,818 markedly reduces amyloid pathology in a mouse model of Alzheimer's disease. Neuron. 2004;44:227–238. doi: 10.1016/j.neuron.2004.08.043. [DOI] [PubMed] [Google Scholar]
- Jick H, Zornberg GL, Jick SS, Seshadri S, Drachman DA. Statins and the risk of dementia. Lancet. 2000;356:1627–1631. doi: 10.1016/s0140-6736(00)03155-x. [DOI] [PubMed] [Google Scholar]
- Kalmijn S, Foley D, White L, Burchfiel CM, Curb JD, Petrovitch H, Ross GW, Havlik RJ, Launer LJ. Metabolic cardiovascular syndrome and risk of dementia in Japanese-American elderly men. The Honolulu-Asia aging study. Arterioscler.Thromb.Vasc.Biol. 2000;20:2255–2260. doi: 10.1161/01.atv.20.10.2255. [DOI] [PubMed] [Google Scholar]
- Kim S, Zhang K, Sun F. Detecting susceptibility genes in case-control studies using set association. BMC Genet. 2003;4 Suppl 1:S9. doi: 10.1186/1471-2156-4-S1-S9. [DOI] [PMC free article] [PubMed] [Google Scholar]
- Kivipelto M, Helkala EL, Laakso MP, Hanninen T, Hallikainen M, Alhainen K, Iivonen S, Mannermaa A, Tuomilehto J, Nissinen A, Soininen H. Apolipoprotein E epsilon4 allele, elevated midlife total cholesterol level, and high midlife systolic blood pressure are independent risk factors for late-life Alzheimer disease. Ann Intern.Med. 2002;137:149–155. doi: 10.7326/0003-4819-137-3-200208060-00006. [DOI] [PubMed] [Google Scholar]
- Kivipelto M, Solomon A. Cholesterol as a risk factor for Alzheimer's disease - epidemiological evidence. Acta Neurol.Scand.Suppl. 2006;185:50–57. doi: 10.1111/j.1600-0404.2006.00685.x. [DOI] [PubMed] [Google Scholar]
- Mahley RW. Apolipoprotein E: cholesterol transport protein with expanding role in cell biology. Science. 1988;240:622–630. doi: 10.1126/science.3283935. [DOI] [PubMed] [Google Scholar]
- Mahley RW, Huang Y. Apolipoprotein (apo) E4 and Alzheimer's disease: unique conformational and biophysical properties of apoE4 can modulate neuropathology. Acta Neurol.Scand.Suppl. 2006;185:8–14. doi: 10.1111/j.1600-0404.2006.00679.x. [DOI] [PubMed] [Google Scholar]
- Maitland-van der Zee AH, Turner ST, Schwartz GL, Chapman AB, Klungel OH, Boerwinkle E. A multilocus approach to the antihypertensive pharmacogenetics of hydrochlorothiazide. Pharmacogenet.Genomics. 2005;15:287–293. doi: 10.1097/01213011-200505000-00003. [DOI] [PubMed] [Google Scholar]
- Mielke MM, Zandi PP, Sjogren M, Gustafson D, Ostling S, Steen B, Skoog I. High total cholesterol levels in late life associated with a reduced risk of dementia. Neurology. 2005;64:1689–1695. doi: 10.1212/01.WNL.0000161870.78572.A5. [DOI] [PubMed] [Google Scholar]
- Miyata M, Smith JD. Apolipoprotein E allele-specific antioxidant activity and effects on cytotoxicity by oxidative insults and beta-amyloid peptides. Nat.Genet. 1996;14:55–61. doi: 10.1038/ng0996-55. [DOI] [PubMed] [Google Scholar]
- Notkola IL, Sulkava R, Pekkanen J, Erkinjuntti T, Ehnholm C, Kivinen P, Tuomilehto J, Nissinen A. Serum total cholesterol, apolipoprotein E epsilon 4 allele, and Alzheimer's disease. Neuroepidemiology. 1998;17:14–20. doi: 10.1159/000026149. [DOI] [PubMed] [Google Scholar]
- Ott J, Hoh J. Set association analysis of SNP case-control and microarray data. J.Comput.Biol. 2003;10:569–574. doi: 10.1089/10665270360688192. [DOI] [PubMed] [Google Scholar]
- Papassotiropoulos A, Fountoulakis M, Dunckley T, Stephan DA, Reiman EM. Genetics, transcriptomics, and proteomics of Alzheimer's disease. J.Clin.Psychiatry. 2006;67:652–670. doi: 10.4088/jcp.v67n0418. [DOI] [PMC free article] [PubMed] [Google Scholar]
- Papassotiropoulos A, Wollmer MA, Tsolaki M, Brunner F, Molyva D, Lutjohann D, Nitsch RM, Hock C. A cluster of cholesterol-related genes confers susceptibility for Alzheimer's disease. J.Clin.Psychiatry. 2005;66:940–947. [PubMed] [Google Scholar]
- Pappolla MA, Bryant-Thomas TK, Herbert D, Pacheco J, Fabra GM, Manjon M, Girones X, Henry TL, Matsubara E, Zambon D, Wolozin B, Sano M, Cruz-Sanchez FF, Thal LJ, Petanceska SS, Refolo LM. Mild hypercholesterolemia is an early risk factor for the development of Alzheimer amyloid pathology. Neurology. 2003;61:199–205. doi: 10.1212/01.wnl.0000070182.02537.84. [DOI] [PubMed] [Google Scholar]
- Puglielli L, Tanzi RE, Kovacs DM. Alzheimer's disease: the cholesterol connection. Nat.Neurosci. 2003;6:345–351. doi: 10.1038/nn0403-345. [DOI] [PubMed] [Google Scholar]
- Refolo LM, Malester B, LaFrancois J, Bryant-Thomas T, Wang R, Tint GS, Sambamurti K, Duff K, Pappolla MA. Hypercholesterolemia accelerates the Alzheimer's amyloid pathology in a transgenic mouse model. Neurobiol.Dis. 2000;7:321–331. doi: 10.1006/nbdi.2000.0304. [DOI] [PubMed] [Google Scholar]
- Refolo LM, Pappolla MA, LaFrancois J, Malester B, Schmidt SD, Thomas-Bryant T, Tint GS, Wang R, Mercken M, Petanceska SS, Duff KE. A cholesterol-lowering drug reduces beta-amyloid pathology in a transgenic mouse model of Alzheimer's disease. Neurobiol.Dis. 2001;8:890–899. doi: 10.1006/nbdi.2001.0422. [DOI] [PubMed] [Google Scholar]
- Reiman EM, Caselli RJ, Chen K, Alexander GE, Bandy D, Frost J. Declining brain activity in cognitively normal apolipoprotein E epsilon 4 heterozygotes: A foundation for using positron emission tomography to efficiently test treatments to prevent Alzheimer's disease. Proc.Natl.Acad.Sci.U.S.A. 2001;98:3334–3339. doi: 10.1073/pnas.061509598. [DOI] [PMC free article] [PubMed] [Google Scholar]
- Reiman EM, Caselli RJ, Yun LS, Chen K, Bandy D, Minoshima S, Thibodeau SN, Osborne D. Preclinical evidence of Alzheimer's disease in persons homozygous for the epsilon 4 allele for apolipoprotein E. N.Engl.J.Med. 1996;334:752–758. doi: 10.1056/NEJM199603213341202. [DOI] [PubMed] [Google Scholar]
- Reiman EM, Chen K, Alexander GE, Caselli RJ, Bandy D, Osborne D, Saunders AM, Hardy J. Correlations between apolipoprotein E epsilon4 gene dose and brain-imaging measurements of regional hypometabolism. Proc.Natl.Acad.Sci.U.S.A. 2005;102:8299–8302. doi: 10.1073/pnas.0500579102. [DOI] [PMC free article] [PubMed] [Google Scholar]
- Rockwood K. Epidemiological and clinical trials evidence about a preventive role for statins in Alzheimer's disease. Acta Neurol.Scand.Suppl. 2006;185:71–77. doi: 10.1111/j.1600-0404.2006.00688.x. [DOI] [PubMed] [Google Scholar]
- Shepherd J, Blauw GJ, Murphy MB, Bollen EL, Buckley BM, Cobbe SM, Ford I, Gaw A, Hyland M, Jukema JW, Kamper AM, Macfarlane PW, Meinders AE, Norrie J, Packard CJ, Perry IJ, Stott DJ, Sweeney BJ, Twomey C, Westendorp RG. Pravastatin in elderly individuals at risk of vascular disease (PROSPER): a randomised controlled trial. Lancet. 2002;360:1623–1630. doi: 10.1016/s0140-6736(02)11600-x. [DOI] [PubMed] [Google Scholar]
- Shobab LA, Hsiung GY, Feldman HH. Cholesterol in Alzheimer's disease. Lancet Neurol. 2005;4:841–852. doi: 10.1016/S1474-4422(05)70248-9. [DOI] [PubMed] [Google Scholar]
- Sparks DL. Intraneuronal beta-amyloid immunoreactivity in the CNS. Neurobiol.Aging. 1996;17:291–299. doi: 10.1016/0197-4580(95)02067-5. [DOI] [PubMed] [Google Scholar]
- Sparks DL, Sabbagh MN, Connor DJ, Lopez J, Launer LJ, Browne P, Wasser D, Johnson-Traver S, Lochhead J, Ziolwolski C. Atorvastatin for the treatment of mild to moderate Alzheimer disease: preliminary results. Arch.Neurol. 2005;62:753–757. doi: 10.1001/archneur.62.5.753. [DOI] [PubMed] [Google Scholar]
- Sparks DL, Scheff SW, Hunsaker JC, III, Liu H, Landers T, Gross DR. Induction of Alzheimer-like beta-amyloid immunoreactivity in the brains of rabbits with dietary cholesterol. Exp.Neurol. 1994;126:88–94. doi: 10.1006/exnr.1994.1044. [DOI] [PubMed] [Google Scholar]
- Strittmatter WJ, Weisgraber KH, Goedert M, Saunders AM, Huang D, Corder EH, Dong LM, Jakes R, Alberts MJ, Gilbert JR. Hypothesis: microtubule instability and paired helical filament formation in the Alzheimer disease brain are related to apolipoprotein E genotype. Exp.Neurol. 1994;125:163–171. doi: 10.1006/exnr.1994.1019. [DOI] [PubMed] [Google Scholar]
- Tan ZS, Seshadri S, Beiser A, Wilson PW, Kiel DP, Tocco M, D'Agostino RB, Wolf PA. Plasma total cholesterol level as a risk factor for Alzheimer disease: the Framingham Study. Arch Intern.Med. 2003;163:1053–1057. doi: 10.1001/archinte.163.9.1053. [DOI] [PubMed] [Google Scholar]
- Whitmer RA, Sidney S, Selby J, Johnston SC, Yaffe K. Midlife cardiovascular risk factors and risk of dementia in late life. Neurology. 2005;64:277–281. doi: 10.1212/01.WNL.0000149519.47454.F2. [DOI] [PubMed] [Google Scholar]
- Wisniewski T, Castano EM, Golabek A, Vogel T, Frangione B. Acceleration of Alzheimer's fibril formation by apolipoprotein E in vitro. Am J Pathol. 1994;145:1030–1035. [PMC free article] [PubMed] [Google Scholar]
- Wolozin B. Cholesterol and the biology of Alzheimer's disease. Neuron. 2004;41:7–10. doi: 10.1016/s0896-6273(03)00840-7. [DOI] [PubMed] [Google Scholar]
- Wolozin B, Kellman W, Ruosseau P, Celesia GG, Siegel G. Decreased prevalence of Alzheimer disease associated with 3-hydroxy-3-methyglutaryl coenzyme A reductase inhibitors. Arch.Neurol. 2000;57:1439–1443. doi: 10.1001/archneur.57.10.1439. [DOI] [PubMed] [Google Scholar]
- Wolozin B, Wang SW, Li NC, Lee A, Lee TA, Kazis LE. Simvastatin is associated with a reduced incidence of dementia and Parkinson's disease. BMC Medicine. 2007;5:1–28. doi: 10.1186/1741-7015-5-20. [DOI] [PMC free article] [PubMed] [Google Scholar]
- Zandi PP, Sparks DL, Khachaturian AS, Tschanz J, Norton M, Steinberg M, Welsh-Bohmer KA, Breitner JC. Do statins reduce risk of incident dementia and Alzheimer disease? The Cache County Study. Arch.Gen.Psychiatry. 2005;62:217–224. doi: 10.1001/archpsyc.62.2.217. [DOI] [PubMed] [Google Scholar]