

Summary
S-Adenosylhomocysteine (AdoHcy) hydrolase deficiency has been proven in a human only once, in a recently described Croatian boy. Here we report the clinical course and biochemical abnormalities of the younger brother of this proband. This younger brother has the same two mutations in the gene encoding AdoHcy hydrolase, and has been monitored since birth. We report, as well, outcomes during therapy for both patients. The information obtained suggests that the disease starts in utero and is characterized primarily by neuromuscular symptomatology (hypotonia, sluggishness, psychomotor delay, absent tendon reflexes, delayed myelination). The laboratory abnormalities are markedly increased creatine kinase and elevated aminotransferases, as well as specific amino acid aberrations that pinpoint the aetiology. The latter include, most importantly, markedly elevated plasma AdoHcy. Plasma S-adenosylmethionine (AdoMet) is also elevated, as is methionine (although the hypermethioninaemia may be absent or nonsignificant in the first weeks of life). The disease seems to be at least to some extent treatable, as shown by improved myelination and psychomotor development during dietary methionine restriction and supplementation with creatine and phosphatidylcholine.
S-Adenosylhomocysteine (AdoHcy) hydrolase (adenosylhomocysteinase, EC 3.3.1.1) is the enzyme that catalyses hydrolysis of AdoHcy to adenosine and homocysteine (De La Haba and Cantoni 1959). Its deficiency (McKusick 180960) had been proven in a human only once, in a Croatian boy we reported recently (Barić et al 2004). The index patient presented with myopathy, characterized by hypotonia and delayed psychomotor development from birth, abnormally slow brain myelination (noted in MRI studies of the brain at 12.7 months) and mild hepatitis-like findings. The main biochemical abnormalities were marked increases of creatine kinase and aminotransferases, prolonged prothrombin time, low albumin, and specific amino acid aberrations indicative of the aetiology: hypermethioninaemia with almost normal total plasma homocysteine and very elevated plasma AdoHcy (up to 150 × normal) and S-Adenosylmethionine (AdoMet) (up to 30 times normal). Activity of AdoHcy hydrolase was severely diminished: about 3% of control in liver and 9−15% of the mean controls in fibroblasts and red blood cells. The specific metabolic defect had been identified and the patient started on therapy by age 12.8 months. Here we report a second patient (patient 2), a brother of the proband. Patient 2 has been monitored since birth and was started on therapy at age 3.4 months, by which time the diagnosis of AdoHcy hydrolase deficiency had been clearly established. We report, also, outcomes during therapy in both patients.
METHODS
Metabolite assays
Amino acids were measured by ion-exchange chromatography using a Biochrom 20 plus analyser (Amersham Pharmacia Biotech, Little Chalfont, Buckinghamshire, UK). Plasma total homocysteine (tHcy) was analysed using an IMX Abbott analyser (Abbott Park, Illinois, USA). Plasma methionine and tHcy were measured also by capillary gas chromatography–mass spectrometry, as were cystathionine, total cysteine (tCys), dimethylglycine, and sarcosine (N-methylglycine) (Allen et al 1993; Stabler et al 1987, 1993). Plasma and cerebrospinal fluid (CSF) AdoMet and AdoHcy (Capdevila and Wagner 1998) and plasma phosphatidylcholine, free choline and betaine (Koc et al 2002) were assayed as previously described. Guanidino compounds were measured by cation-exchange chromatography with post-column derivatization (Marescau et al 1992; Schulze et al 2001). Purines and pyrimidines were analysed using the method of Morris and Simmonds (1985).
Assays of AdoHcy hydrolase activity
Assays of red blood cell haemolysates were carried out in the direction of synthesis of AdoHcy by a modification of the method of Hershfield and co-workers (Hershfield et al 1979), as described previously (Barić et al 2004). During the course of the present studies we found that there had been an error in the units in which the AdoHcy hydrolase activities in fibroblast extracts were expressed in the former paper (Barić et al 2004). The units should correctly have been stated as nmol/min per mg protein instead of nmol/h per mg protein. Protein concentrations were determined by the method of Bradford (1976).
Global DNA methylation studies
Genome-wide leukocyte DNA methylation was quantitated in packed blood cells (Pogribny et al 1999).
Gene analysis
DNA was extracted from blood samples using standard procedures (Sambrook et al 1989). A PCR-based approach was used to amplify the coding regions of the AdoHcy hydrolase gene, using primers derived from introns flanking all of its exons. Primers sequences were as previously reported (Barić et al 2004). Additional primers used were: 5′-GGGGCATGCTGGGACTTGTA (for amplification of exon 1), 5′-CGTCTTCTTCCCTGGCTGAA (for exon 2) and 5′-AGCGTCCCTGGTGCTTTTGA (for exon 3). Amplified genomic DNA was either subcloned as previously described (Marchuk et al 1991) or submitted directly to the sequencing service (MWG-Biotech, Ebersberg, Germany). Sequencing chromatograms were analysed using the CHROMAS software (Conor McCarthy, Southport, Australia).
MR imaging and 1H MRS studies
These studies were performed using a 2.0 T system (Gyrex Prestige, GEMS/Elscint, USA). The younger brother's third scan (done at age 10.5 months) was performed on Symens Symphony 1.5 T. T2-weighted imaging was used to locate the voxels for the 1H MRS studies. The selection of voxel position in the estimated centre of the occipital subcortical white matter was determined visually by examining the MR images in three orthogonal planes (sagittal, coronal, and axial) to define a 1.5 × 1.5 × 1.5 cm volume of interest. Proton MR spectroscopy was performed by using point-resolved spectroscopy (PRESS) sequence (1500/54[TR/TE]) with 100 averages.
Informed consent was obtained from the parents for all studies done in the patients.
CASE REPORT: PRETREATMENT PERIOD IN PATIENT 2, THE YOUNGER BROTHER
Patient 2 is the brother of the proband, whose main abnormalities are described in the introductory part. Further details have been published previously (Barić et al 2004). The parents are healthy and unrelated. They declined prenatal diagnosis. The pregnancy and delivery were normal, although the umbilical cord was around the neck. Birth length was 50 cm, weight 3880 g and head circumference 36 cm. Muscular hypotonia was present at birth and increased in the following few days when the boy had moderate respiratory difficulties and superficial breathing. Chest radiography showed left side parahilar infiltration. The symptoms resolved following parenteral hydration, oxygen and antibiotic therapy. The boy had mild bilateral hip dysplasia and limited leg abduction. He was referred to the Department of Pediatrics, University Hospital Centre, Zagreb at age 15 days. At that time spontaneous mobility was reduced. There was generalized muscular hypotonia. Tendon reflexes, Moro's reflex and automatic walk were absent. Plantar grasp was weak. Until age 3 months 11 days, when therapy was started, the boy was hypotonic and psychomotor development was delayed in several respects. Head control, in particular elevation, was weak. Primitive reflexes were weak and easily exhausted. Tendon reflexes could not be elicited. Although he started visual fixing and smiling at about 1 month of age, the boy was sluggish and his interest in his surroundings was generally poor. He had convergent strabismus, sometimes with rapid uncontrolled eye movements. The dominant impression was that psychomotor delay was becoming more evident during the last weeks of the pretreatment period. However, in his mother's opinion he has generally fared better than his brother at corresponding ages. The boy's growth was normal.
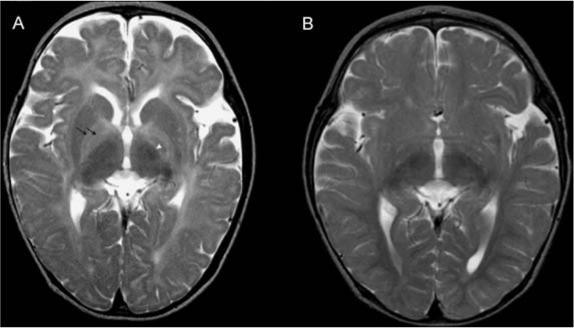
Brain ultrasound in the neonatal period was normal. Brain MR imaging at ages 26 days and months showed delayed myelination and development of frontotemporal atrophy (Figures 1A and 1B). White-matter brain MR spectroscopy on both occasions revealed a small reduction of choline and, to a lesser extent, of creatine/phosphocreatine (Cr/PCr) with approximately equal amounts of Cr/PCr and choline, so there was only a small reduction in the choline to Cr/PCr ratio. The amount of N-acetylaspartate was also mildly diminished.
Figure 1.
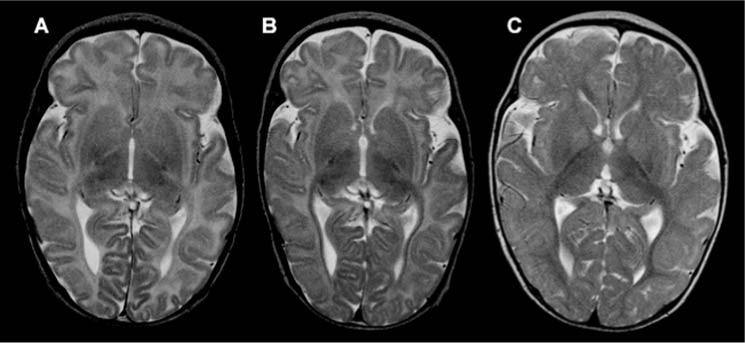
Brain MRI changes in patient 2. (A) Brain MRI (axial T2) at age 26 days showing diffuse hyperintensity of white matter corresponding to unmyelinated axons. This pattern, with an almost unmyelinated posterior part of internal capsule, would be characteristic for a fetus in the last two weeks of pregnancy or for a newborn in the first days of life. (B) Approximately the same slice at age 3.5 months showed almost no progress in myelination in comparison to the previous examination. In addition, enlargement of subarachnoidal spaces, in particular around frontal and temporal cortex, pointed to mild to moderate brain atrophy. (C) Brain MRI at 10.5 months, about 7 months after start of therapy, revealed a myelination pattern close to the normal age-related pattern (only some intragyral fibers are unmyelinated), pointing to significant acceleration of myelination following therapy. In addition, in comparison with the previous scan, atrophic changes are less evident
In contrast to his brother, patient 2 has had neither clinical nor biochemical signs clearly due to impaired liver function. Mild elevations of serum aminotransferases are considered to be attributable to muscle disease, although some contribution to these elevations due to liver involvement cannot be completely excluded. His liver showed only slight hypoechogenicity during ultrasound study. Liver biopsy was therefore not indicated. Pretreatment muscle biopsy was considered but was not done in view of the findings in the older brother. Electrocardiogram and heart ultrasound were normal.
Laboratory abnormalities included markedly elevated creatine kinase, ranging from 10 860 to 16 800 U/L during the first 14 days post partum, and 687 and 1163 U/L on days 47 and 92 (reference range <228; in the first days of life up to 5 to 10 times higher). Alanine aminotransferase (ALT) was 156 and 201 U/L up to day 14 and 75 and 67 U/L on days 47 and 92 (reference range for neonates up to 54; thereafter 14−55). Aspartate aminotransferase (AST) was 346 and 253 U/L up to day 14 and 64 and 71 U/L on days 47 and 92 (reference ranges; up to 140 during first 5 days post partum; 35−100 for older neonates; thereafter 11−40). The only abnormalities of blood clotting tests were transient elevation of D-dimers and diminished factor VII concentration. Normal findings included complete blood cell count, basic urine chemistry and sediment, acid–base balance, urinary organic acids, serum sodium, potassium, glucose, urea, creatinine, uric acid, γ-glutamyltranspeptidase, alkaline phosphatase, lactate, and plasma amino acids except for methionine (for methionine see Table 1 and Figure 2).
Table 1.
Metabolite concentrations in plasma before and during therapy
|
Patient 1 |
Patient 2 |
|||
|---|---|---|---|---|
| Metabolite | Before therapy | During therapy | Before therapy | During therapy |
| Methionine (13−45 μmol/L) | 657 ± 130 (4) | 16 ± 18 (37) | 44 ± 28 (6) | 7 ± 2 (11) |
| AdoMet (93 ± 16 nmol/L) | 2971 | 716 ± 711 (31) | 817 ± 595 (5) | 114 ± 71 (11) |
| AdoHcy (15−45 nmol/L) | 5044 | 912 ± 903 (31) | 329 ± 160 (5) | 56 ± 38 (11) |
| tHcy (3.3−8.3 μmol/L) | 14.5 | 3.0 ± 1 (31) | 5.2 ± 0.5 (4) | 3.1 ± 0.4 (11) |
| Cysta (44−342 nmol/L) | 552 | 105 ± 42 (31) | 398 ± 129 (4) | 84 ± 17 (11) |
| tCys (203−369 μmol/L) | 244 | 186 ± 24 (31) | 280 ± 49 (4) | 181 ± 12 (11) |
| Sarcosine (0.6−2.7 μmol/L) | 7.5 | 13 ± 7 (31) | 4.1 ± 1.4 (4) | 5.1 ± 2.5 (11) |
| PtdCho (1500−2559 μmol/L) | 780 | 1234 ± 277 (18) | 1610 ± 127 (3) | 1035 |
| Choline (10.7−19.7 μmol/L) | 7.8 | 13 ± 5 (18) | 17 ± 5 (3) | 13.1 |
| Betaine (26−67 μmol/L) | 211 | 488 ± 237 (18) | 43 ± 12 (3) | 70.9 |
| DMGa (1.4−5.3 μmol/L) | 11.8 | 32 ± 19 (31) | 11.7 ± 3.2 (4) | 14.7 ± 6.3 (11) |
| GAAb (0.2−1.46 μmol/L) | 6.1, 2.1 | 2.3 | 1.4 | 2.14 |
| Creatine (50−124 μmol/L) | 528, 42 | 1419 | 109 | 236 |
The reference range for each metabolite is shown in parentheses. Each metabolite concentration is presented as a mean ± SD. For metabolites assayed at more than one occasion the number of assays is indicated in parentheses. In calculating the means listed, the values for samples obtained within a few days after onset of dietary methionine restriction (age 3.5 months for patient 2; 13 months for patient 1) are omitted because these were clearly intermediate
Dimethylglycine
Guanidinoacetic acid
Figure 2.
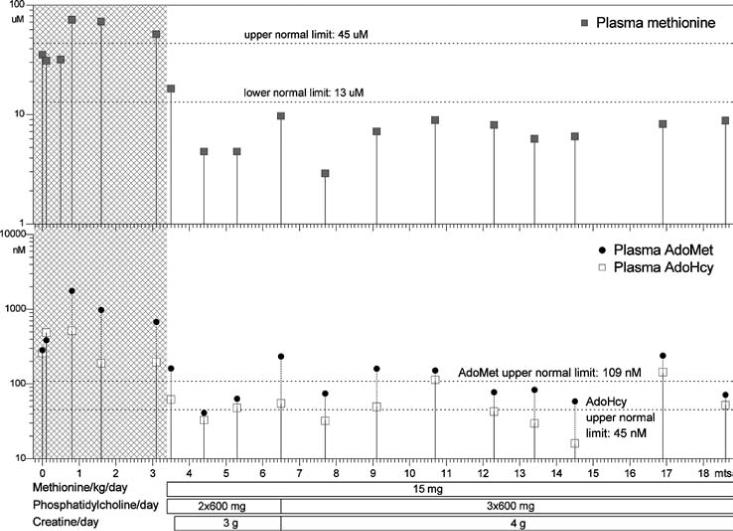
Patient 2: plasma methionine, S-adenosylmethionine and S-adenosylhomocysteine concentrations. Ages, in months, are shown on the horizontal axis. Concentrations are shown on the vertical axes in logarithmic scales. The horizontal bars below the graphs show treatment changes. Grey areas indicate time prior to treatment
Because of markedly elevated methionine, AdoMet, and AdoHcy in plasma of patient 1 during the initial assays (methionine at 8 months; AdoMet and AdoHcy at 11 months), assays of these compounds were carried out in duplicate cord blood samples from patient 2. The results were compared with the 95% confidence intervals reported previously (Guerra-Shinohara et al 2004). The methionine concentration was 35 and 35.5 μmol/L, at most very slightly elevated (reference 95% CI: 25.4−27.3 μmol/L). AdoMet was slightly elevated at 316 and 249 nmol/L (reference 95% CI: 164−190 nmol/L). AdoHcy was markedly elevated at 279 and 239 nmol/L (reference 95% CI: 48−57 nmol/L). During the first 3 months post partum until dietary methionine restriction was started at age 102 days, plasma methionine did not rise above 74 μmol/L, whereas AdoMet and, more markedly, AdoHcy were both consistently elevated (Figure 2 and Table 1). Prior to treatment, plasma tHcy in patient 2 was within the reference range for his age, whereas in patient 1 it had been very slightly above (Table 1) (Reddy 1997; Vilaseca et al 1997). Pretreatment values for other metabolites related to diminished AdoHcy hydrolase activity are also shown in Table 1.
In CSF drawn at age 3.4 months, cells, protein, and lactate were normal, as was methionine: 3.5 μmol/L (control range 2.7−5.7). CSF AdoMet was at about the upper normal limit: 507 and 528 nmol/L (duplicate assay; reference range, 376 ± 122 for ages 1 month to 14 years). CSF AdoHcy was only slightly, if at all, elevated: 16 and 41 nmol/L (duplicate assay; reference range 12.1 ± 10.8 for ages 1 month to 14 years), perhaps reflecting the relatively low expression of AdoHcy hydrolase in brain (see http://symatlas.gnf.org/SymAtlas/).
Patient 2 had approximately 15% of the mean control AdoHcy hydrolase activity in haemolysates of red blood cells, very close to the value for patient 1 (17%) determined in the same series of assays (Table 2). The latter value agrees with the previously measured activity in patient 1 (15% of the midpoint of the control range) (Barić et al 2004).
Table 2.
AdoHcy hydrolase activities in red blood cell haemolysates
| Activity | Patient 1 | Patient 2 | Controls |
|---|---|---|---|
| nmol/h per mg protein | 0.99 ± 0.33 (4) | 0.90 ± 0.17 (4) | 5.93 ± 1.11 (16) |
| % of control | 17 | 15 | 100 |
Packed blood cells were prepared from blood samples drawn on the same day and stored frozen for no more than 25 days until assayed. When the samples were drawn, patient 1 was aged 4 years, patient 2 was aged 18 months, and the four control subjects were aged 4 years, 36 months, 20 months and 4 months. Red blood cell haemolysates were prepared and those from each individual were assayed 4 times. Results are listed as mean ± SD (number of assays). Means for the control subjects were, respectively, 5.60 ± 0.27 (4), 4.83 ± 0.56 (4), 7.43 ± 0.71 (4), and 5.88 ± 0.74 (4)
The global leukocyte DNA methylation was investigated by the extent of incorporation of [3H]dCTP into DNA of packed blood cells (Figure 3). In the assay, incorporation is directly proportional to the number of nonmethylated sites in the DNA. Therefore, decreased incorporation into the DNA as found in the patient signifies that his DNA had fewer nonmethylated sites (i.e. it was more extensively methylated) than DNA of controls. The same has been previously shown in his older brother (Figure 3) (Barić et al 2004).
Figure 3.
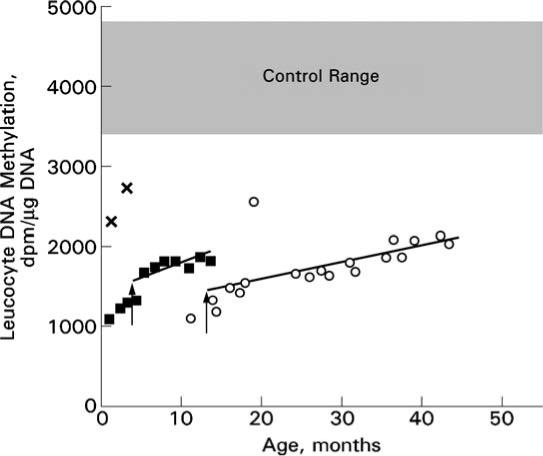
Global leukocyte DNA methylation in patients 1 and 2 before and during therapy. The extents of incorporation of [3H]dCTP into DNA of packed blood cells at various ages are indicated by open circles for patient 1 and solid squares for patient 2. In this assay, the greater the pre-existing extent of methylation of the DNA, the less the incorporation of radioactivity. Thus, the lower the value observed, the greater is the extent of methylation of the sample being studied. The vertical arrows interrupting the points for patient 1 at age 12.8 months and those for patient 2 at age 3.4 months indicate the start of dietary methionine restriction. Analyses were carried out in four groups determined by the availability of samples. Group 1 contained the sample from patient 1, age 11 months; group 2, samples from patient 1, ages 13.8−18.6 months; group 3, samples from patient 1, ages 23.8−31.6 months and patient 2, ages 0.8−3.4 months; group 4, samples from patient 1, ages 30.9−43.4 months (including repeat assays of the samples from 30.9 and 31.6 months) and patient 2, ages 4.4−13.5 months. Because the value for a given sample may vary slightly in serial analyses, to ensure maximum comparability the sample from patient 1 at age 17.7 months was reassayed along with groups 3 and 4. All values from these assays were then multiplied by a correction factor of 0.87699, calculated to make the corrected values for the sample from patient 1 at 17.7 months the same for all groups. Corrected values are plotted. The regression lines shown for each patient were calculated starting with the onset of dietary methionine restriction. Controls were either infants, ages 1 or 3 months (corrected values 2263 and 2730, respectively, assayed with group 3, indicated by ×'s), or samples from older children, ages unspecified, whose samples were assayed with either group 1 (n = 4) or group 2 (n = 3). The means for these two sets of control samples were not statistically different, so the resulting overall control value (4125 ± 714 SD; n = 7) is shown as the grey area between the mean + 1 SD (4839) and the mean − 1 SD (3411)
Sequencing of exon 4 of the AdoHcy hydrolase gene revealed the same two mutations as previously described in the older brother (Barić et al 2004): a maternally derived codon 112 change converting TGG to the stop codon TGA (c.336G>A; p.W112X), and a paternally derived tyrosine-to-cysteine change (c.428A>G; p.Y143C).
TREATMENT
Outcomes during treatment of patient 2
To attempt to lower the AdoHcy and AdoMet, a low-methionine diet was introduced at age months, providing about 15 mg methionine/kg body weight per day over the whole follow-up period, i.e. until the age of 19 months. Methionine-free infant formula (‘X-met Analog’, Scientific Hospital Supplies, Liverpool, UK) was added to prevent shortages of other amino acids and provide balance of other nutrients. Phosphatidylcholine (Phosal 75 SA, Nattermann Phospholipid GmbH, Cologne, Germany) was supplemented at a dose of 2 × 600 mg daily. Creatine (American Muscle, Texas, USA) supplementation of 3 g/day was started one week later. After a few weeks on this therapy, the boy gradually became more alert with obviously improved spontaneous movements. He gained strength, although he remained hypotonic, as shown in particular by diminished head control. At age months, phosphatidylcholine was increased to 3 × 600 mg daily and creatine to 4 g daily. Convergent strabismus gradually disappeared after the sixth month of age. Rolling over started at 7 months, unsupported sitting at about 10 months, and crawling at 11 months. At that time, speech started with two-syllable words. At 13 months, psychological evaluation demonstrated mild delay of psychomotor development, with a DQ of 0.79. Motor development, speech and socialization corresponded to an age of 10 months, while oculomotor coordination was at the 12-month level. He was able to stand and started supported walking. Muscular hypotonia remained, but was less evident. Weak tendon reflexes could be elicited only sporadically and with difficulty.
Brain MR imaging at age months revealed significant improvement, with almost normal myelination for the patient's age (Figure 1C).
A biopsy of the right deltoid muscle was done at age months. Histological examination revealed fairly normal muscle fibres except for slightly increased variation in fibre size. Immunohistochemically, expressions of dystrophin, merosin and alpha-sarcoglycan were normal. Electron-microscopic examination revealed a small number of myelin figures with different sizes and shapes and focal myofibrillar degeneration in the subsarcolemmal regions of an occasional muscle fibre.
Therapeutic efforts have not had significant effects on routine markers of muscle involvement. Creatine kinase ranged from 330 to 3370 U/L with a mean of 1419 ± 964 (SD; n = 11). ALT likewise did not normalize, ranging from 27 to 245 U/L with a mean of 86 ± 58 (SD; n = 11). While dietary methionine restriction kept plasma methionine low, between 2.9 and 8.9 μmol/L, the other essential amino acids remained normal, and plasma proteins and albumin were close to the lower limit. Plasma AdoMet decreased to the range 41−239 nmol/L (Figure 2) with a mean of 114 nmol/L (Table 1). Plasma AdoHcy dropped to the range 16−144 nmol/L (Figure 2) with a mean of 56 nmol/L (Table 1). Values for other relevant metabolites during treatment are summarized in Table 1. In brief, plasma tHcy decreased to a low mean value of 3.1 μmol/L; cystathionine decreased but has always been within the reference range; plasma tCys was usually slightly low. Sarcosine and dimethylglycine were elevated, attributable at least in part to the administration of choline (as phosphatidylcholine). Four days after introduction of the low-methionine diet, plasma phosphatidylcholine was 1035 μmol/L, choline 13.1 μmol/L and betaine 70.9 μmol/L. Fifty-two days after the start of creatine supplementation, plasma guanidinoacetate was 2.14 μmol/L and creatine was 236 μmol/L.
Leukocyte DNA methylation did not normalize during 10 months of therapy, although there may have been a trend towards less methylation (Figure 3).
Treatment and outcome of patient 1 (the older brother)
A methionine-restricted diet was started at age 13 months. Methionine restriction (initially 15 mg/kg per day) was reached by limitation of normal, age-appropriate food (protein). Requirements of the other amino acids and nutrients were provided by use of a methionine-free infant formula (initially ‘X-met Analog’, then also M-AM2 (both from Scientific Hospital Supplies, Liverpool, UK). Supplemental phosphatidylcholine was provided, initially at age 13 months, mainly as two half egg yolks/day, then, starting at 17 months, partly as purified phosphatidylcholine, 3 × 600 mg/day. Supplemental creatine monohydrate, 5 g daily, was added at age 13 months. Subsequent dosage changes are presented in Figure 4.
Figure 4.
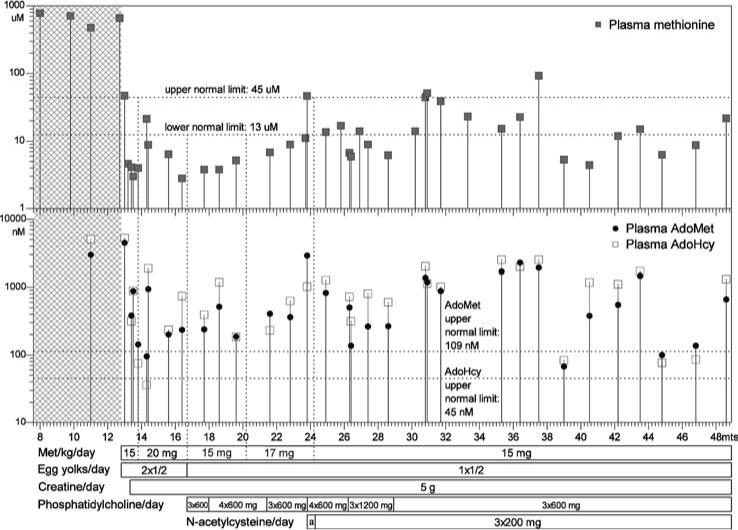
Patient 1: plasma methionine, S-adenosylmethionine and S-adenosylhomocysteine concentrations. The plot is drawn in same manner as that in Figure 2. Area marked by ‘a’ indicates the time span when the patient received N-acetylcysteine at a dose of 3 × 100 mg/day
Gradual, but constant, clinical improvement has been noted in the first few months after start of treatment. The boy gained strength and motor ability and became alert and communicative. He was able to walk without support at age 19 months. His muscles were apparently firmer than before. Patellar reflexes could be elicited occasionally, although with some difficulty. At age 2 years his DQ was 0.65, indicating mild delay. All tested functions were equally developed. After that period, his clinical condition remained stable. At age 3years, DQ was 0.67 with motor functions and expressive speech affected more than other functions. At age 3 years 8 months, i.e. 4 months before the end of the period covered in this report, his height was 101 cm (25th to 50th centile), weight 18 kg (75th to 90th centile) and head circumference 49 cm (3rd to 10th centile).
Creatine kinase remained elevated: pretreatment mean, 2690 ± 841 U/L (SD; n = 7); post-treatment mean, 4142 ± 2054 U/L (SD; n = 40). For ALT the mean pretreatment value was 716 ± 491 U/L (SD; n = 7). During treatment these values tended initially to decrease, but afterwards were relatively stable so that the overall mean became 210 ± 69 U/L (SD; n = 40). Serum albumin during treatment was mostly in the lower normal range. The prothrombin time shortened following treatment. However, it was still frequently above the normal limit, but was responsive to vitamin K. Other coagulation changes included undetectable to low factor VII; low antithrombin, antithrombin antigen, protein S and plasminogen; low to normal fibrinogen, factor II, and factor X; high factor V and D-dimers.
With methionine restriction the plasma concentrations of AdoHcy, AdoMet and methionine decreased markedly, but they varied considerably (Figure 4 and Table 1). Methionine was usually low or within the control range, but AdoHcy and AdoMet usually remained elevated with abnormally low AdoMet/AdoHcy ratios. tHcy became low and cystathionine decreased to values within the control range. tCys was slightly low and was not significantly raised by supplementation with N-acetylcysteine. Despite phosphatidylcholine supplementation, the mean plasma level of this compound remained somewhat low, while choline increased and became virtually normal. During treatment, betaine, dimethylglycine and sarcosine were elevated (Table 1). Three weeks after the start of the low-methionine diet and 1 week after start of creatine supplementation, plasma guanidinoacetate was 2.3 μmol/L (reference range 0.20−1.64) and plasma creatine 1419 μmol/L (reference range 50−124). At the same time, in CSF guanidinoacetate was 2.5 μmol/L (reference range 0.015−0.10) and creatine 99 μmol/L (reference range 35−90). Urine guanidinoacetate and creatine were normal.
DNA methylation did not normalize after treatment for as long as 31 months, although (as in patient 2) there may have been a trend towards decreased methylation (Figure 3). Brain MR imaging was repeated at age 20 months and revealed striking improvement (Figure 5). Although an increase in myelination normally occurs over the age span in question, the patient's myelination went from markedly decreased for his age at 13 months to nearly normal for his age at 20 months. On brain proton MR spectroscopy the unassigned inverted peak near 3.78 ppm had disappeared (Figure 6).
Figure 5.
MRI studies (axial T2) of the brain of patient 1 at ages (A) 12.7 months, before therapy, and (B) 19.6 months, after 7 months of treatment. (A) Myelination is present only in the posterior part of the internal capsule (arrowhead). Note the clear delineation of globi pallidi because of unmyelinated lateral and medial lamina (double black arrow). The pattern of myelination corresponds to an age of 2−3 months. (B) There is marked improvement, with nearly normal myelinization for this age. There is only slight hyperintensity in peritrigonal white matter and in cortical U-fibres in frontal and temporal gyri. Note persistent, mildly to moderately enlarged subarachnoid spaces in the frontal and temporal lobes
Figure 6.
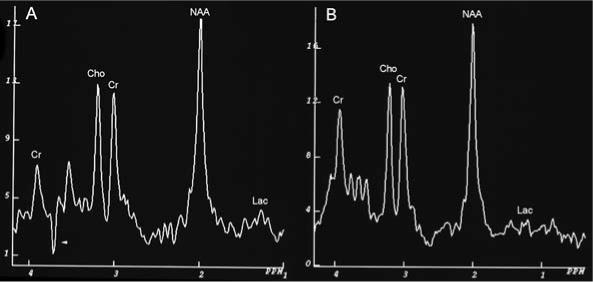
Proton MR spectra of occipital subcortical white matter of patient 1 at ages 12.7 months, (A) before therapy, and (B) 19.6 months, after 7 months of treatment. Cr, creatine/phosphocreatine; Cho, choline; NAA, N-acethylaspartate; Lac, lactate. The Cho/Cr ratios in both spectra are abnormally low: 1.03. and 1.10, respectively. The normal ratio for this age span is about 1.81 ± 0.16 (Filippi et al 2003). In the spectrum at 12.7 months there is an unresolved inverted peak at 3.78 ppm (arrowhead). There is a small increase in the lactate peak in the MR spectrum at 12.7 months
At age 31 months, to determine the relevance of the time of sampling for measurements of methionine, AdoMet and AdoHcy in relation to meals, we analysed the profiles of these metabolites following either a meal with a methionine content average for the low-methionine diet, or a methionine-rich meal taken ad libitum.Following the meal usual for the low-methionine diet, plasma methionines remained unchanged (4 μmol/L) before and 60 and 120 min after the meal. Plasma AdoMet was 267, 198 and 157 nmol/L, respectively; plasma AdoHcy was 600, 362 and 372 nmol/L, respectively. At the same times AdoMet/AdoHcy ratios were 0.45, 0.55 and 0.42, respectively. Following the methionine-rich meal, methionine increased 32, 52 and 56 μmol/L (before and 60 and 120 min after the meal). Plasma AdoMet was 1182, 2659 and 1396 nmol/L, respectively; plasma AdoHcy was 1134, 2788 and 1699 nmol/L, respectively. At the same times, AdoMet/AdoHcy ratios were 1.04, 0.95 and 0.82, respectively. These profiles suggest that when the patient is on a low-methionine diet with methionine intake evenly distributed during the day, the time of sampling is not important for assessing methionine-related metabolites. However, a single methionine-rich meal can significantly increase AdoHcy and AdoMet, pointing to the importance of strict compliance with methionine restriction in order to keep AdoHcy at desired low levels.
DISCUSSION
The birth of a younger brother of the first individual proven to have AdoHcy hydrolase deficiency (Barić et al 2004) provided an opportunity to carefully follow from birth a child at risk for this condition. Indeed, it was soon shown that this younger brother is a compound heterozygote for the same two inactivating mutations in the gene encoding AdoHcy hydrolase that had been found in the index patient. During the ensuing observations, both similarities and differences between the two brothers have become evident.
Similarites between patients 1 and 2
Probable congenital myopathy due to AdoHcy hydrolase deficiency
Patient 2 manifested signs of myopathy from birth: hypotonia, sluggishness, weak or absent primitive reflexes, and absent tendon reflexes. He had slow psychomotor development, continuously high CK and elevated cord blood AdoMet and AdoHcy. Although for patient 1 the disease was not closely monitored during the first months of life, it was reported that his psychomotor development was slow from the beginning, suggesting prenatal onset in this child too. In utero lethality of mice with a deletion that includes the AdoHcy gene is in accord with this impression (Miller et al 1994). Together, these findings suggest that myopathy might be a characteristic, probably congenital finding in AdoHcy hydrolase deficiency. Muscle histology changes were unspecific, similar in both brothers but less expressed in the younger one. It is still unclear how AdoHcy hydrolase deficiency affects muscle. Choline depletion may lead to muscle disease (da Costa et al 2002), but the persistent elevation of creatine kinase despite phosphatidylcholine (and creatine) supplementation suggests that lack of these compounds is not the sole cause of adverse muscle effects in the present patients.
Disturbed myelination
This effect also seems to occur early. One of the possible causes might be inhibition of myelin basic protein–arginine N-methyltransferase (Kim et al 1997), resulting in abnormal methylation of myelin basic protein, an important constituent of myelin. It has been shown that 100-fold elevation of AdoHcy decreases the activity of this methyltransferase by about 90% (Ghosh et al 1988). Improvement following the decrease of AdoHcy during the methionine-restricted diet is consistent with this hypothesis.
Metabolic abnormalities and changes during therapy (Table 1)
The major metabolic abnormalities present before treatment in both brothers were marked elevations of plasma AdoHcy, AdoMet and methionine. As discussed (Barić et al 2004), these rises are attributed, respectively, to decreased activity of AdoHcy hydrolase, generalized inhibition of multiple AdoMet-dependent transmethylation reactions by AdoHcy, and downregulation of the flux from methionine into AdoMet when AdoMet is greatly increased. Dietary methionine restriction led to marked decreases in the plasma concentrations of these metabolites in both boys. Both boys also had slightly elevated plasma cystathionine concentrations. Diversion of any available homocysteine towards cystathionine synthesis due to stimulation of CBS activity by AdoMet (Finkelstein et al 1975; Kluijtmans et al 1996; Oliveriusova et al 2002) and by AdoHcy (Finkelstein et al 1974) may have contributed. A likely additional cause was methionine inhibition of cystathionine γ-lyase, the enzyme that catabolizes cystathio-nine (Stabler et al 2002). Each brother also had elevated plasma sarcosine concentrations, probably due to increased flux through glycine N-methyltransferase. The catalytic rate of this enzyme is enhanced by AdoMet and the activity is relatively resistant to inhibition by AdoHcy (Mudd et al 2001). Inhibition of betaine-homocysteine methyltransferase by AdoHcy (Finkelstein et al 1974) and methionine (Allen et al 1993) may have contributed to the pretreatment elevation of betaine in patient 1, but the elevations of DMG in both brothers are unexplained. During treatment, phosphatidylcholine supplementation contributes to elevations of these compounds and of sarcosine.
DNA methylation
Before treatment, the extent of genome-wide methylation of leukocyte DNA appeared to be increased in both brothers (Figure 3), although accurate assessment of the extent of this phenomenon at each time-point studied is limited by the fact that the extent of global leukocyte DNA methylation has, to our knowledge, never been carefully documented as infants pass through the first year or two of postnatal life. Despite this limitation, the present data provide no indication of decreased methylation of leukocyte DNA such as might have been expected on the basis of published evidence that AdoHcy inhibition of DNA methyltransferases leads to DNA hypomethylation (Caudill et al 2001; Yi et al 2000). However, variation between tissues in the extents of DNA hypomethylation due to elevated AdoHcy have led to the suggestion that regulation of DNA methylation is a complex phenomenon with tissue-specific differences (Choumenkovitch et al 2002). Although it is firmly established that differential methylation states exist in the human genome, the mechanisms underlying these differences remain uncertain (Jones 2003; Reik et al 2001; Ulrey et al 2005). If AdoHcy is elevated in AdoHcy hydrolase-deficient patients during early gestation, as it was found to be in the cord blood of patient 2, the complex reprogramming of DNA methylation that occurs during embryonic development (Reik et al 2001) might be affected. A situation with certain similarities to that found in the present patients has been described by Yung and colleagues (Yung et al 2001). These authors found, surprisingly, that with age both lymphocyte and brain DNA became more methylated in mice heterozygous for a null mutation in DNA methyltransferase 1 (Dnmt1) than did the DNA of control mice. They suggest that there might be a compensatory mechanism to overcome a tendency to decreased Dnmt1 activity, and discuss a number of effects that might account for the observed increased methylation. The apparently excessive methylation of DNA persisted in patients 1 and 2 during dietary methionine restriction monitored for periods of as long as 34 and 10 months, respectively, although for both there appears to have been a tendency towards a lesser degree of increased methylation (Figure 3). Such persistence may not be unexpected because altered DNA methylation patterns often behave as heritable changes, producing important effects that include gene silencing and increased rates of somatic mutation (Robertson and Jones 2000).
Differences between patients 1 and 2
Patient 2 has less severe myopathy, attained developmental milestones earlier and had less marked histological changes in muscle than did patient 1, and had neither manifest liver disease nor clotting disturbance. Both before and during treatment, his concentrations of plasma AdoHcy, AdoMet and methionine were not as high as in patient 1 (Figures 2 and 4). Although these lines of evidence may suggest that patient 2 is initially more mildly affected than is his older brother, this conclusion is equivocal for several reasons: treatment for patient 1 started at age 12.8 months, whereas that for patient 2 started at age 3.4 months; there were differences in the ages (and corresponding body protein synthesis rates) at which metabolite measurements were made; and there were differences in dietary methionine intakes in the period just before the diagnoses were made (patient 2 was breast-fed; patient 1 was taking mixed infant food).
Comparison of AdoHcy hydrolase activities in RBC haemolysates from patients 1 and 2
To explore the possibility that, although the brothers have the same AdoHcy hydrolase mutations, an additional factor (or factors) might make the enzyme deficiency less severe in patient 2, AdoHcy hydrolase activities were compared in simultaneous assays of RBC haemolysates prepared from cells collected at the same time and stored frozen relatively-briefly for the same period (Table 2). No significant difference in the residual activities of patients 1 and 2 were observed. In the same assays were included four control haemolysates obtained from children spanning the ages of patients 1 and 2. There was no indication of age-dependent changes in these control AdoHcy hydrolase activities that might confound comparison of the activity in patient 1 with that in patient 2. Of course these results do not rule out a difference between patients 1 and 2 in activity in liver or other organ(s) more important than red cells in overall AdoHcy metabolism. Since there is only a single functional human AdoHcy hydrolase gene, and the patients each inherited the same pair of alleles, it seems unlikely that any clinical differences between them are due to variations in this gene.
Treatment efficacy
Given that mammals possess at least 39 AdoMet-dependent methyltransferases, and that most, if not all, of these are inhibited by AdoHcy (Clark and Banfield 2001), the pathophysiology of AdoHcy hydrolase deficiency is likely to be very complex (see Barić et al (2004) for more extensive discussion of this point). The treatment regimen used for both patients had as its chief aims (a) reduction of the pathological accumulation of AdoHcy which, in turn, might alleviate AdoHcy inhibition of AdoMet-dependent methyltransferases; and (b) replenishment of creatine and phosphatidylcholine, two quantitatively dominant products of AdoMet-utilizing methyltransferases (Mudd and Poole 1975; Brosnan et al 2004) that might play roles in brain and muscle structure and function and that, furthermore, could safely be administered orally. During methionine restriction, plasma AdoHcy concentrations did indeed decrease markedly. Indication that inhibition of methyltransferases was to some extent relieved is provided by the decreases that occurred in AdoMet concentrations, although low methionine concentrations probably also contributed to this decrease in AdoMet. At least in patient 1, both AdoHcy and AdoMet concentrations fluctuated widely during methionine restriction, and both these compounds usually remained far above normal. Variations in plasma methionine suggest there may have been fluctuations in dietary compliance, so that changes in methionine intake may have played a role in the variation and persistence of the AdoHcy and AdoMet elevations.
Encouraging clinical changes following initiation of therapy were the altered behaviours (disappearance of sluggishness, acceleration of psychomotor development) and the significant improvements of brain myelination that occurred in both brothers. These changes were more evident in the more severely affected older brother. The liver function of the older brother, judged by albumin and fibrinogen concentrations, ALT, and to some extent by prothrombin time, seemed to improve during treatment, although this conclusion remains tentative. It seems reasonable to conclude provisionally that the treatment regimen utilized had some beneficial effect on the clinical course of the disease.
Detection of AdoHcy hydrolase deficiency
If AdoHcy hydrolase deficiency is really amenable to treatment, an important issue would be early recognition. However, for patient 1 blood methionine was shown by retrospective analysis of the newborn screening blood spot card to be below the cut-off value in use at the time by the relevant screening programme; and for patient 2 during the newborn period plasma methionine was often borderline or only slightly elevated (Table 1 and Figure 2), below the cut-off values of at least some current screening programmes. These observations suggest that screening based on detection of marked hypermethioninaemia during the newborn or early neonatal periods may fail to detect at least some cases. Assay of plasma AdoHcy might offer a better chance of success.
Possible additional cases of AdoHcy deficiency
In an effort to better characterize AdoHcy hydrolase deficiency, we have tried to investigate additional patients for whom there were some grounds for supposing they might have this abnormality:
The three nonmyopathic patient siblings described by Labrune (Labrune 1990), and thought by those authors possibly to be affected by AdoHcy hydrolase deficiency: Comparison of DNA samples from the parents of these individuals with those for the AdoHcy hydrolase gene sequence listed in public databases (accession no. AL356299) showed no aberrations in splice sites or in the coding regions of the parental AdoHcy genes, results that provide no indication that these siblings were AdoHcy hydrolase deficient.
The girl, age years, described by Gaull and co-workers with elevation of plasma methionine, but not of tHcy, and above normal activity of liver methionine adenosyltransferase activity (Gaull et al 1981): This girl was similar to patients 1 and 2 in regard to having myopathy, muscle histology similar to theirs, and markedly elevated creatine kinase. As yet, it has not been possible to carry out further studies of this family.
A male infant with unexplained hypermethioninaemia and myopathy, mentioned very briefly in the paper by Gaull and co-workers as a personal communication (1980) from Dr Neil Buist (Gaull et al 1981): This individual, now aged 26 years, has very recently been reinvestigated and shown to have AdoHcy hydrolase deficiency (N. Buist, S. Stabler, O. Vugrek, C. Wagner, S.H. Mudd, unpublished observations). It is hoped that studies of this men, now underway, will provide further information about the clinical course and the metabolic abnormalities associated with this recently recognized condition.
ACKNOWLEDGEMENTS
This work was supported by grants 0108016 of the Ministry of Science, Education and Sport of Republic of Croatia, National Institutes of Health grants DK55865, DK56359 and DK15289, National Institute on Aging grant AG-09834, and support to C. Wagner from the Research Service of the Department of Veterans’ affairs, and from Clinical Nutrition Research Unit grant #5P30 DK26657 to Vanderbilt University. Mrs Višnja Hrustić and her colleagues are greatly acknowledged for their excellent professional collaboration. Phosphatidylcholine was kindly provided by Miklos Ghyczy (Nattermann Phospholipid GMBh, Germany). We thank Professor Philippe Labrune for providing the DNA samples of family members of patients suspected to suffer from AdoHcy hydrolase deficiency.
REFERENCES
- Allen RH, Stabler SP, Lindenbaum J. Serum betaine, N,N-dimethylglycine and N-methylglycine levels in patients with cobalamin and folate deficiency and related inborn errors of metabolism. Metabolism. 1993;42:1448–1460. doi: 10.1016/0026-0495(93)90198-w. [DOI] [PubMed] [Google Scholar]
- Barić I, Fumić K, Glenn B, et al. S-Adenosylhomocysteine hydrolase deficiency in a human: a genetic disorder of methionine metabolism. Proc Natl Acad Sci USA. 2004;101:4234–4239. doi: 10.1073/pnas.0400658101. [DOI] [PMC free article] [PubMed] [Google Scholar]
- Bradford MM. A rapid and sensitive method for the quantitation of microgram quantities of protein utilizing the principle of protein–dye binding. Anal Biochem. 1976;72:248–254. doi: 10.1016/0003-2697(76)90527-3. [DOI] [PubMed] [Google Scholar]
- Brosnan JT, Jacobs RL, Stead LM, Brosnan ME. Methylation demand: a key determinant of homocysteine metabolism. Acta Biochimica Polonica. 2004;51:405–413. [PubMed] [Google Scholar]
- Capdevila A, Wagner C. Measurement of plasma S-adenosylmethionine and S-adenosylhomocysteine as their fluorescent isoindoles. Analyt Biochem. 1998;264:180–184. doi: 10.1006/abio.1998.2839. [DOI] [PubMed] [Google Scholar]
- Caudill MA, Wang JC, Melnyk S, et al. Intracellular S-Adenosylhmocysteine concentrations predict global DNA hypomethylation in tissues of methyl-deficient cystathionine β-synthase heterozygous mice. J Nutr. 2001;131:2811–2818. doi: 10.1093/jn/131.11.2811. [DOI] [PubMed] [Google Scholar]
- Choumenkovitch SF, Selhub J, Bagley PJ, et al. In the cystathionne β-synthase knockout mouse, elevations in total plasma homocysteine increase tissue S-adenosylhomocysteine but responses of S-adenosylmethionine and DNA methylation are tissue specific. J Nutr. 2002;132:2157–2160. doi: 10.1093/jn/132.8.2157. [DOI] [PubMed] [Google Scholar]
- Clarke S, Banfield K. S-Adenosylmethionine-dependent methyltransferases. In: Carmel R, Jacobsen DW, editors. Homocysteine in Health and Disease. Cambridge University Press; Cambridge, UK: 2001. pp. 63–78. [Google Scholar]
- da Costa K, Kwock L, Hooker J, Zeisel SH. Muscle dysfunction occurs in humans depleted of choline. FASEB J. 2002;16:A1023. [Google Scholar]
- De La Haba G, Cantoni GL. The enzymatic synthesis of S-adenosyl-l-homocysteine from adenosine and homocysteine. J Biol Chem. 1959;234:603–608. [PubMed] [Google Scholar]
- Filippi CG, Ulug AM, Deck MD, Zimmerman RD, Heier LA. Developmental delay in children: assessment with proton MR spectroscopy. Am J Neuroradiol. 2003;23:882–888. [PMC free article] [PubMed] [Google Scholar]
- Finkelstein JD, Kyle WE, Harris BJ. Methionine metabolism in mammals: regulatory effects of S-adenosylhomocysteine. Arch Biochem Biophys. 1974;165:774–779. doi: 10.1016/0003-9861(74)90306-3. [DOI] [PubMed] [Google Scholar]
- Finkelstein JD, Kyle WE, Martin JJ, Pick A-M. Activation of cystathionine synthase by adenosylmethionine and adenosylethionine. Biochem Biophys Res Commun. 1975;66:81–87. doi: 10.1016/s0006-291x(75)80297-x. [DOI] [PubMed] [Google Scholar]
- Gaull GE, Bender AN, Vulovic D, Tallan HH, Schaffner F. Methioninemia and myopathy: a new disorder. Ann Neurol. 1981;9:423–432. doi: 10.1002/ana.410090503. [DOI] [PubMed] [Google Scholar]
- Ghosh SK, Paik WK, Kim S. Purification and molecular identification of two protein methylases I from calf brain. Myelin basic protein and histone-specific enzyme. J Biol Chem. 1988;263:19024–19033. [PubMed] [Google Scholar]
- Guerra-Shinohara EM, Morita OE, Peres S, et al. Low ratio of S-adenosylmethionine to S-adenosylhomocysteine is associated with vitamin deficiency in Brazilian pregnant women and newborns. Am J Clin Nutr. 2004;80:1312–1321. doi: 10.1093/ajcn/80.5.1312. [DOI] [PubMed] [Google Scholar]
- Hershfield MS, Kredich NM, Ownby DR, Ownby H, Buckley R. In vivo inactivation of erythrocyte S-adenosylhomocysteine hydrolase by 2′-deoxyadenosine in adenosine deaminase-deficient patients. J Clin Invest. 1979;63:807–811. doi: 10.1172/JCI109367. [DOI] [PMC free article] [PubMed] [Google Scholar]
- Jones PA. Epigenetics in carcinogenesis and cancer prevention. Ann NY Acad Sci. 2003;983:213–219. doi: 10.1111/j.1749-6632.2003.tb05976.x. [DOI] [PubMed] [Google Scholar]
- Kim S, Lim IK, Park GH, Paik WK. Biological methylation of myelin basic protein: enzymology and biological significance. Int J Biochem Cell Biol. 1997;29:743–751. doi: 10.1016/s1357-2725(97)00009-5. [DOI] [PubMed] [Google Scholar]
- Kluijtmans LAJ, Boers GHJ, Stevens EMB, et al. Defective cystathionine β-synthase regulation by S-adenosylmethionine in a partially pyridoxine responsive homocystinuria patient. J Clin Invest. 1996;98:285–289. doi: 10.1172/JCI118791. [DOI] [PMC free article] [PubMed] [Google Scholar]
- Koc H, Mar M-H, Ranasinghe A, Swenberg JA, Zeisel SH. Quantitation of choline and its metabolites in tissues and foods by liquid chromatography/electrospray ionization-isotope dilution mass spectrometry. Anal Chem. 2002;74:4734–4740. doi: 10.1021/ac025624x. [DOI] [PubMed] [Google Scholar]
- Labrune P, Perignon JL, Rault M, et al. Familial hypermethioninemia partially responsive to dietary restriction. J Pediatr. 1990;117:220–226. doi: 10.1016/s0022-3476(05)80533-5. [DOI] [PubMed] [Google Scholar]
- Marchuk D, Drumm M, Saulino A, Collins F. Construction of T-vectors, a rapid and general system for direct cloning of unmodified PCR products. Nucleic Acids Res. 1991;19:1154. doi: 10.1093/nar/19.5.1154. [DOI] [PMC free article] [PubMed] [Google Scholar]
- Marescau B, Deshmukh DR, Kockx M, et al. Guanidino compounds in serum, urine, liver, kidney, and brain of man and urotelic animals. Metabolism. 1992;41:526–532. doi: 10.1016/0026-0495(92)90213-t. [DOI] [PubMed] [Google Scholar]
- Miller MW, Duhl DMJ, Winkes BM, et al. The mouse lethal nonagouti (ax) mutation deletes the S-Adenosylhomocysteine hydrolase (Ahcy) gene. EMBO J. 1994;13:1806–1816. doi: 10.1002/j.1460-2075.1994.tb06449.x. [DOI] [PMC free article] [PubMed] [Google Scholar]
- Morris GS, Simmonds HA. Use of a fundamental elution protocol for the development of reversed phase high performance liquid chromatography enabling rapid simultaneous determinations of purines, pyrimidines and allied compounds commonly found in human biological fluids. J Chromatogr. 1985;344:101–113. doi: 10.1016/s0378-4347(00)82011-3. [DOI] [PubMed] [Google Scholar]
- Mudd SH, Poole JR. Labile methyl balances for normal humans on various dietary regimens. Metabolism. 1975;24:721–735. doi: 10.1016/0026-0495(75)90040-2. [DOI] [PubMed] [Google Scholar]
- Mudd SH, Cerone R, Schiaffino, et al. Glycine N-methyltransferase deficiency: a novel inborn error causing persistent isolated hypermethioninemia. J Inherit Metab Dis. 2001;24:448–464. doi: 10.1023/a:1010577512912. [DOI] [PubMed] [Google Scholar]
- Oliveriusova J, Kery V, Maclean KN, Kraus JP. Deletion mutagenesis of human cystathionine β-synthase. Impact on activity, oligomeric status, and S-adenosylmethionine regulation. J Biol Chem. 2002;277:48386–48394. doi: 10.1074/jbc.M207087200. [DOI] [PubMed] [Google Scholar]
- Pogribny I, Yi P, James SJ. A sensitive new method for rapid detection of abnormal methylation patterrns in global DNA and within CpG islands. Biochem Biophys Res Commun. 1999;262:624–628. doi: 10.1006/bbrc.1999.1187. [DOI] [PubMed] [Google Scholar]
- Reddy MN. Reference ranges for total homocysteine in children. Clin Chim Acta. 1997;262:153–155. doi: 10.1016/s0009-8981(97)06548-0. [DOI] [PubMed] [Google Scholar]
- Reik W, Dean W, Walter J. Epigenetic reprogramming in mammalian development. Science. 2001;293:1089–1093. doi: 10.1126/science.1063443. [DOI] [PubMed] [Google Scholar]
- Robertson KD, Jones PA. DNA methylation: past, present and future directions. Carcinogenesis. 2000;21:461–467. doi: 10.1093/carcin/21.3.461. [DOI] [PubMed] [Google Scholar]
- Sambrook J, Fritsch EF, Maniatis T. Molecular Cloning: A Laboratory Manual. 2nd edn. Cold Spring Harbour Laboratory Press; Cold Spring Harbour: 1989. [Google Scholar]
- Schulze A, Ebinger F, Rating D, Mayatepek E. Improving treatment of guanidionacetate methyltransferase deficiency: reduction of guanidinoacetate in body fluids by arginine restriction and ornithine supplementation. Mol Genet Metab. 2001;74:413–419. doi: 10.1006/mgme.2001.3257. [DOI] [PubMed] [Google Scholar]
- Stabler SP, Marcell PD, Podell ER, Allen RH. Quantitation of total homocysteine, total cysteine, and methionine in normal serum and urine using capillary gas chromatography–mass spectrometry. Anal Biochem. 1987;162:185–196. doi: 10.1016/0003-2697(87)90026-1. [DOI] [PubMed] [Google Scholar]
- Stabler SP, Lindenbaum J, Savage DG, Allen RH. Elevation of serum cystathionine levels in patients with cobalamin and folate deficiency. Blood. 1993;81:3404–3413. [PubMed] [Google Scholar]
- Stabler SP, Steegborn C, Wahl MC, et al. Elevated plasma total homocysteine in severe methionine adenosyltransferase I/III deficiency. Metabolism. 2002;51:981–988. doi: 10.1053/meta.2002.34017. [DOI] [PubMed] [Google Scholar]
- Ulrey CL, Liu L, Andrews LG, Tollefsol TO. The impact of metabolism on DNA methylation. Hum Mol Genet. 2005;14:R139–R147. doi: 10.1093/hmg/ddi100. [DOI] [PubMed] [Google Scholar]
- Vilaseca MA, Moyano D, Ferrer I, Artuch R. Total homocysteine in pediatric patients. Clin Chem. 1997;43:690–692. [PubMed] [Google Scholar]
- Yi P, Melnyk S, Pogribna M, Pogribny IP, Hine RJ, James SJ. Increase in plasma homocysteine associated with parallel increases in plasma S-adenosyhomocysteine and lymphocyte DNA hypomethylation. J Biol Chem. 2000;275:29319–29323. doi: 10.1074/jbc.M002725200. [DOI] [PubMed] [Google Scholar]
- Yung R, Ray D, Eisenbraun JK, et al. Unexpected effects of a heterozygous Dnmt1 null mutation on age-dependent DNA hypomethylation and autoimmunity. J Geronto A: Biol Sci Med Sci. 2001;56A:B268–B276. doi: 10.1093/gerona/56.6.b268. [DOI] [PubMed] [Google Scholar]